Data from the basement
on Friday, August 16th, 2024 5:57 | by Ellie
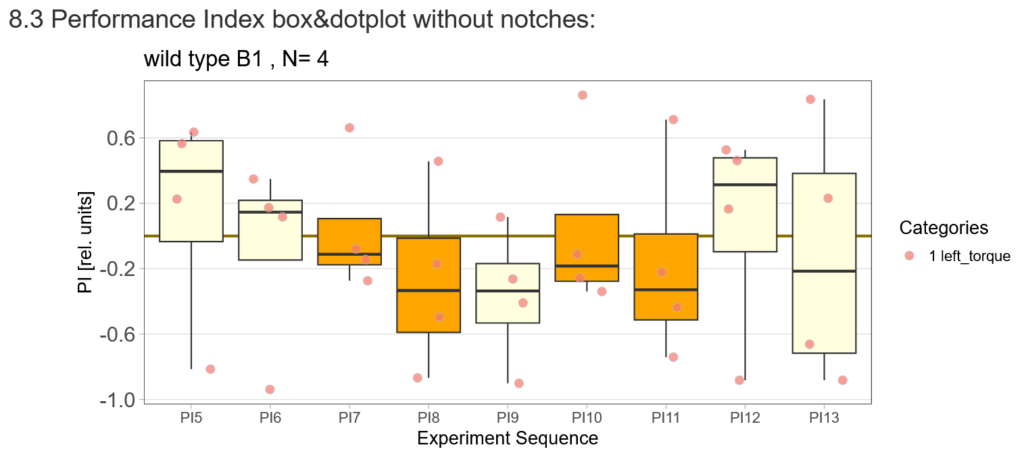
I tested more wtb, this time with the switch mode protocol. Here are the results:


Category: flight, Lab, lab.brembs.net, Memory, Operant learning, R code, science, set-up test, Spontaneous Behavior | No Comments
More data from the basement
on Monday, July 8th, 2024 8:15 | by Ellie
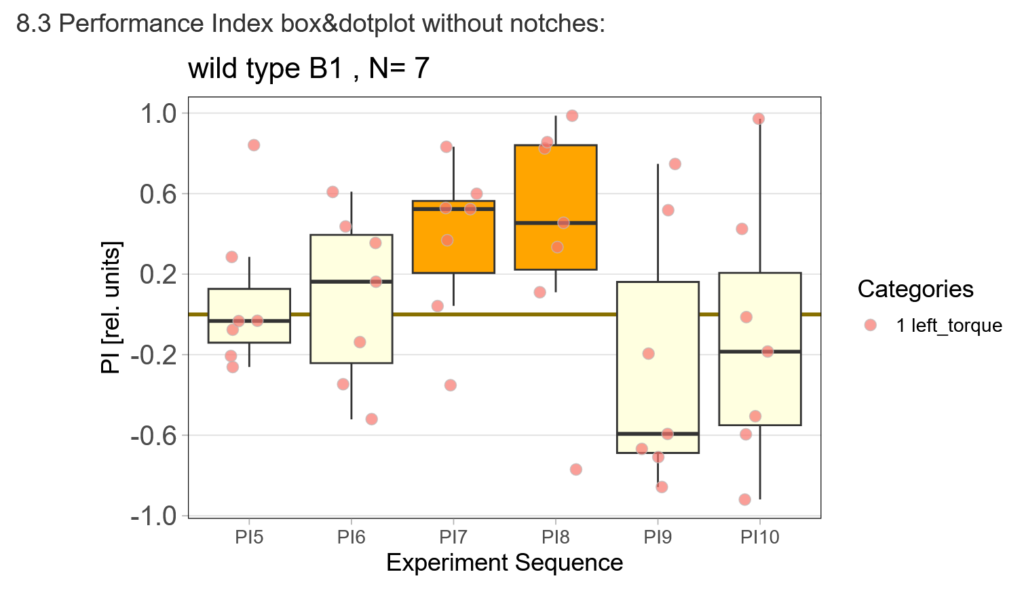
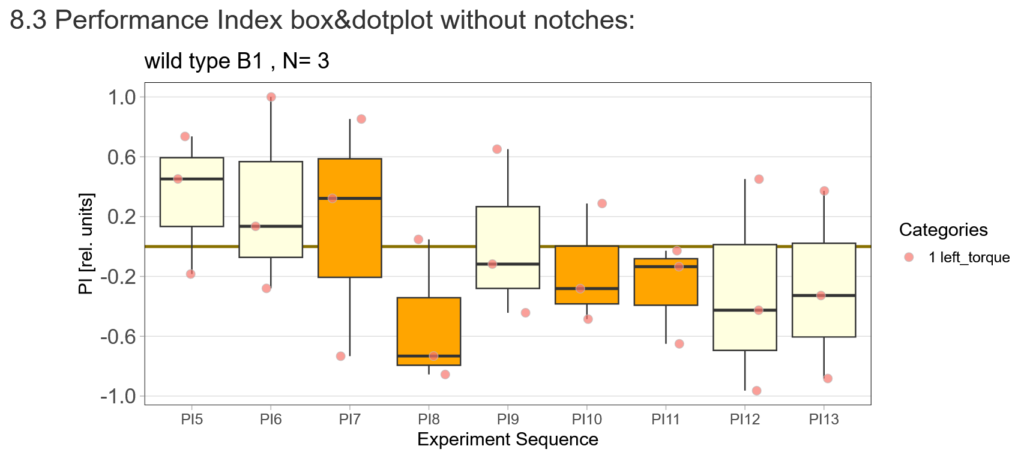
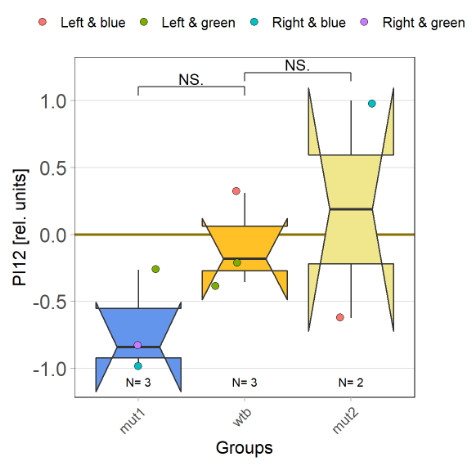
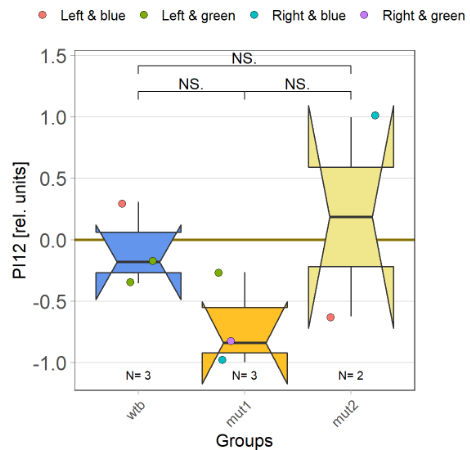
With the modified laser settings I was able to test 3 more wtb. Here are the results:

–> yaw torque
Optomotor graph coded
on Wednesday, February 21st, 2024 10:15 | by Björn Brembs
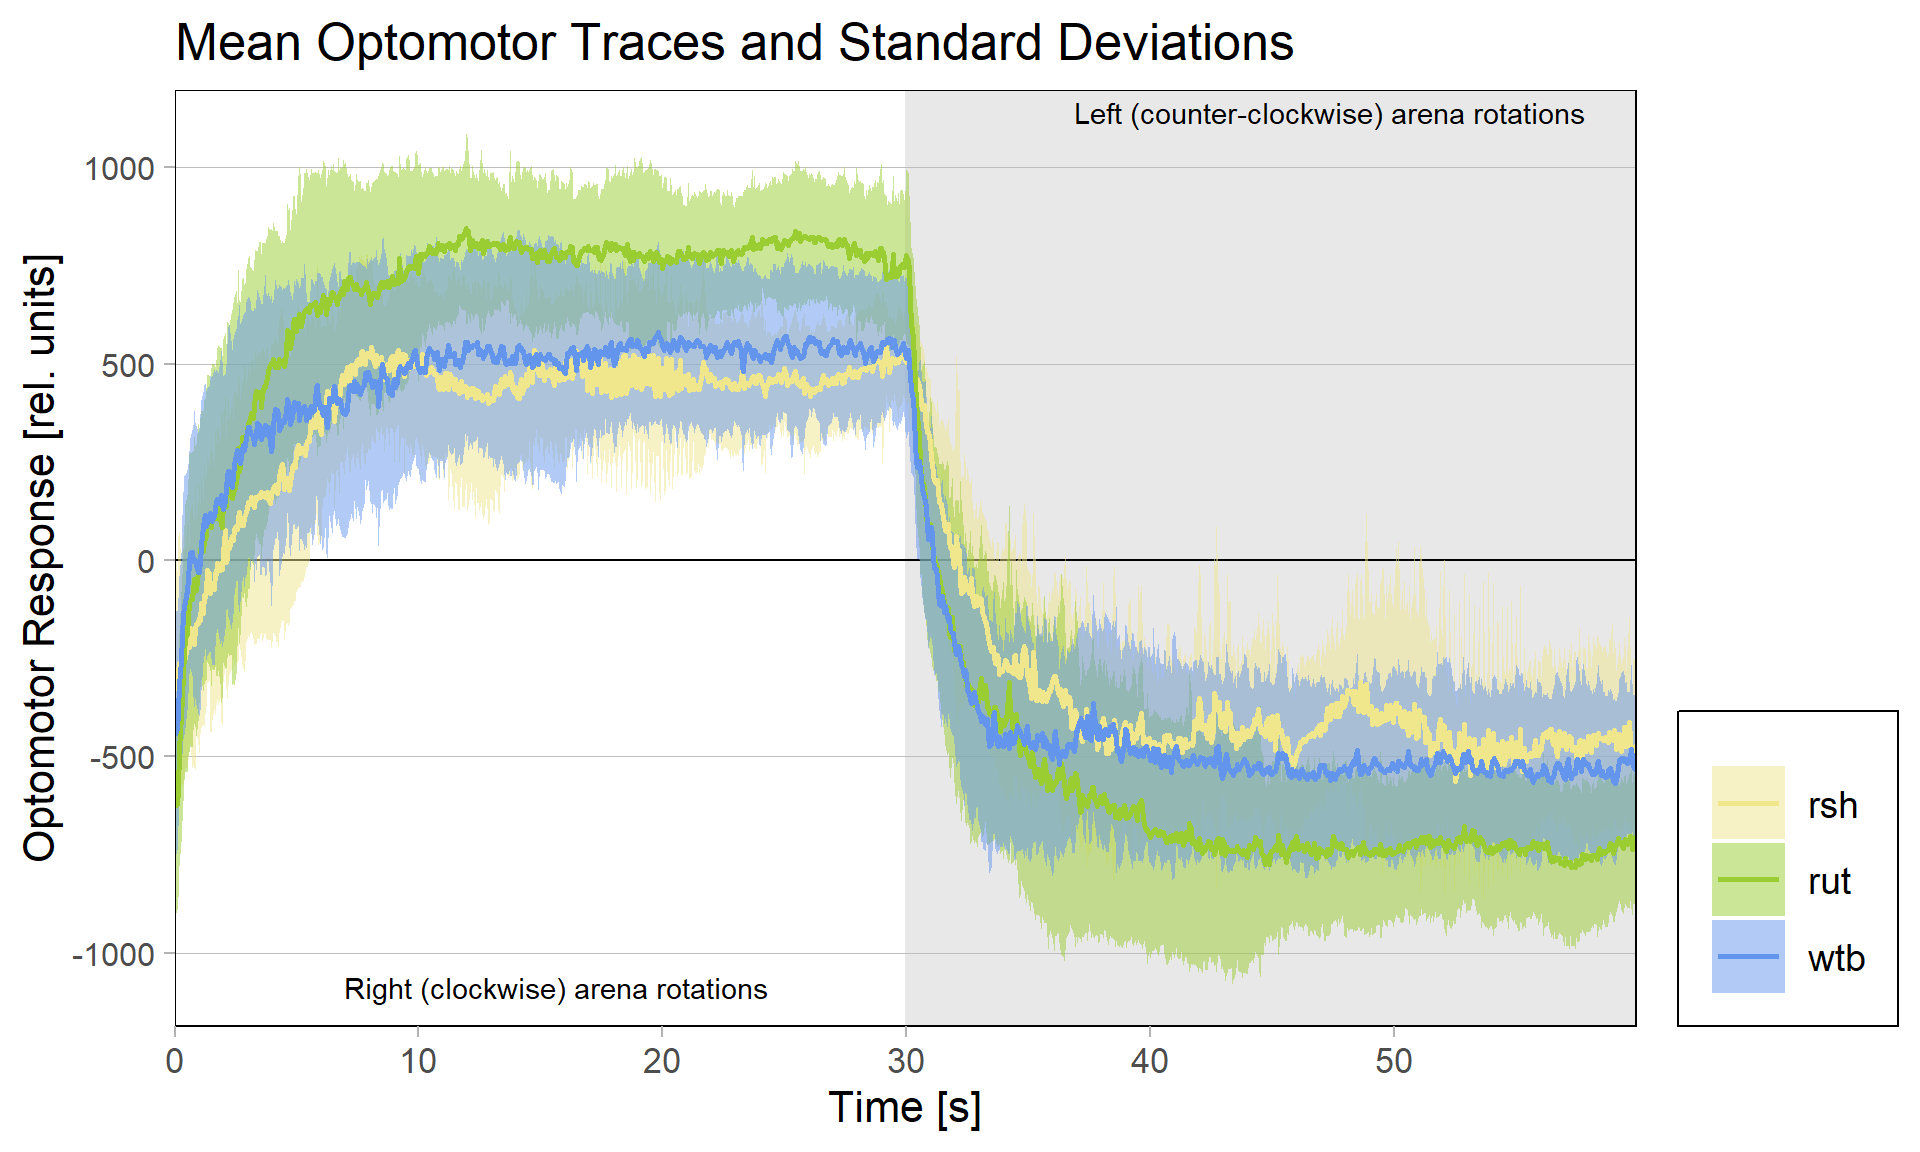
There had been some concerns about the optomotor display in the group evaluation sheets showing right-turning torque on the left side of the graph and vice versa. Also, the use of standard deviations seemed to blur differences between the experimental groups:
Because of these concerns, I have swapped the traces and used standard error of the means instead of standard deviations:
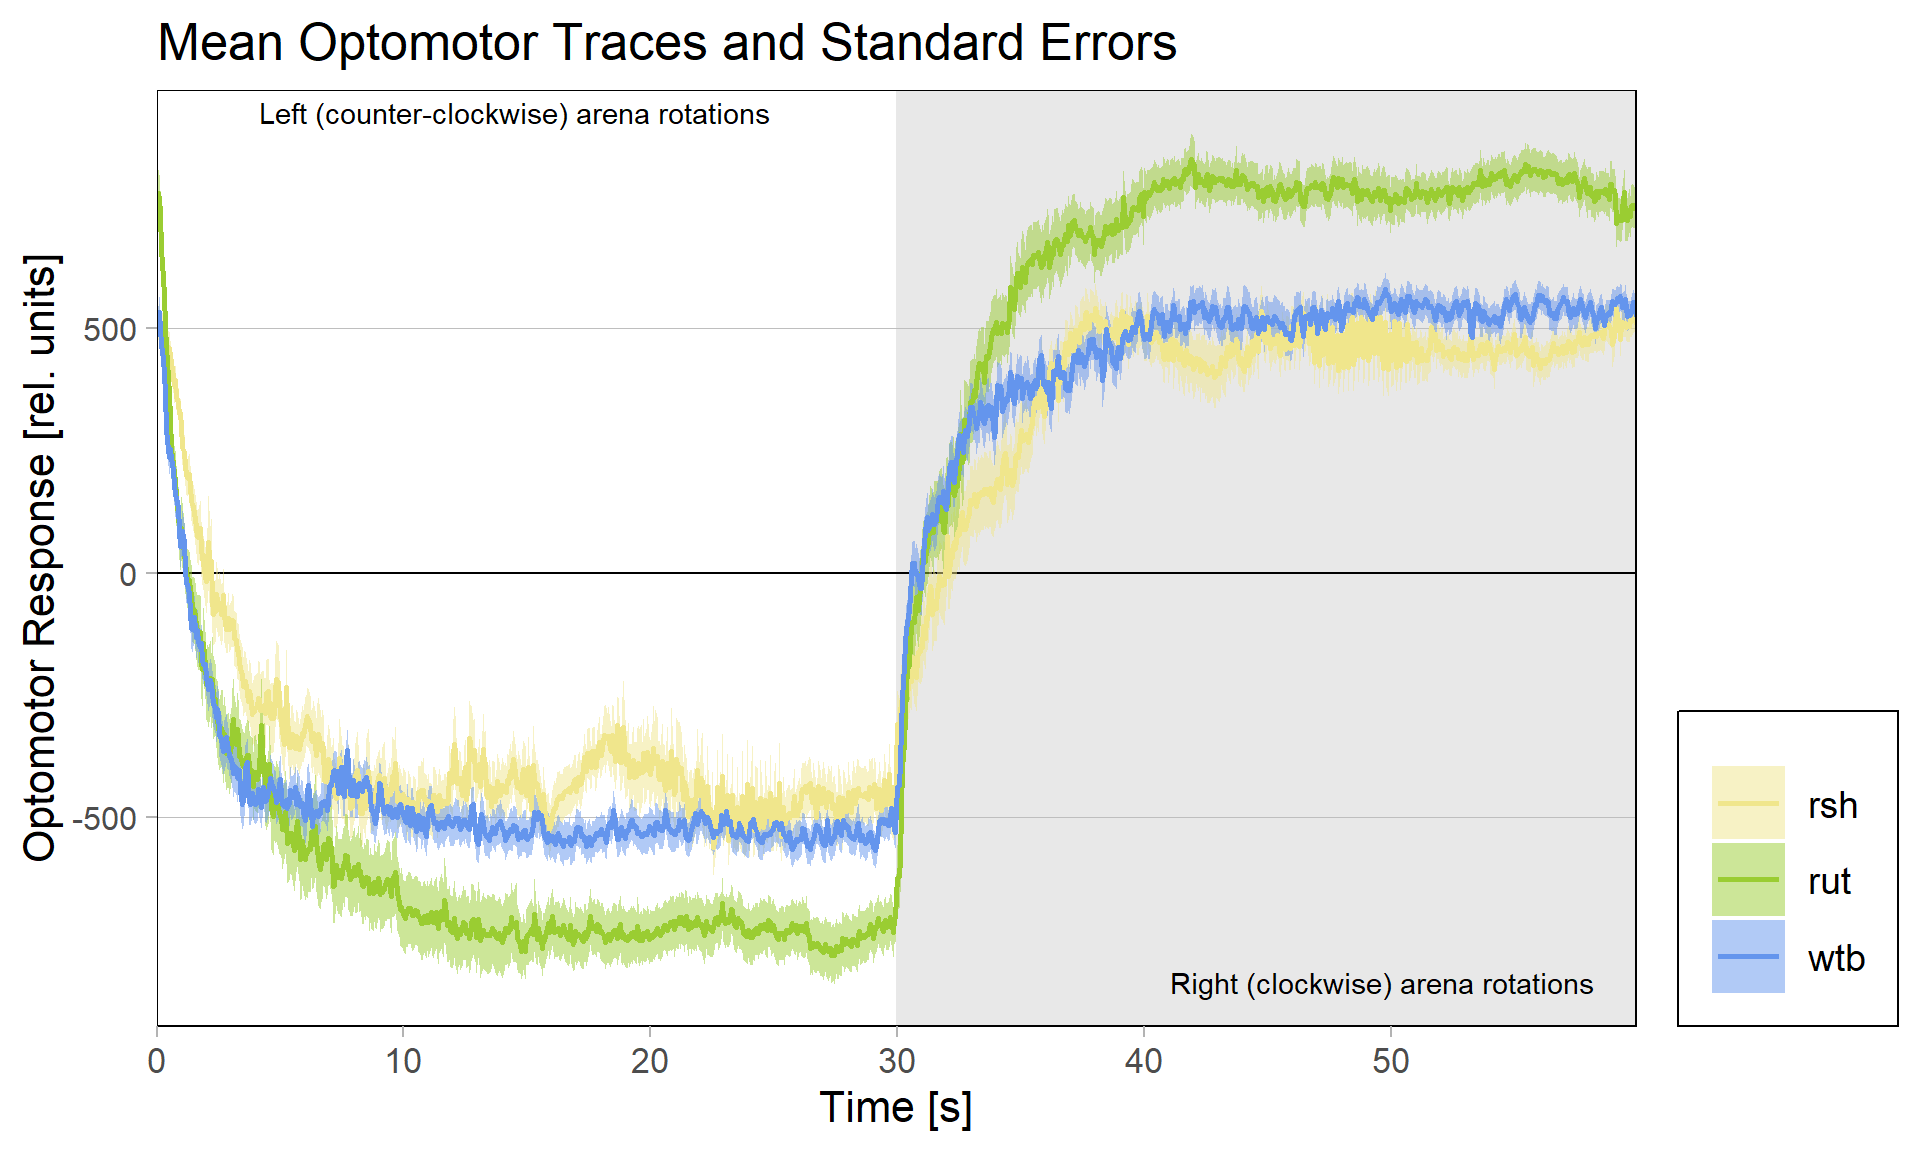
What do you think? Better or worse? Feedback very welcome!
Category: Optomotor response, R code | No Comments
Bachelor Blog / #4 is there something?
on Monday, August 7th, 2023 2:13 | by Ellie
The offspring of my first experimental fly cohort finally hatched! Below you find a few first pre-tests I ran last week :)
First, here are the results of a quick test to see if the offspring shows a preference for the parentally trained side after the first training period:
After that I played around with the laser a little bit to find the learning threshhold. I set the laser on 2,6V but the results I got look a bit weird:
-> untrained wtb flies
-> offspring of trained wtb flies
I´m optimistic however there is still a lot of work to do…
Three Groups Example
on Monday, November 7th, 2022 12:06 | by Silvia Marcato
Pseudocode of the statical analysis with three groups according to the group descriptions.
# If n. of groups = 3 and n. of unique descriptions = 2, then perform
# the statistical analysis between singleton and each doubleton group.
# Else if n. of groups = 3 and descriptions are all identical/different,
# then perform the statistical analysis between each one of them.
if (NofGroups==3 & length(unique(groupdescriptions))==2) {
statistical_analysis(singleton, doubleton_1)
statistical_analysis(singleton, doubleton_2)
plot_results
} else {
statistical_analysis(group_1, group_2)
statistical_analysis(group_1, group_3)
statistical_analysis(group_2, group_3)
plot_results
}
wtb (control), mut_2 (experimental)
Category: R code | No Comments
Three groups issue
on Monday, September 19th, 2022 1:00 | by Silvia Marcato
if(NofGroups == 3 & length(unique(groupdescriptions))==2){

  doubleton <- list()
  singleton <- list()

  if (groupdescriptions[1] == groupdescriptions[2]) {
     doubleton = c(unique(groupdescriptions[1], groupdescriptions[2]),
                   groupnames[1], groupnames[2])
     singleton = c(groupdescriptions[3], groupnames[3])
  }  else if (groupdescriptions[2] == groupdescriptions[3]) {
     doubleton = c(unique(groupdescriptions[2], groupdescriptions[3]),
                   groupnames[2], groupnames[3])
     singleton = c(groupdescriptions[1], groupnames[1])
  }  else {
     doubleton = c(unique(groupdescriptions[1], groupdescriptions[3]),
                   groupnames[1], groupnames[3])
     singleton = c(groupdescriptions[2], groupnames[2])
  }
}
Given three descriptions, splits them into three variables. Two out of three of these are the same while the other is not: the single set to be compared to the two “identical” sets is emplaced in the singleton list while the other two sets are emplaced in the doubleton list.
Category: R code | No Comments
Progress Week 29
on Monday, July 20th, 2020 1:38 | by Anders Eriksson
-Introduced Sayani to the wonderful world of Drosophila
-Been doing some DTS coding
-Preparing flies to do optomotor response for Mathias Raß
Category: flight, genetics, Lab, Memory, Optomotor response, R code | No Comments
Progress week 26-28
on Monday, July 13th, 2020 1:39 | by Anders Eriksson
Updates in DTS code
Refreshing dissection skills
Category: Anatomy, genetics, Lab, neuronal activation, personal, R code, science, Uncategorized | No Comments
Progress for week 25:
on Monday, June 22nd, 2020 1:58 | by Anders Eriksson
DTS coding
-Added progressbar for data validation
-Updated the progress bar (see figure 1)
-Fixed bug with wrong sample size (see figure 2)
-Fixed bug with unorganized barplots (see figure 2)
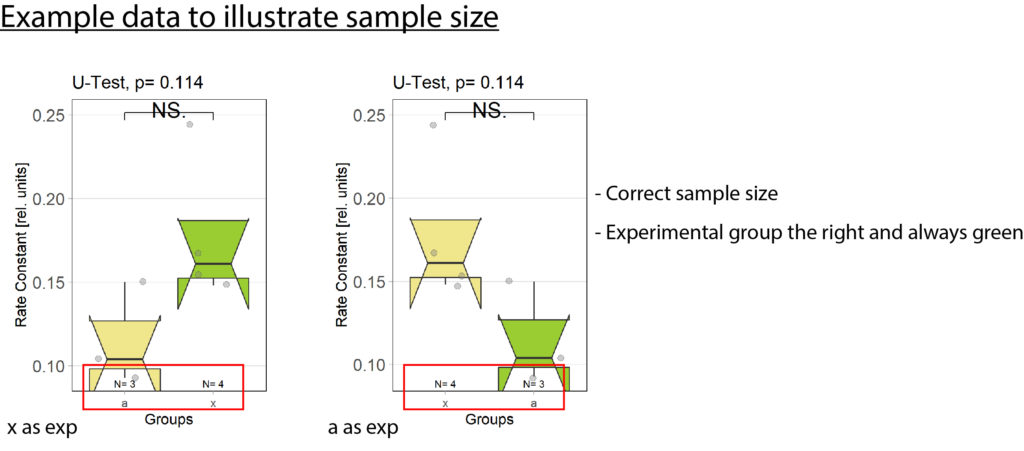
Exp always to the right: plotOMparams <- plotOMparams[order(plotOMparams$desc),]
plotOMparams$group <- factor(plotOMparams$group, levels=paste(unique(plotOMparams$group)))
Samplesize fix:samplesizes.annotate(boxes, as.numeric(table(plotOMparams$desc)))
Progressbar: progress <- c(round(l(100/(length(xml_list)))),round(flycount(100/(totalflies))))
Rescreening:
-Finished rescreening last Thursday. Started to evaluate the new data
Optomotor platform: Ran a few more tests to confirm that the machine was still working, it is. I also adjusted the 0 line so that it is at 0, by readjusting the “zero line” screw. Looks much better now but it is still not perfectly at 0. A difference 0.1 on the computer screen translates to 100 in the evaluation chart.
Optomotor platform:
Ran a few more tests to confirm that the 0 line is always at 0. Readjusted the “zero line” screw. Looks much better now. It is still not perfectly at 0 but a difference of 0.1 in the chart translates to 100 in the evaluation graph.
Category: Lab, Optomotor response, R code, Uncategorized | No Comments
Pooling data not possible: working on a fix
on Tuesday, June 2nd, 2020 12:25 | by Anders Eriksson
Category: R code | No Comments