Optogenetic activation of Mushroom body Kenyon cells affects naïve salt avoidance in Drosophila larvae
on Monday, January 26th, 2026 11:58 | by Radostina Lyutova
The mushroom bodies (MBs) are known to be the most prominent olfactory memory center in Drosophila. The MB Kenyon cells receive olfactory (via projection neurons, PNs) and gustatory (via dopaminergic neurons, DANs) input. The coincident detection of these stimuli elicits then the formation of associative memory. However, little is known whether and how this high order brain center affects naïve behaviors such as olfaction and gustation. We use fruit fly larvae to test the innate salt avoidance in a simple choice assay. Drosophila larvae are tested for 3 minutes for their preference for 1.5M NaCl. We show that salt avoidance is enhanced upon optogenetic activation of the Kenyon cells. This effect was also observed after ablation of pPAM DANs with simultaneous optogenetic activation of the KCs. We were able to phenocopy this effect by optogenetic activation of TH-Gal4 positive dopaminergic neurons, however not after artificial activation of single DANs of the DL1 cluster. In contrast, larvae showed no salt avoidance after optogenetic activation of sNPF-Gal4 positive neurons. Neuropeptidergic and dopaminergic signaling are tightly involved in modulation of the MBs. However, it is not clear whether our observations depend on coherent neuronal pathways. Therefore, we use simultaneous manipulations of different components of the MB, dopaminergic and sNPF circuitries to unravel the neural mechanisms of modulation of naïve gustatory behaviors in the Drosophila larvae.

Category: Biogenic Amines, DAN, Food preference, Kenyon cells, Larvae, Mushroom Body, neuronal activation, Optogenetics, PAM | No Comments
Salt avoidance
on Monday, December 15th, 2025 9:24 | by Radostina Lyutova
5 days old larvae (3rd instar) were tested for their salt (1.5 M) avoidance behavior. Dopaminergic neurons from the TH-D’ cluster were activated upon ChR2-XXL expression and blue light exposure, respectively.
Category: Biogenic Amines, DAN, Food preference, Larvae, neuronal activation | No Comments
Salt (1.5 M) avoidance of 3rd instar larvae
on Sunday, October 12th, 2025 11:53 | by Radostina Lyutova
Category: Biogenic Amines, DAN, Food preference, Larve, neuronal activation, Optogenetics | No Comments
Salt (1.5 M) avoidance of 3rd instar larvae
on Sunday, September 28th, 2025 12:21 | by Radostina Lyutova
Category: Biogenic Amines, DAN, Food preference, Larve, Mushroom Body, neuronal activation, Optogenetics | No Comments
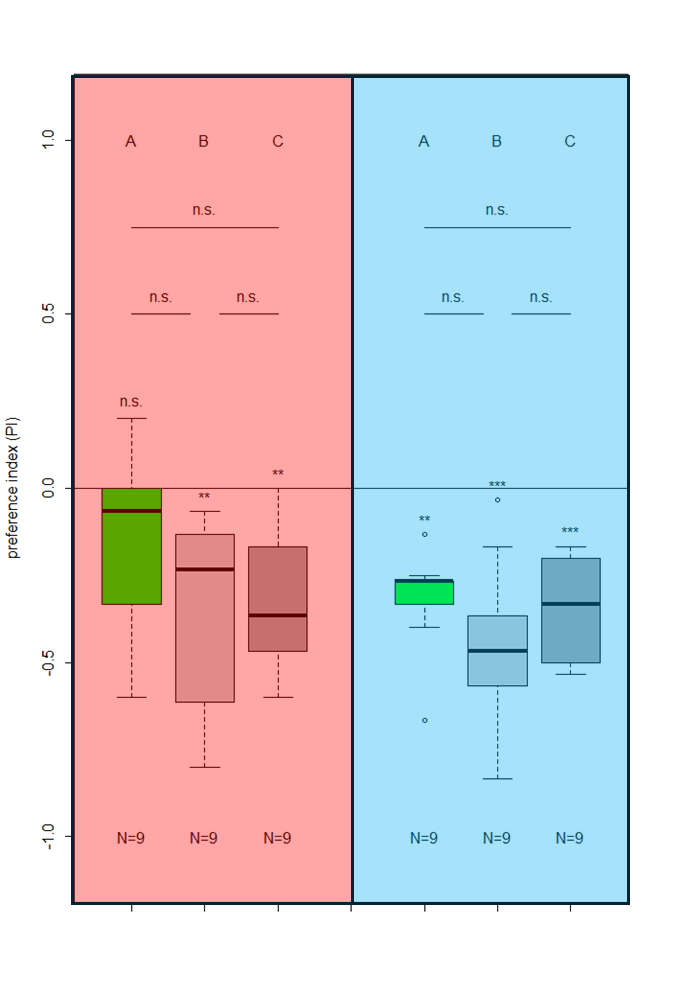
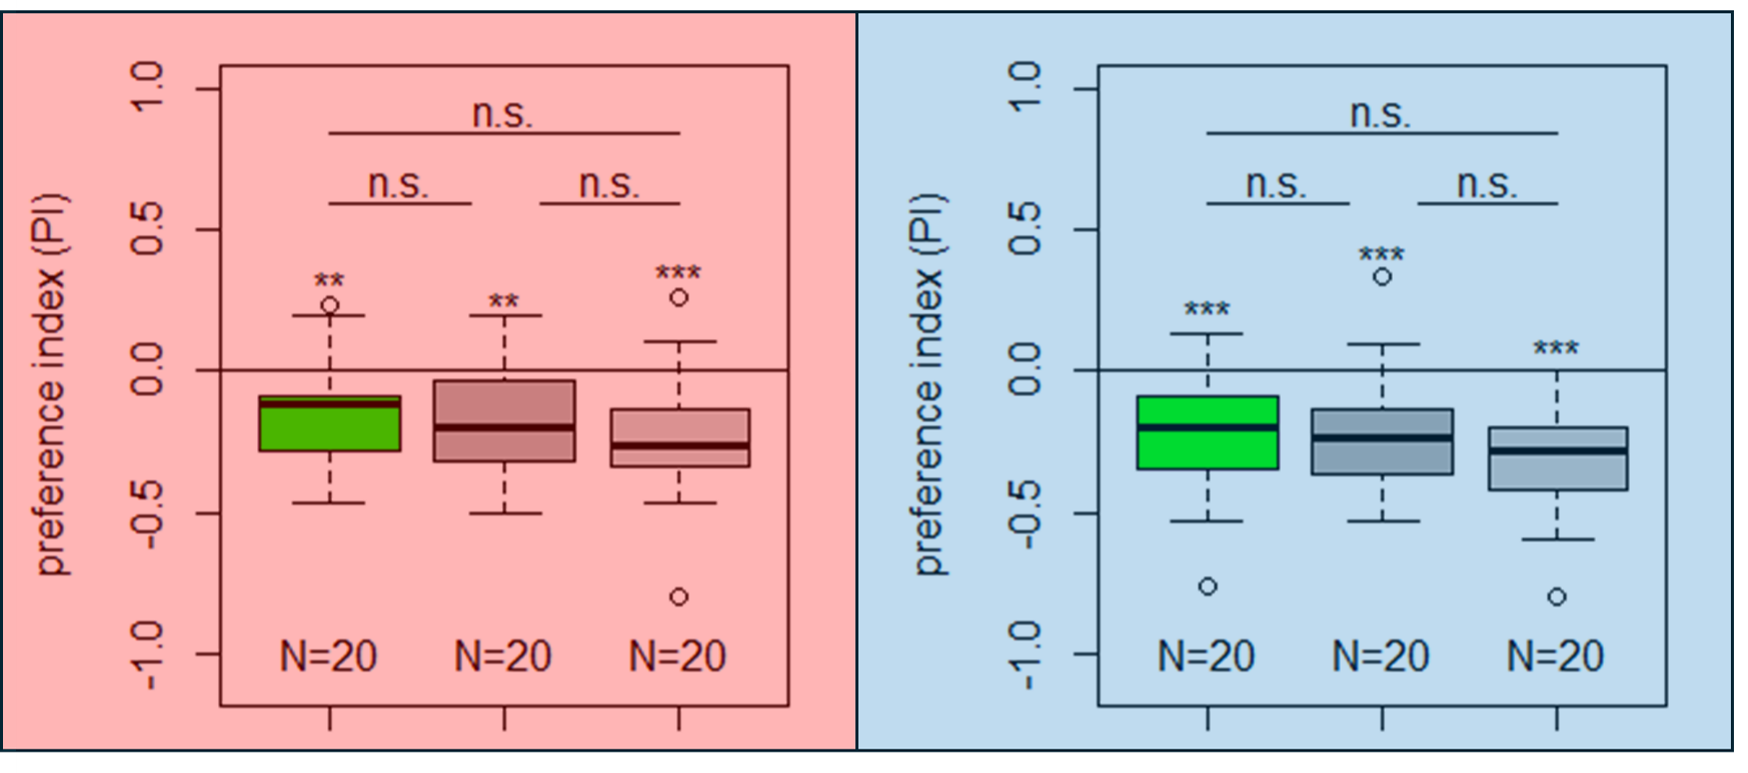
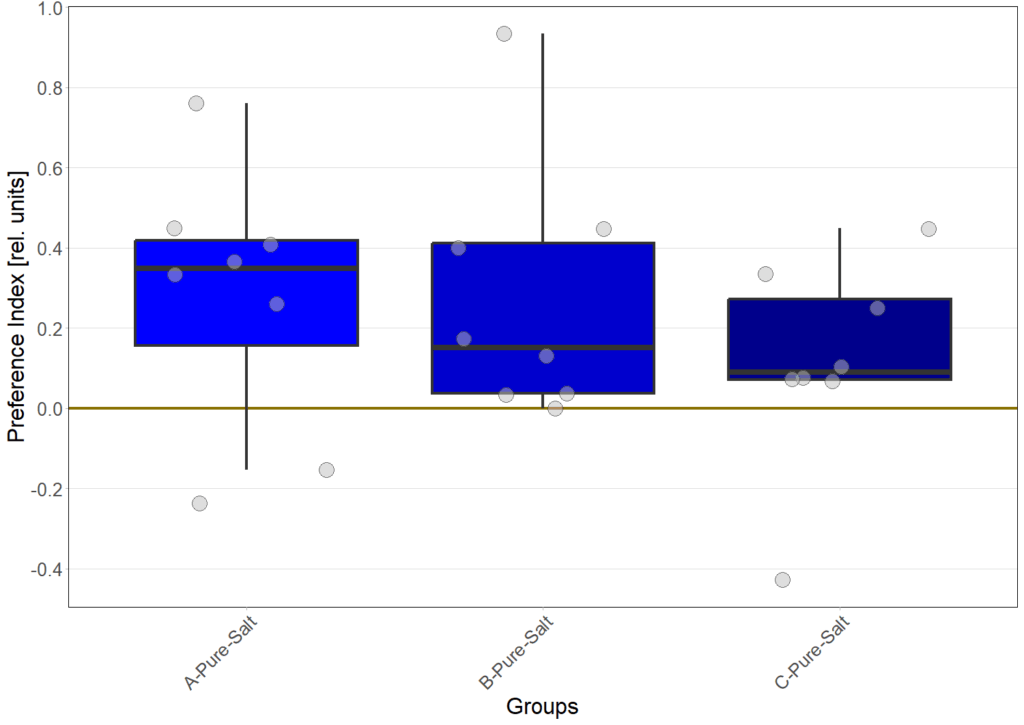
Salt avoidance under red and bluelight Final results (ChR2-XXL x MB328B)
on Sunday, July 13th, 2025 10:39 | by Eva Schächtl

Redlight
C= Experiment Group
N=20

bluelight
C= Experiment Group
N=20
Category: Food preference, genetics, Larve, Mushroom Body, neuronal activation, Optogenetics | No Comments
Salt avoidance under blue and redlight
on Sunday, July 6th, 2025 11:30 | by Eva Schächtl

N= 16
bluelight

N=16
bluelight
Category: genetics, Larve, neuronal activation, Optogenetics | No Comments
Salt avoidance under blue and redlight
on Sunday, June 29th, 2025 10:10 | by Eva Schächtl
N=12
N=8
Category: genetics, Larve, neuronal activation, Optogenetics | No Comments
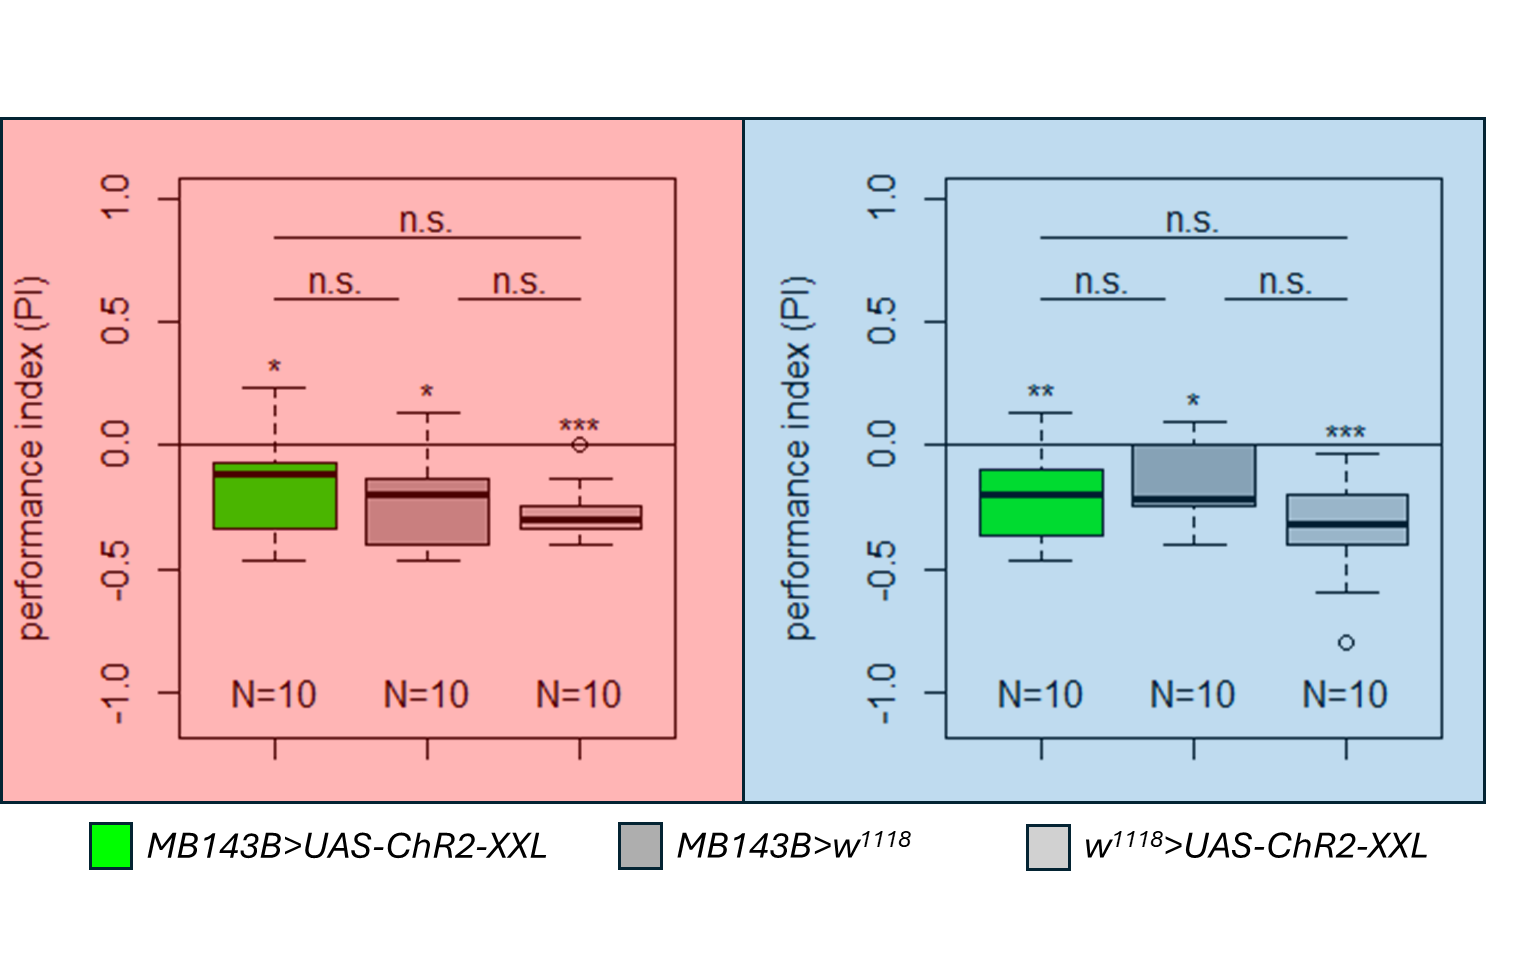
Gustatory preference final results (ChR2-XXL x MB143B)
on Sunday, June 22nd, 2025 10:55 | by Eva Schächtl
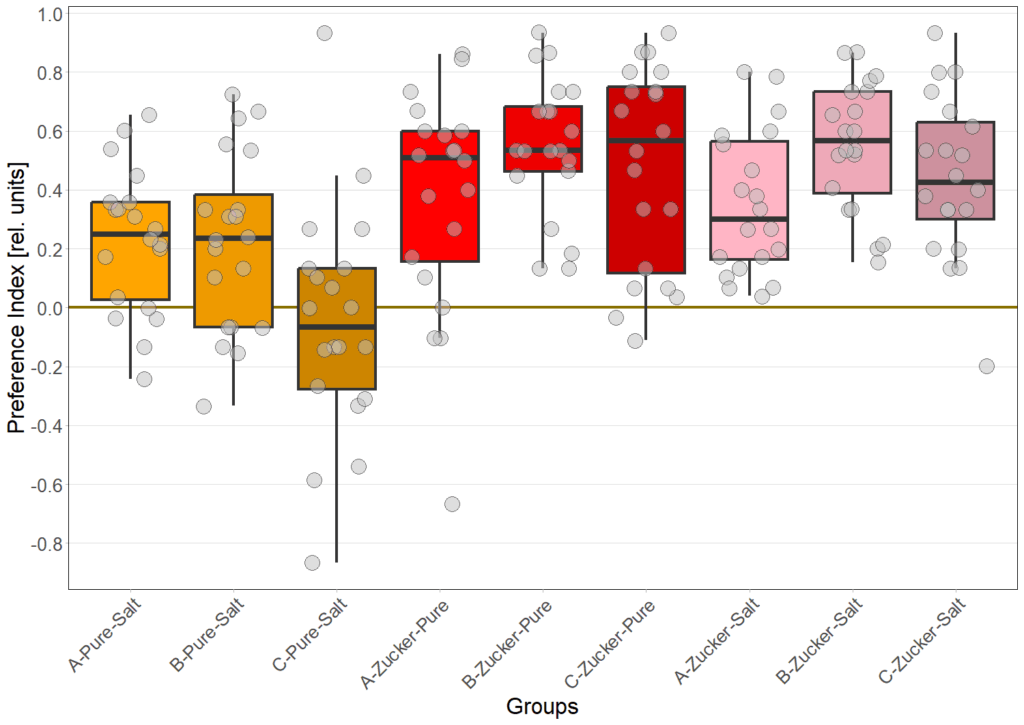
Redlight
N=20
Experiment group = A
bluelight
N=20
Experiment group = A
Category: Food preference, Larve, neuronal activation, Optogenetics | No Comments
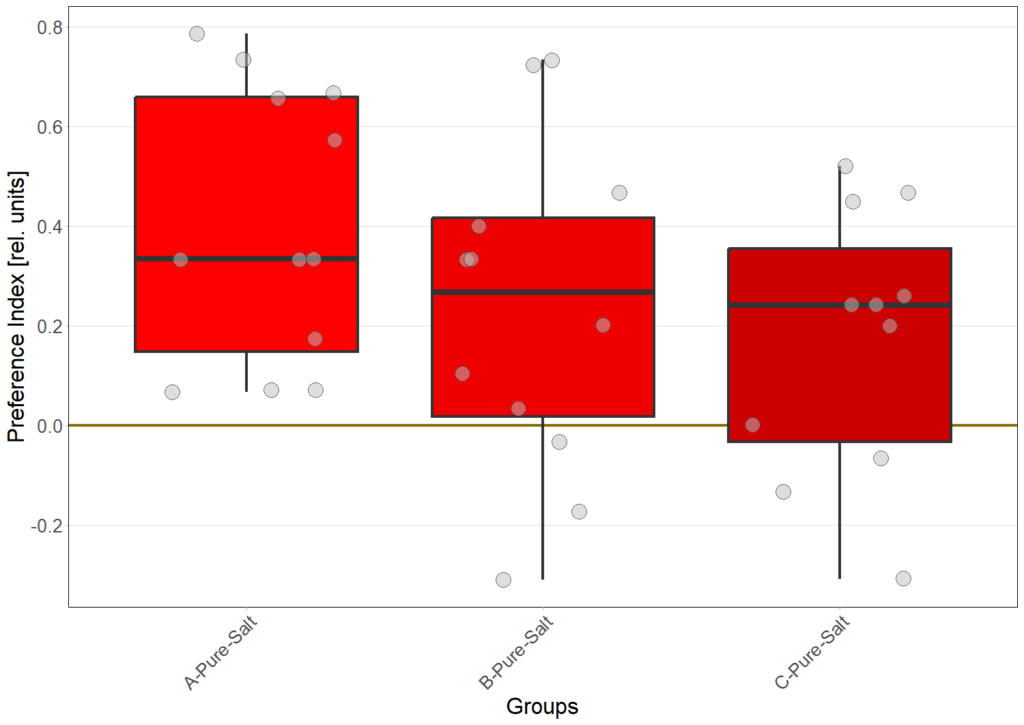
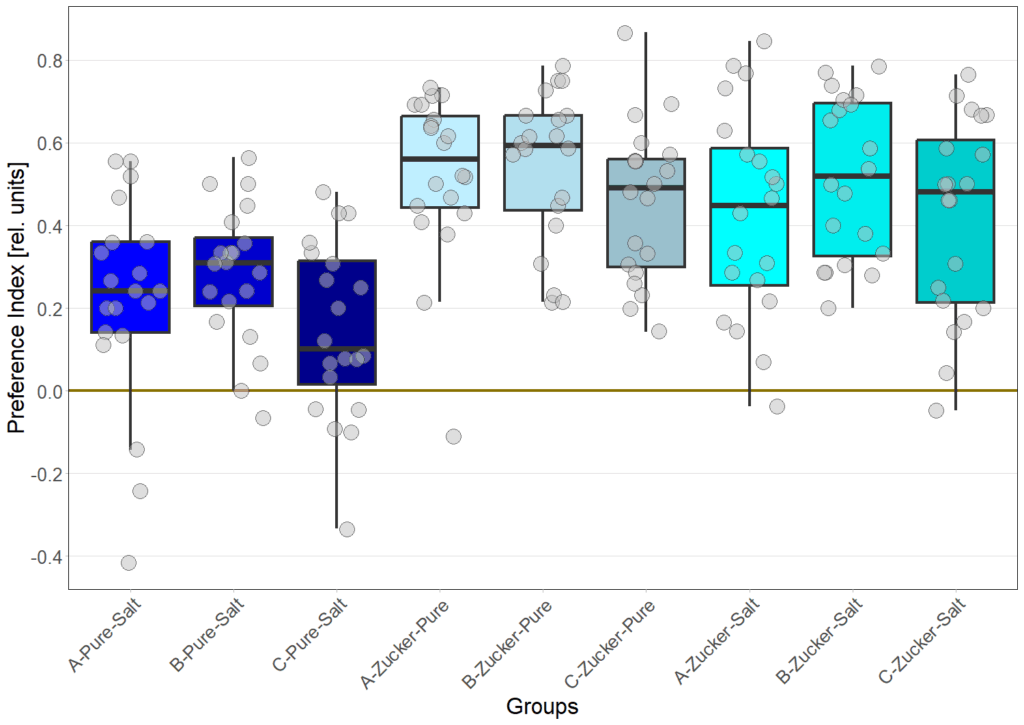
Gustatory preference results
on Monday, June 2nd, 2025 2:03 | by Eva Schächtl

Gustatory preference under redlight

Gustatory preference under bluelight
Category: Food preference, genetics, Larve, neuronal activation, Optogenetics, Uncategorized | No Comments
Gustatory preference results
on Monday, May 26th, 2025 12:29 | by Eva Schächtl
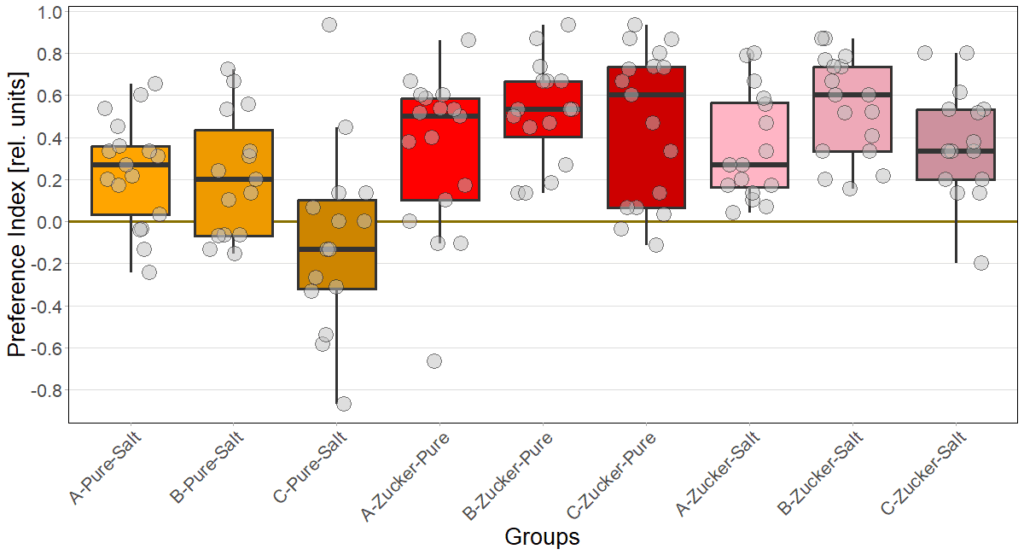
Gustatory preference under redlight
Category: Food preference, genetics, Lab, Larve, neuronal activation, Optogenetics | No Comments