Optomotor graph coded
on Wednesday, February 21st, 2024 10:15 | by Björn Brembs
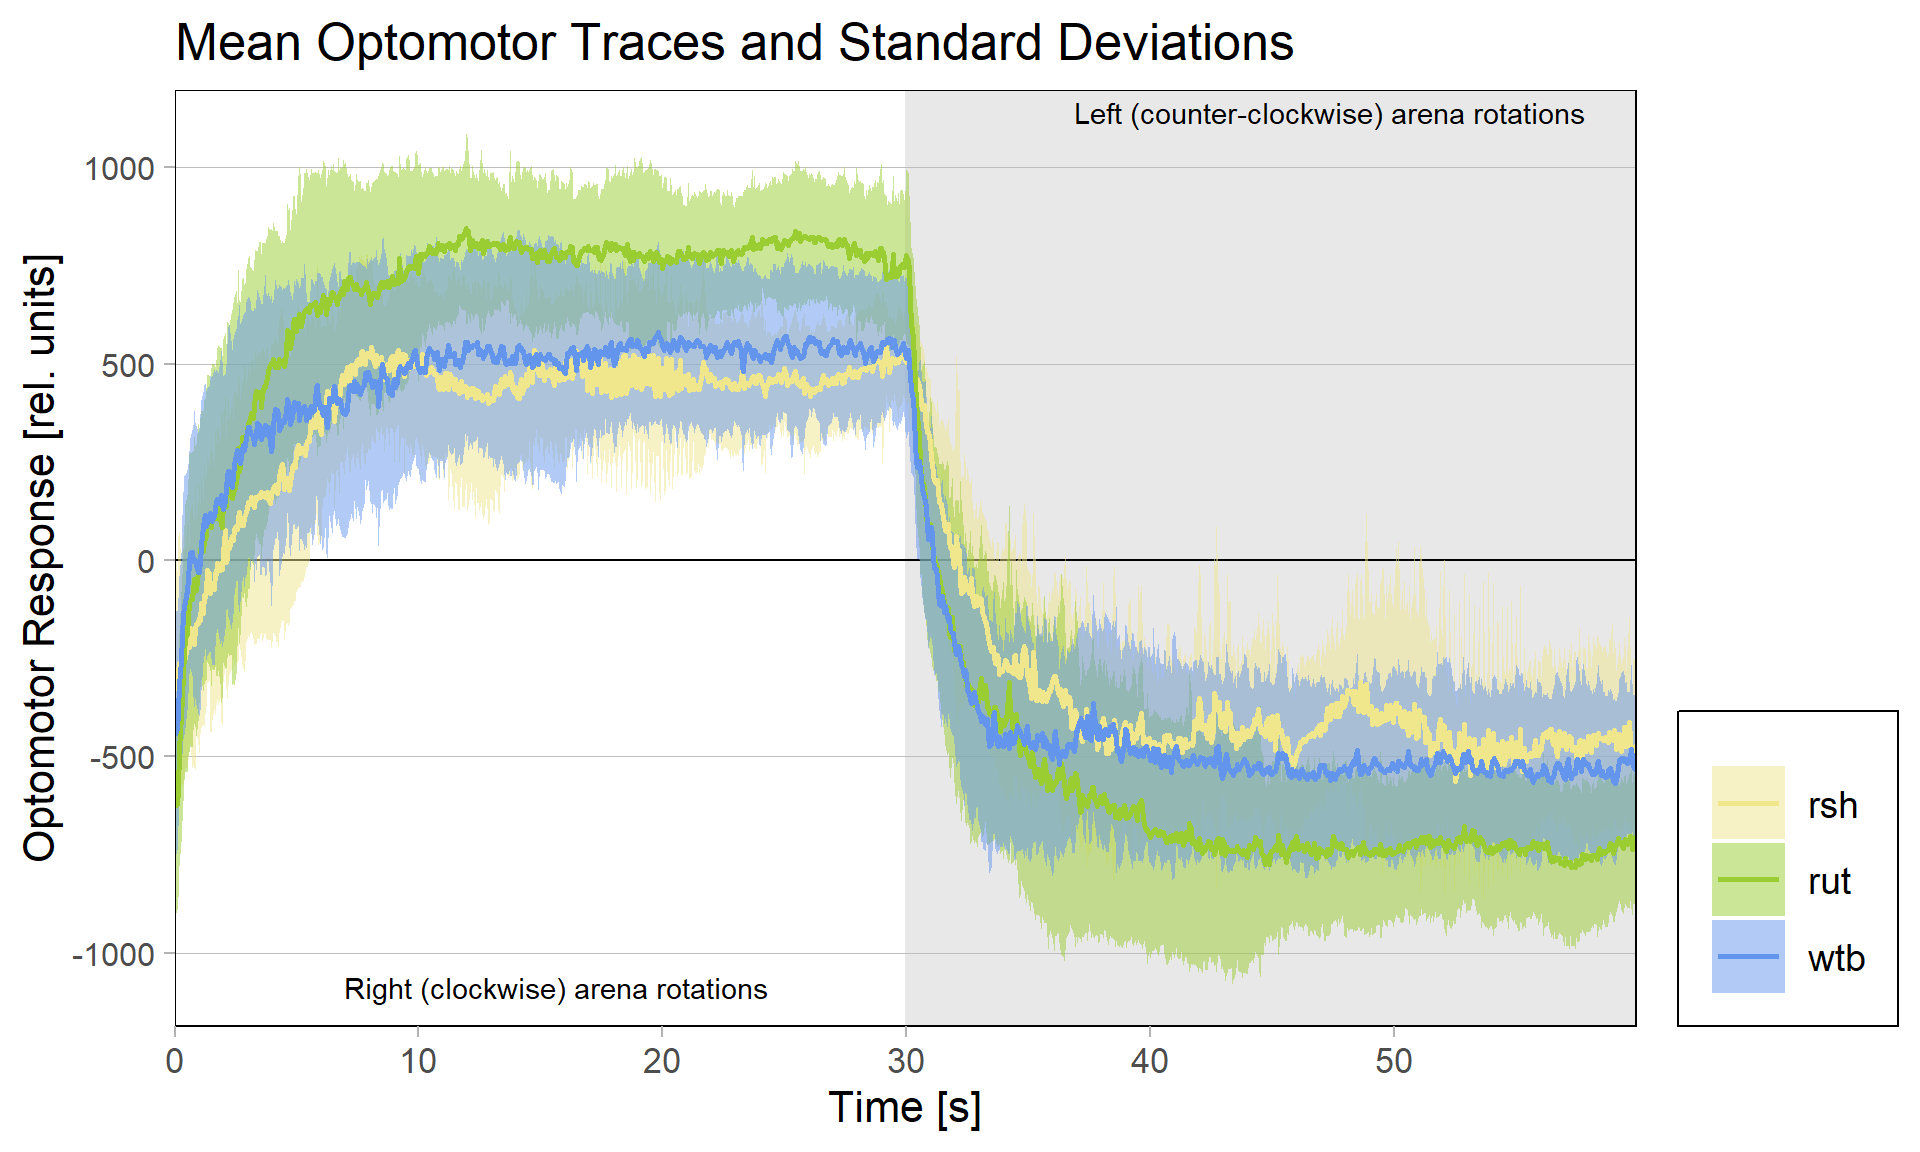
There had been some concerns about the optomotor display in the group evaluation sheets showing right-turning torque on the left side of the graph and vice versa. Also, the use of standard deviations seemed to blur differences between the experimental groups:
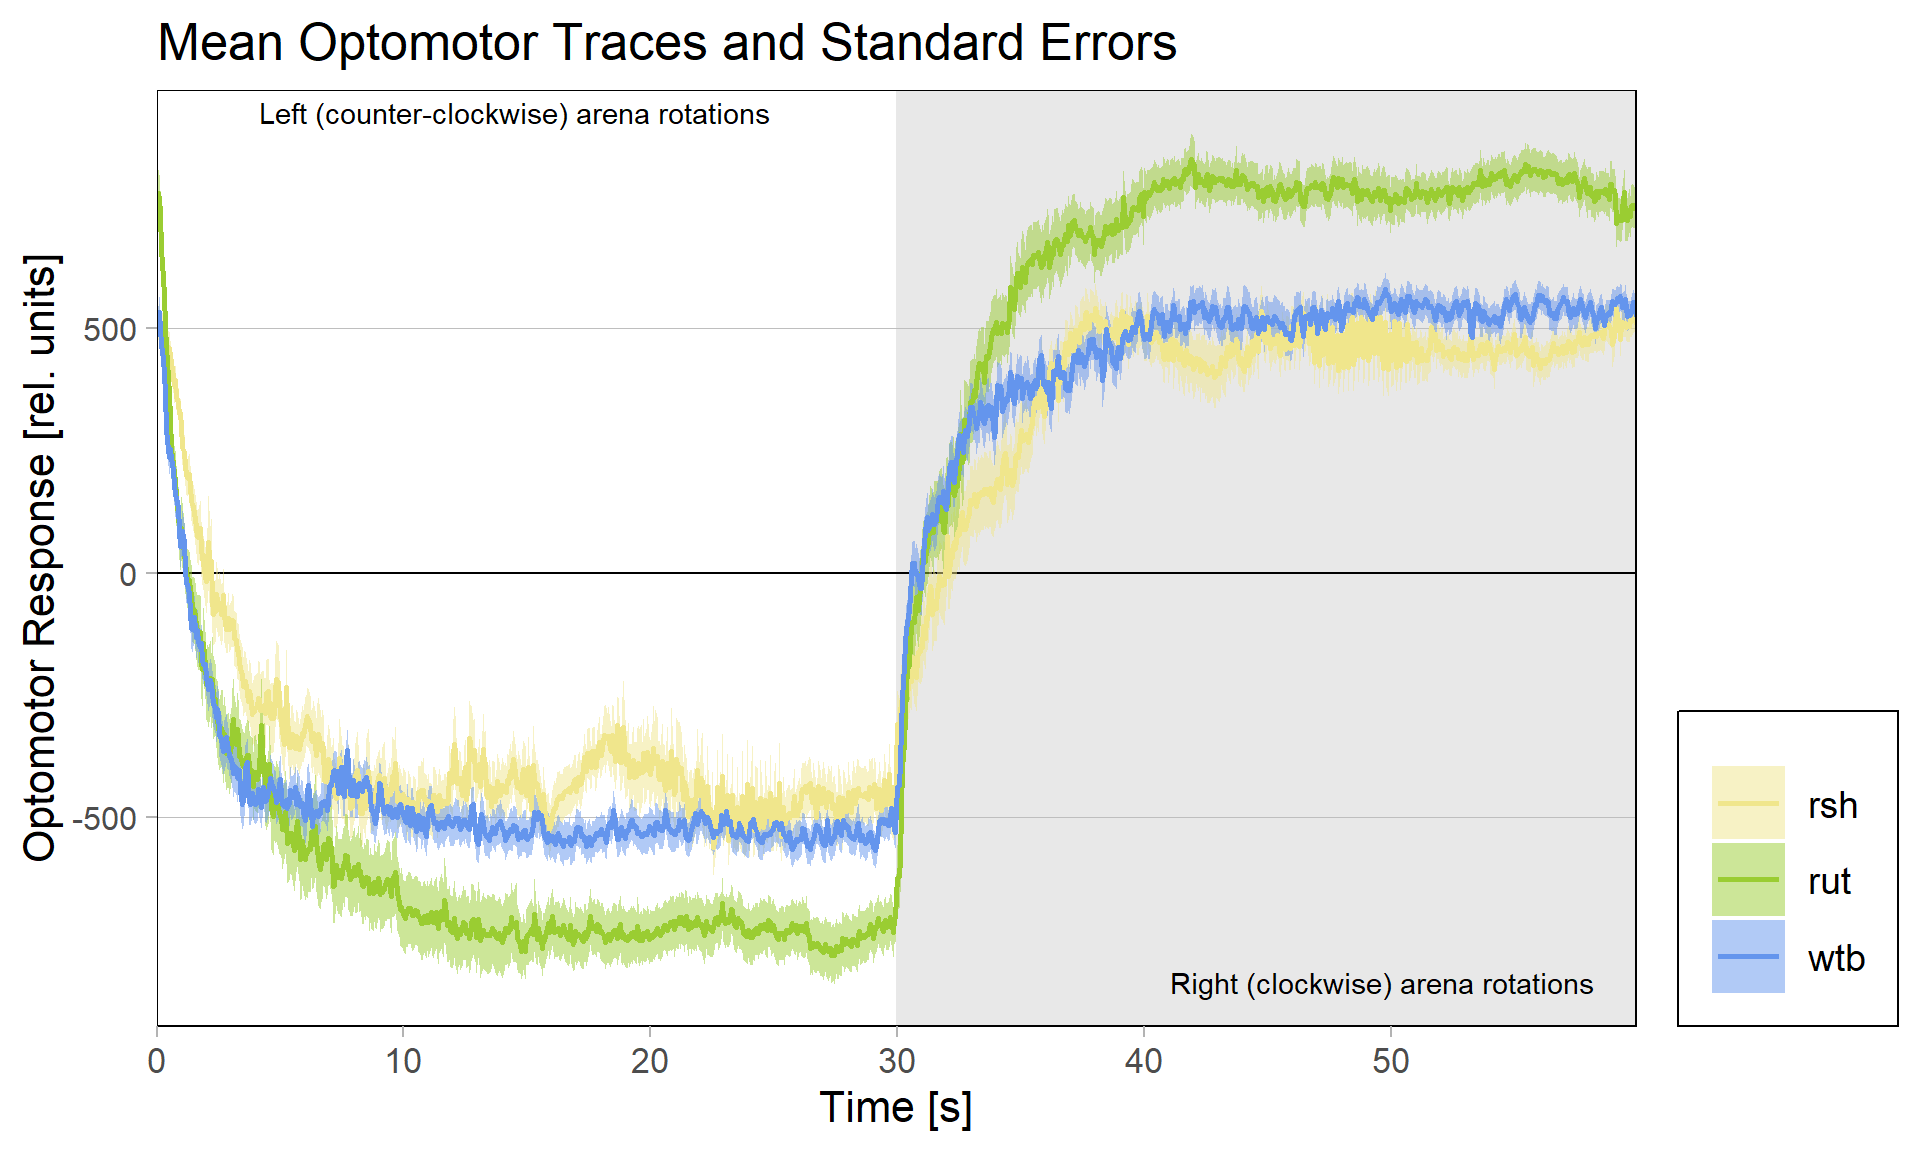
Because of these concerns, I have swapped the traces and used standard error of the means instead of standard deviations:
What do you think? Better or worse? Feedback very welcome!

Category: Optomotor response, R code
Leave a Reply