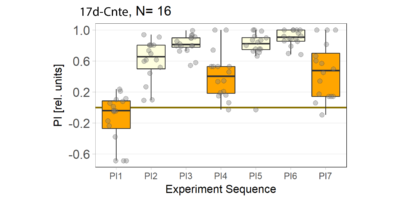
17d flight simulator
on Monday, October 1st, 2018 2:58 | by Anders Eriksson

Category: crosses, flight, genetics, Memory, Operant learning, operant self-learning | No Comments
Joystick Update
on Monday, July 30th, 2018 2:08 | by Amanda Torres
Category: Lab, Operant learning, Operant reinforcment, operant self-learning, Optogenetics | No Comments
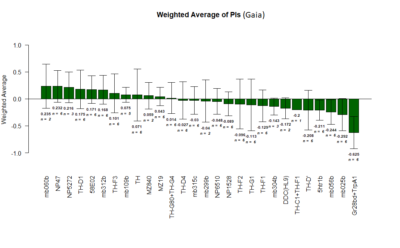
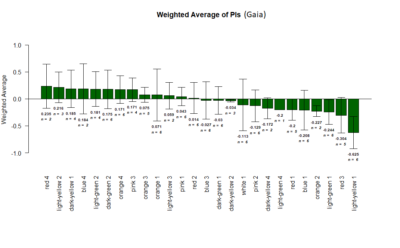
Role of dopaminergic neurons in operant behaviour
on Friday, July 27th, 2018 3:54 | by Gaia Bianchini
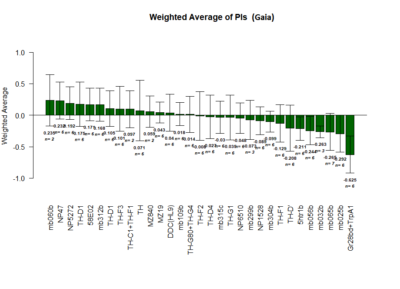
Positive Control: Gr28bd-G4, TrpA1-G4
Parameters: Light: intensity (500 Lux side, 1000 Lux bottom); frequency = 20Hz; Delay = 1 ms; Duration = 9.9 ms; volts = 6.4
Red lines: completed
mb025b: not selected against tubby
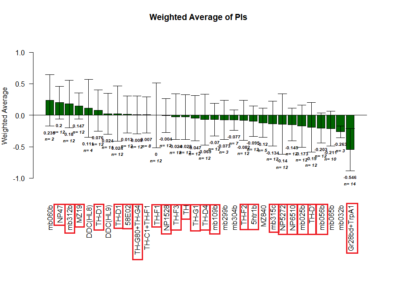
reinforcement scores
on Monday, July 23rd, 2018 2:21 | by Saurabh Bedi
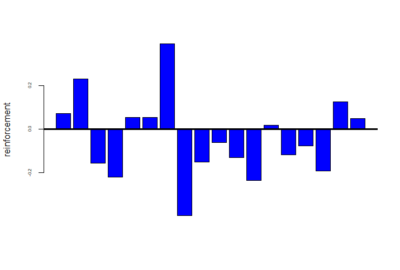
Below is given the plot of effect-sizes of reinforcement of 30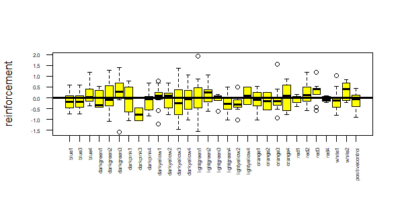 genotypes. On the y-axis are the PI values for learning effect sizes. These scores are calculated by taking the average of PI values of training periods and then subtracting pretest PI values from it.
Reinforcement scores = mean of training score – pretest PI score
Category: Operant learning, Optogenetics, Uncategorized | No Comments
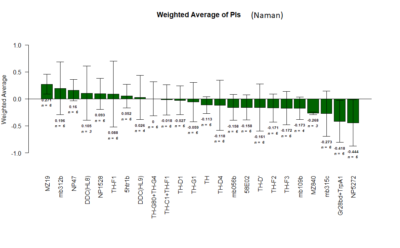
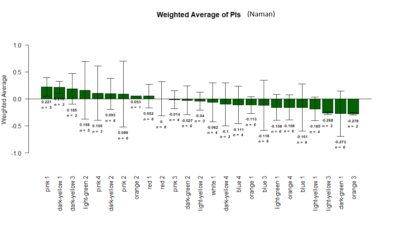
The Tmaze Experiments : Screen results as on 22-7-18
on Sunday, July 22nd, 2018 6:41 | by Naman Agrawal
Yellow 1 (Positive Control): Gr28bd-G4, TrpA1-G4
Parameters: Light: intensity (500 Lux side, 1000 Lux bottom); frequency = 20Hz; Delay = 1 ms; Duration = 9.9 ms; volts = 6.4
Category: neuronal activation, open science, Operant learning, Optogenetics | No Comments
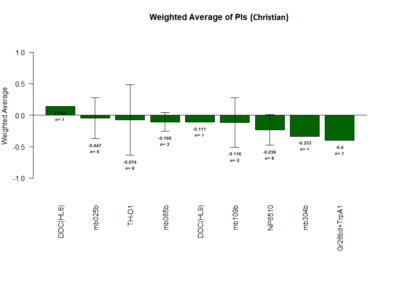
Finding the interesting lines
on Friday, July 20th, 2018 3:46 | by Christian Rohrsen
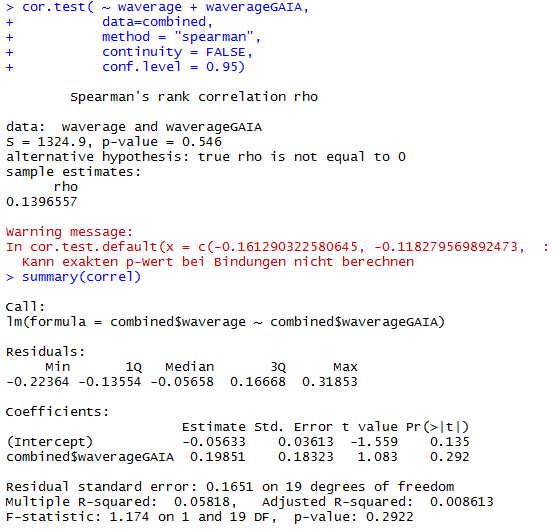
This is the correlation from the T-maze experiments from Gaia and Naman. Neither ranked nor regular correlation show any significant effect. This means that these effects seem to be random, at least for most of them, is this an overfitting result?
I would say blue 1 is a line that was negative for all the tests I have so far seen. So this might be an interesting line. What to do next?
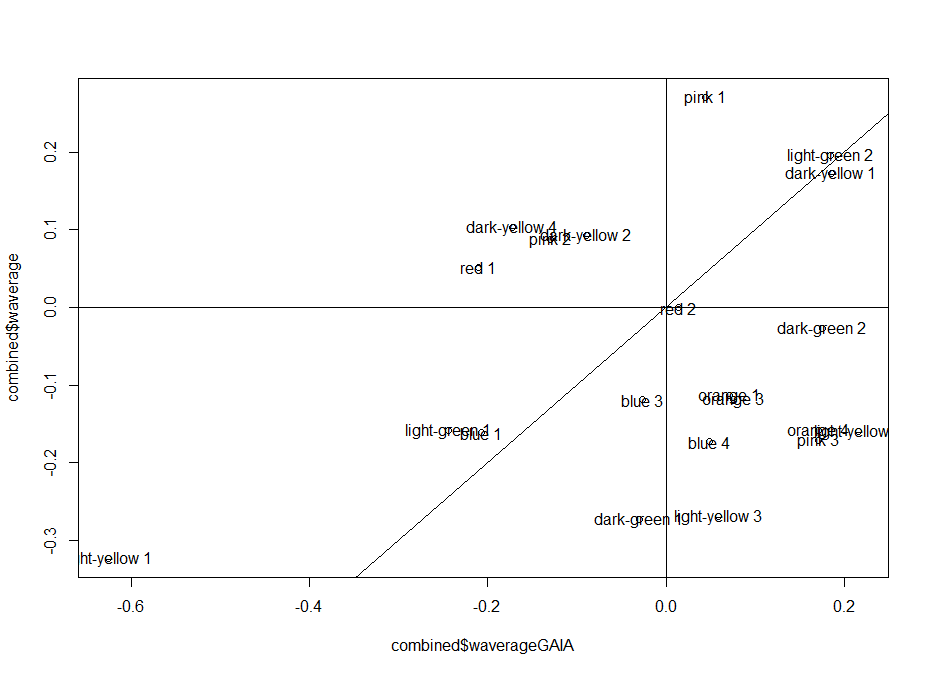
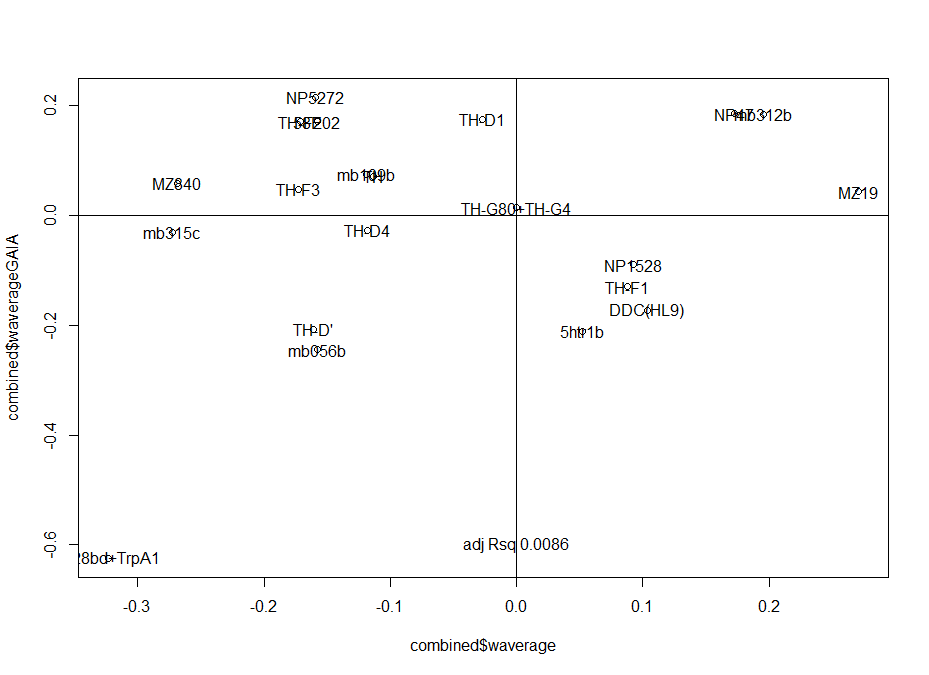
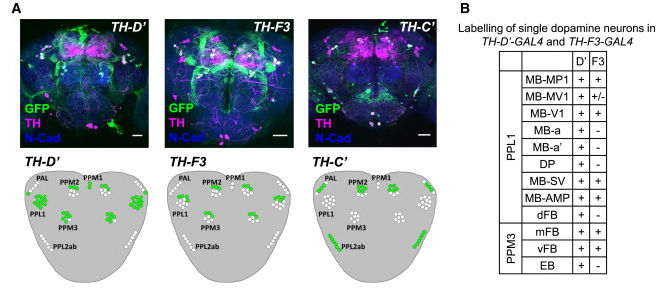
I would unblind the blue1, which is TH-D’. It was shown to be required for classical conditionning in shock and temperature learning (Galili et al. 2014). Another interesting observation is that th-g4+th-g80 seems to have like zero PI scores in all of the experiments (Naman and Gaia in the Tmaze, Joystick and Y-mazes). So could it be that all of these neurons have indeed a meaning, but is depending every time in the context?? Maybe Vanessa Ruta´s work might be interesting for that.
wiggle difference
on Monday, July 16th, 2018 3:26 | by Saurabh Bedi
Below is a plot of all the flies of 18 genotypes for the wiggle difference. This is calculated by taking the sum of the difference of the tracepoint for each step. Thus, wiggle = sum(difference in tracepoint at each step). This is done for the entire 20 minutes time.
NOTE: The flies have not yet been separated into 2 categories based on pretest values.
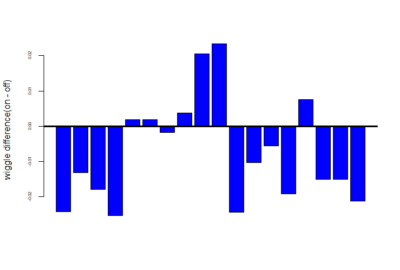
Now we wanted to measure the difference in on wiggle and off wiggle. On wiggle is the wiggle for when the fly was in the part which is supposed to have light on and similarly off wiggle is the wiggle when light is supposed to be off(that is in the portion in which we want to train it to be in). So below is the difference of on wiggle and off wiggle i.e – on wiggle – off wiggle:-
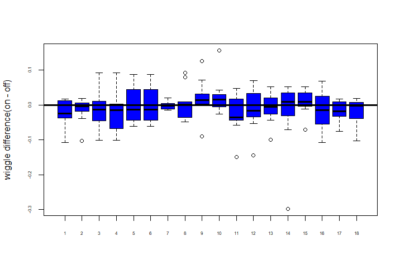
mean of this wiggle difference :-
Category: Operant learning, Optogenetics, Uncategorized | No Comments
reinforcement(without subtracting pretest)
on Monday, July 16th, 2018 3:22 | by Saurabh Bedi
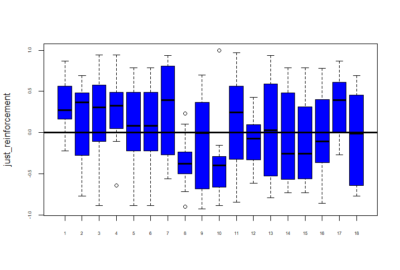
Below is given the plot of effect-sizes of reinforcement of 18 genotypes. On the y-axis are the PI values for learning effect sizes and this is without subtracting the pretest (without normalizing). These scores are calculated by taking the average of PI values of training periods. We are just comparing reinforcement without normalizing with the previous post showing graphs after subtraction of pretest PI’s.
Reinforcement(without normalizing) = mean of training PI values.
Category: Operant learning, Optogenetics, Uncategorized | No Comments
reinforcement(after subtracting pretest)
on Monday, July 16th, 2018 3:18 | by Saurabh Bedi
Below is given the plot of effect-sizes of reinforcement of 18 genotypes. On the y-axis are the PI values for learning effect sizes. These scores are calculated by taking the average of PI values of training periods and then subtracting pretest PI values from it.
Reinforcement scores = mean of training score – pretest PI score
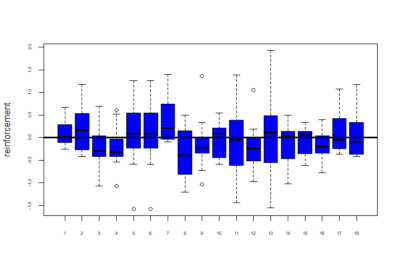
Now below are the mean values of the reinforcements calculated for these 18 genotypes
Category: Operant learning, Optogenetics | No Comments
T-Maze experiments : screen results as on 16-07-2018
on Monday, July 16th, 2018 1:32 | by Gaia Bianchini
Results of the T-maze screen analysis, both individual and combined.
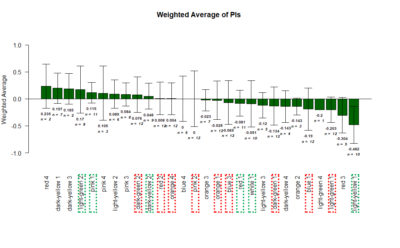
Yellow 1 (Positive Control): Gr28bd-G4, TrpA1-G4
Parameters: Light: intensity (500 Lux side, 1000 Lux bottom); frequency = 20Hz; Delay = 1 ms; Duration = 9.9 ms; volts = 6.4