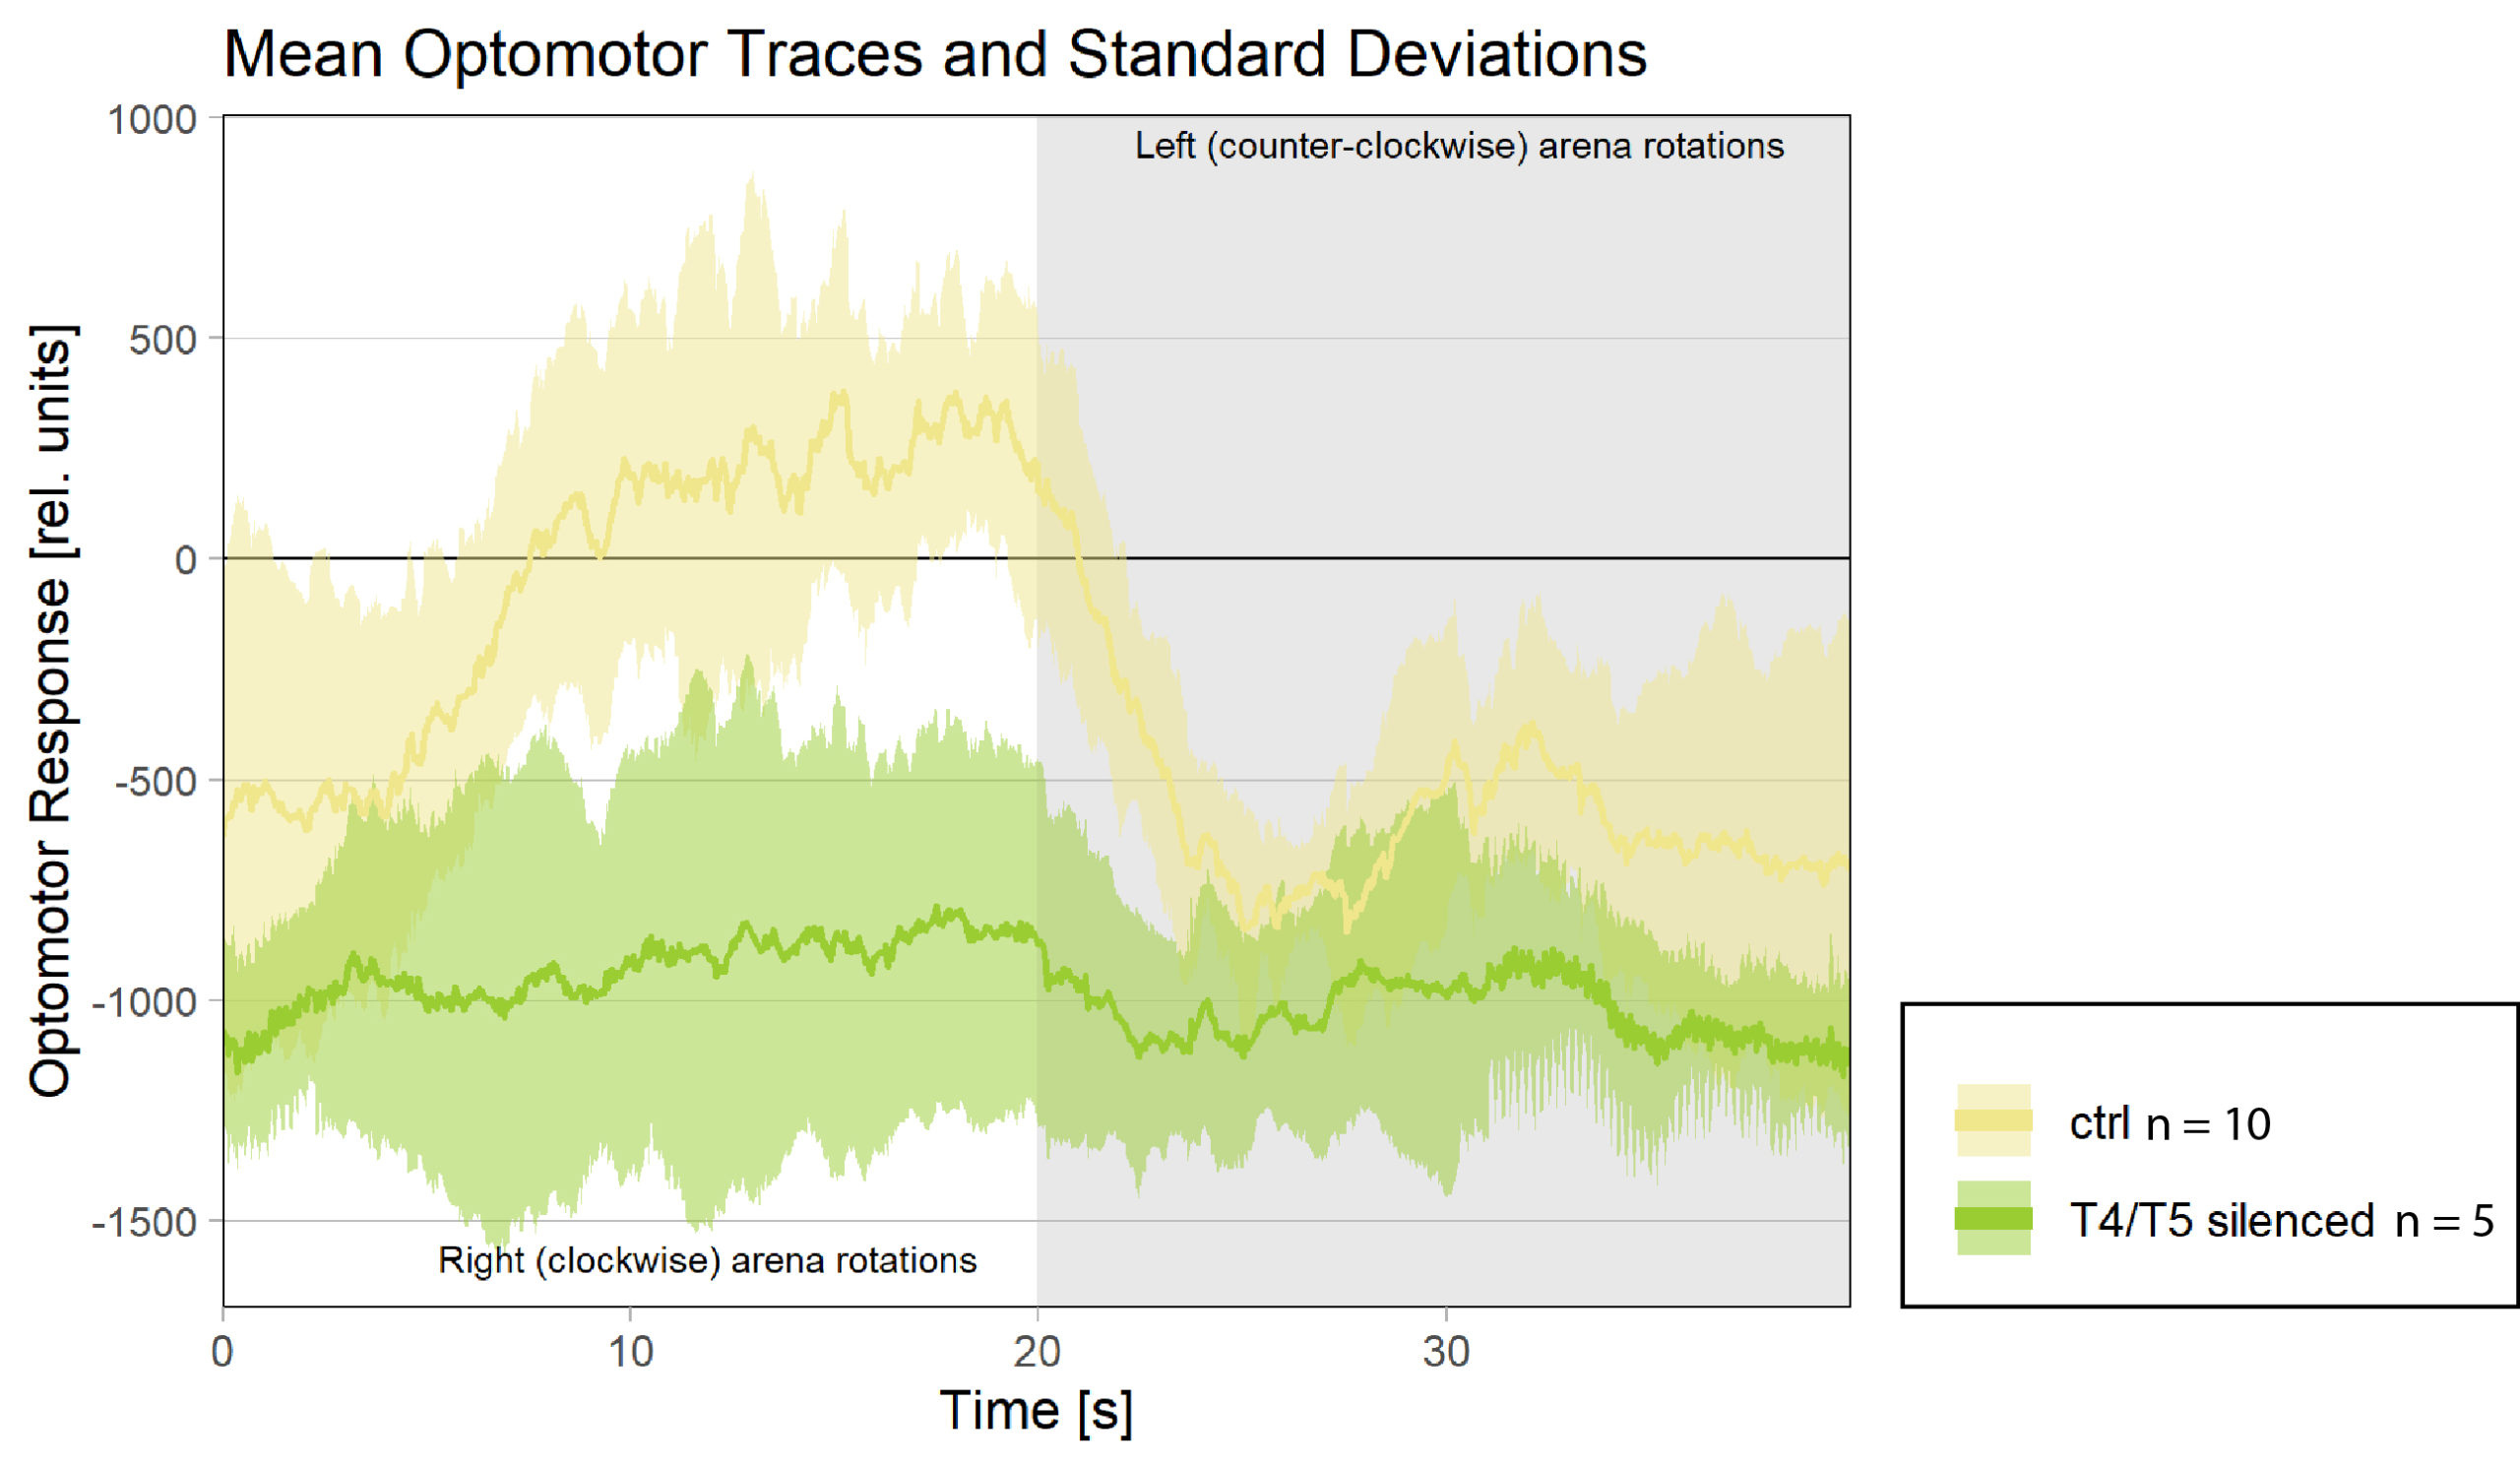
Motion blindness in T4/T5 using Optomotor Response
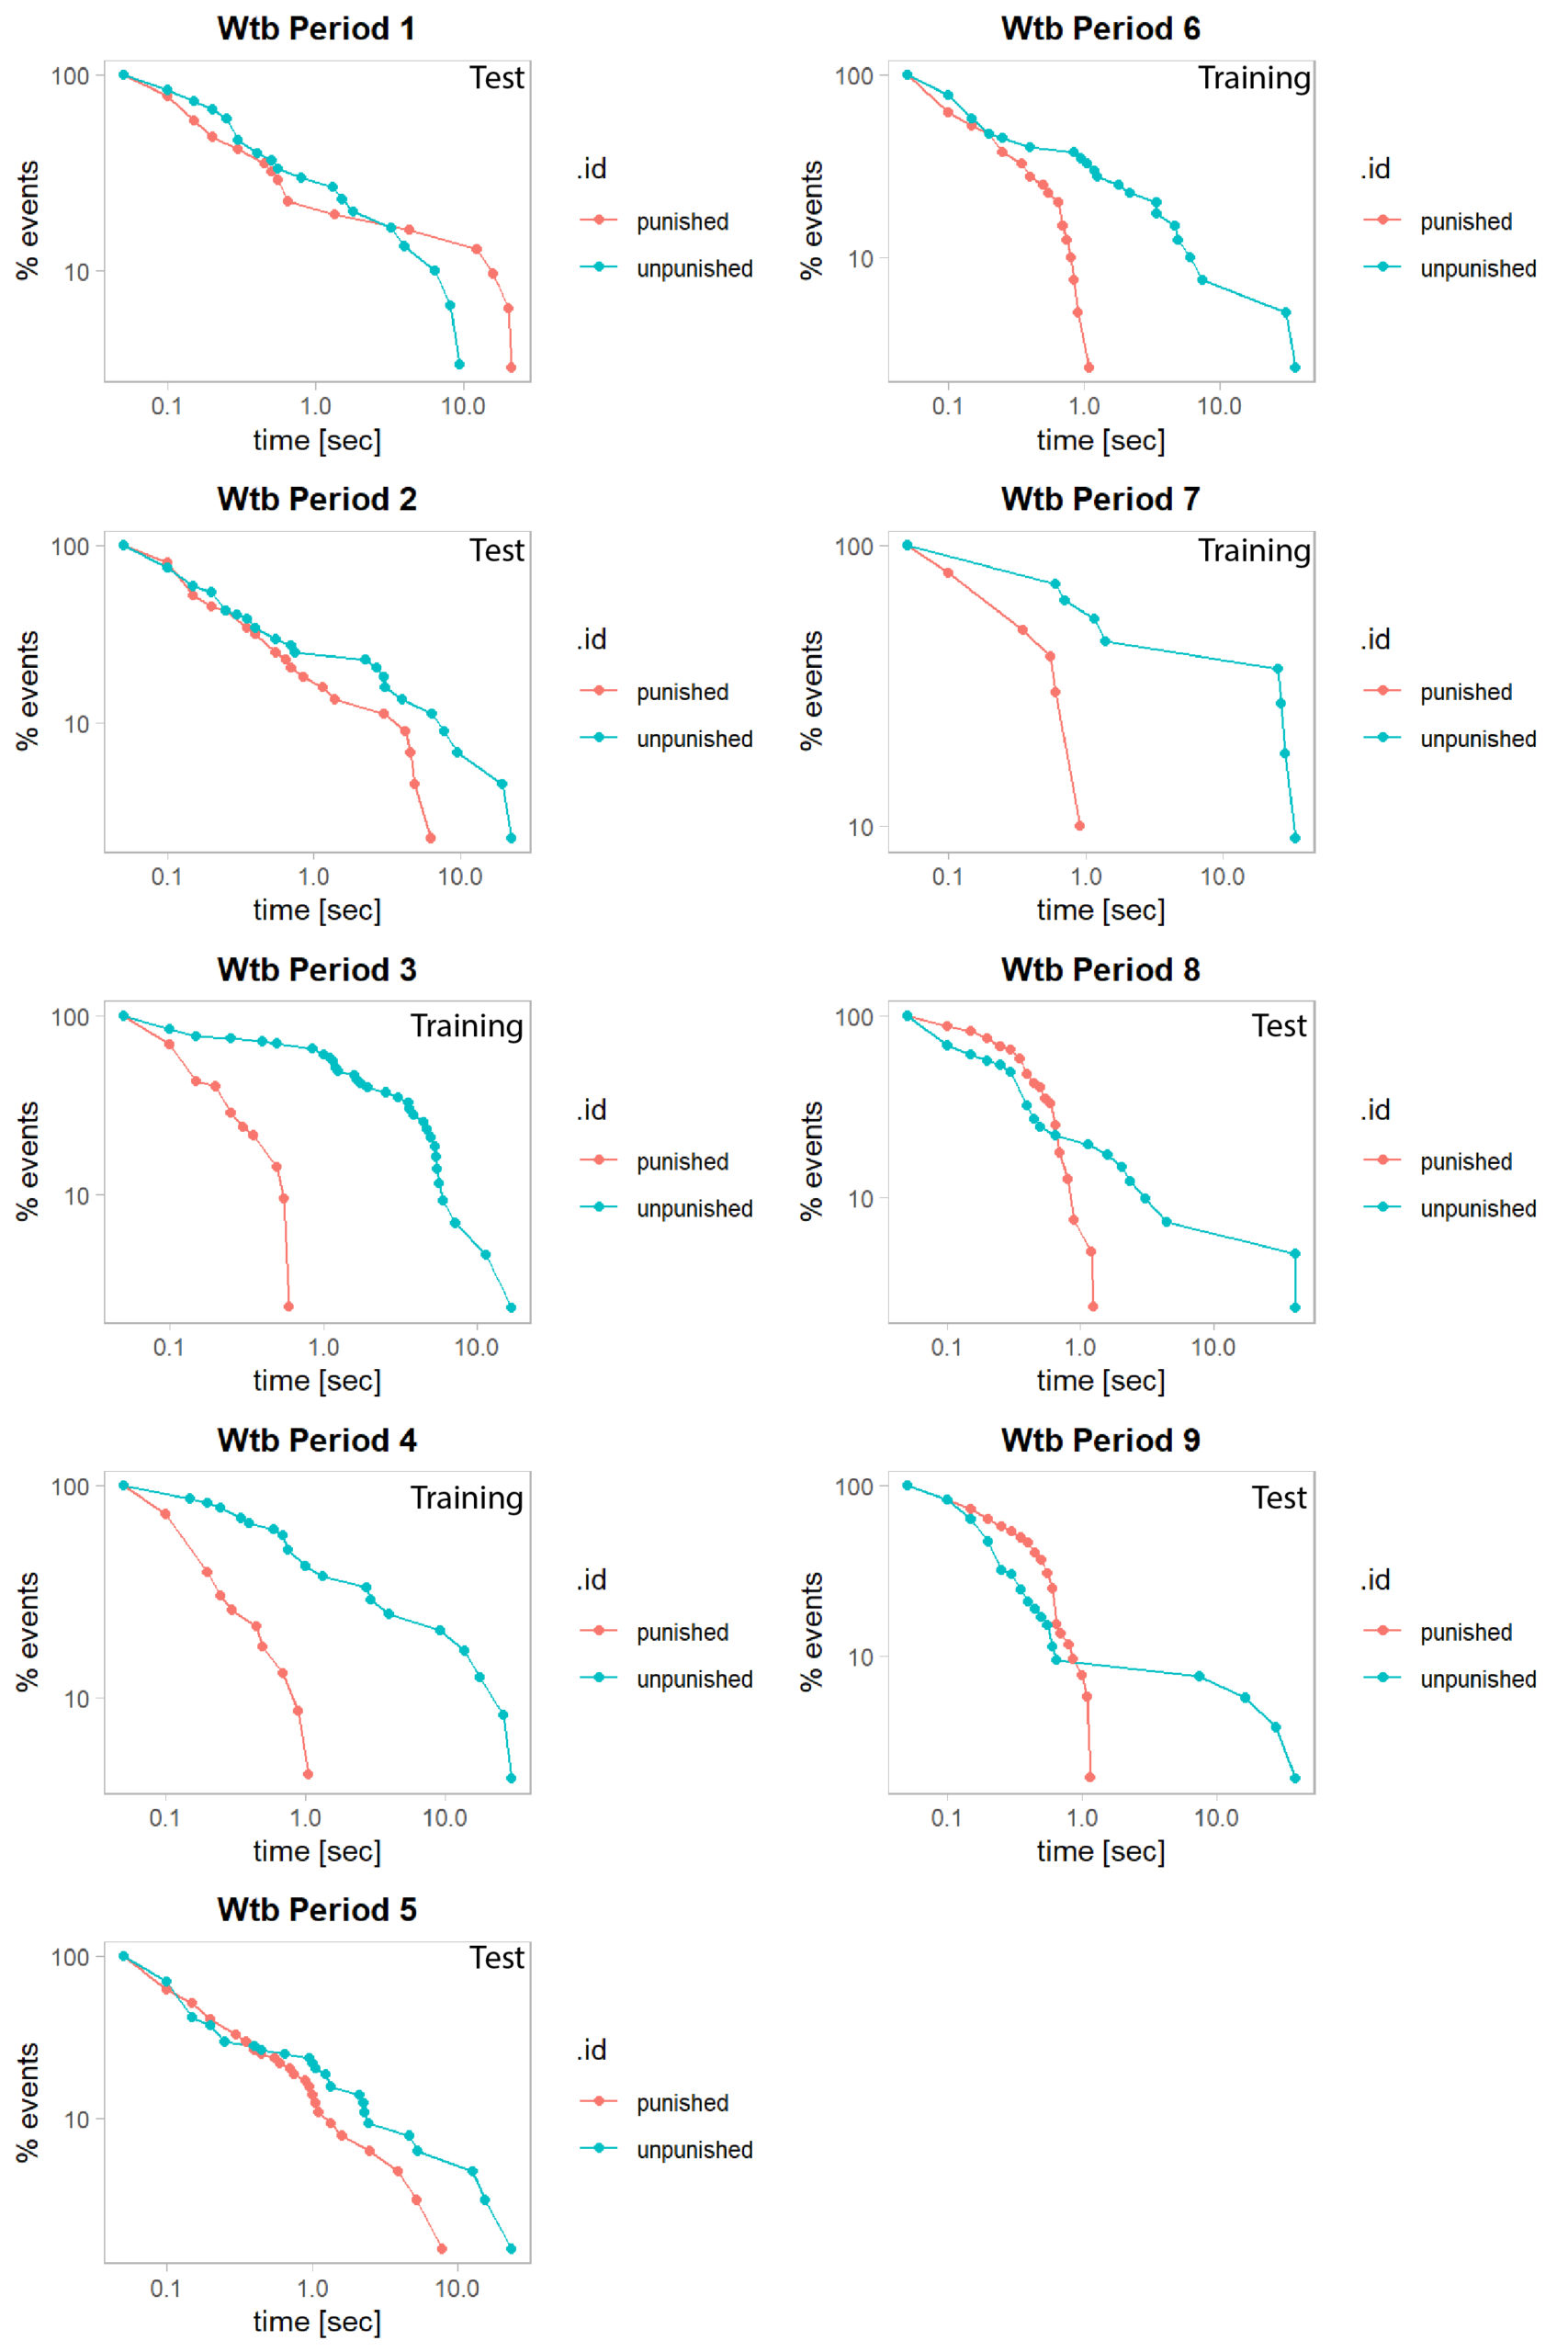
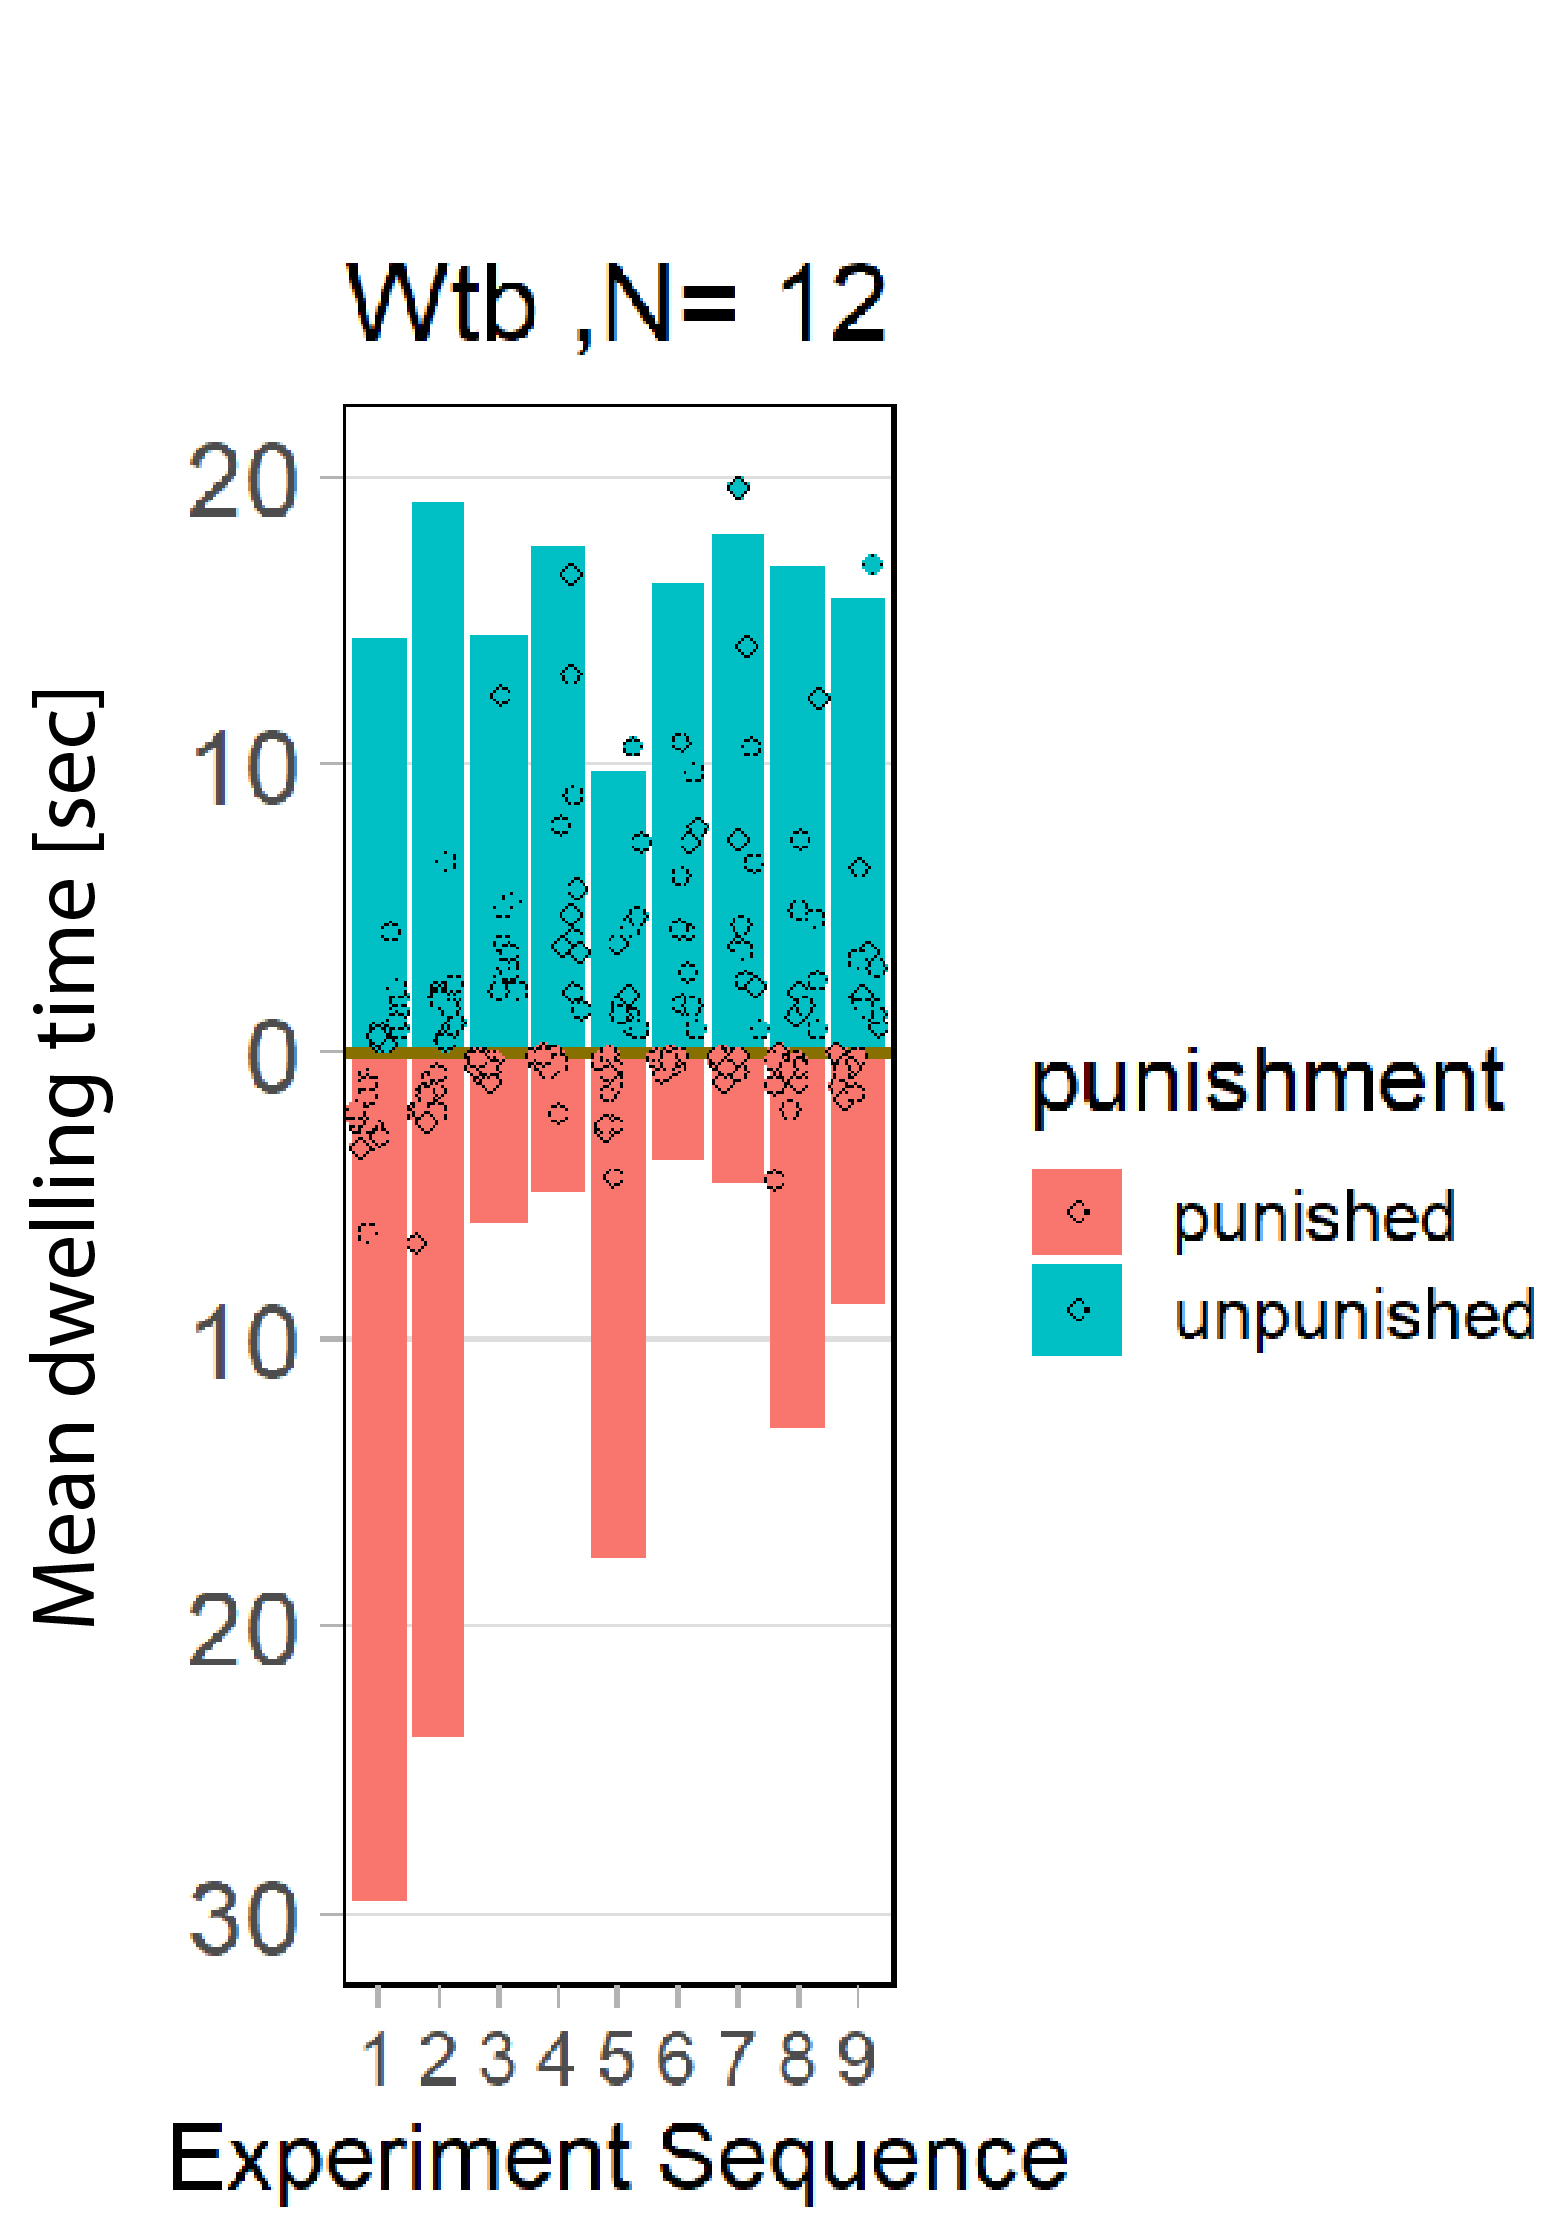
Making sense of dwelling data
Mean or median?
| Unpunished | Punished | |
| 100 | 1 | |
| 1 | 3 | |
| 1,2 | 1 | |
| 0,5 | 2 | |
| 0,3 | 5 | |
| 5 | ||
| Mean | 18 | 2,4 |
| Median | 1,1 | 2 |
A highly hypothetical scenario of how the distribution of dwelling times could be. Even if unrealistic, it still illustrates the problem of using median instead of mean.
Plotting the dwelling times as means
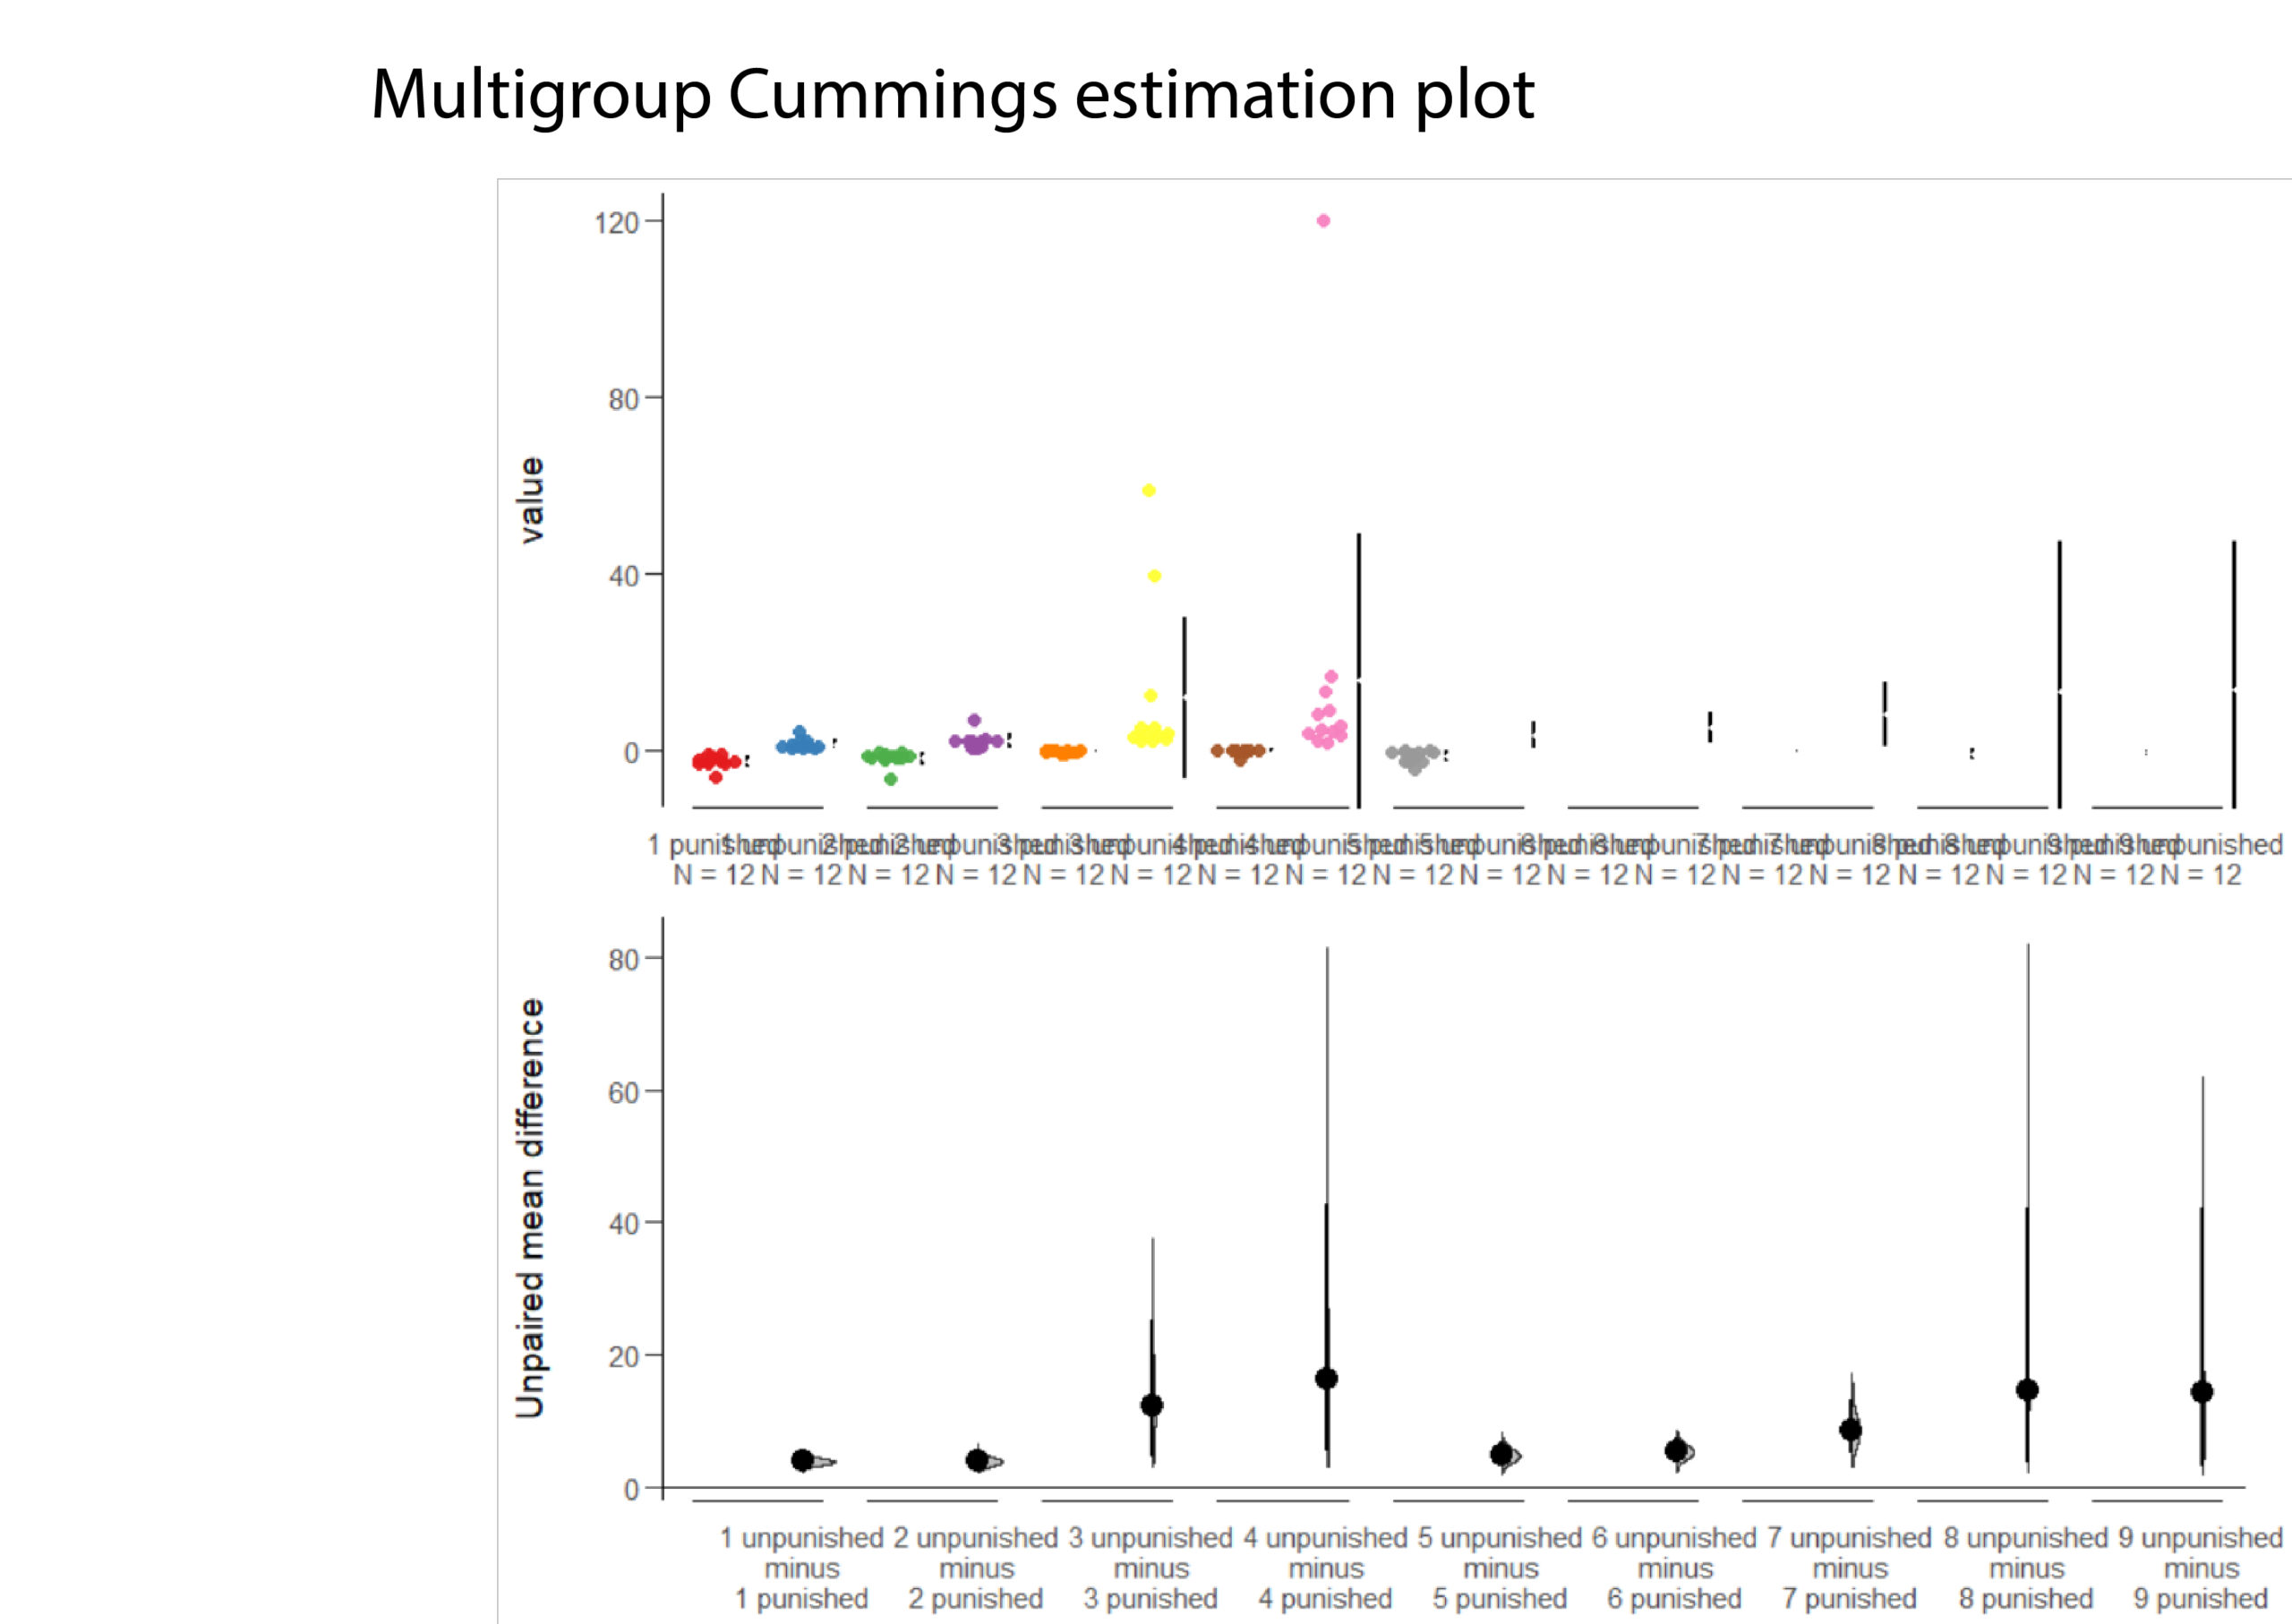
Grouped analysis of dwelling times
Cumming estimation plot
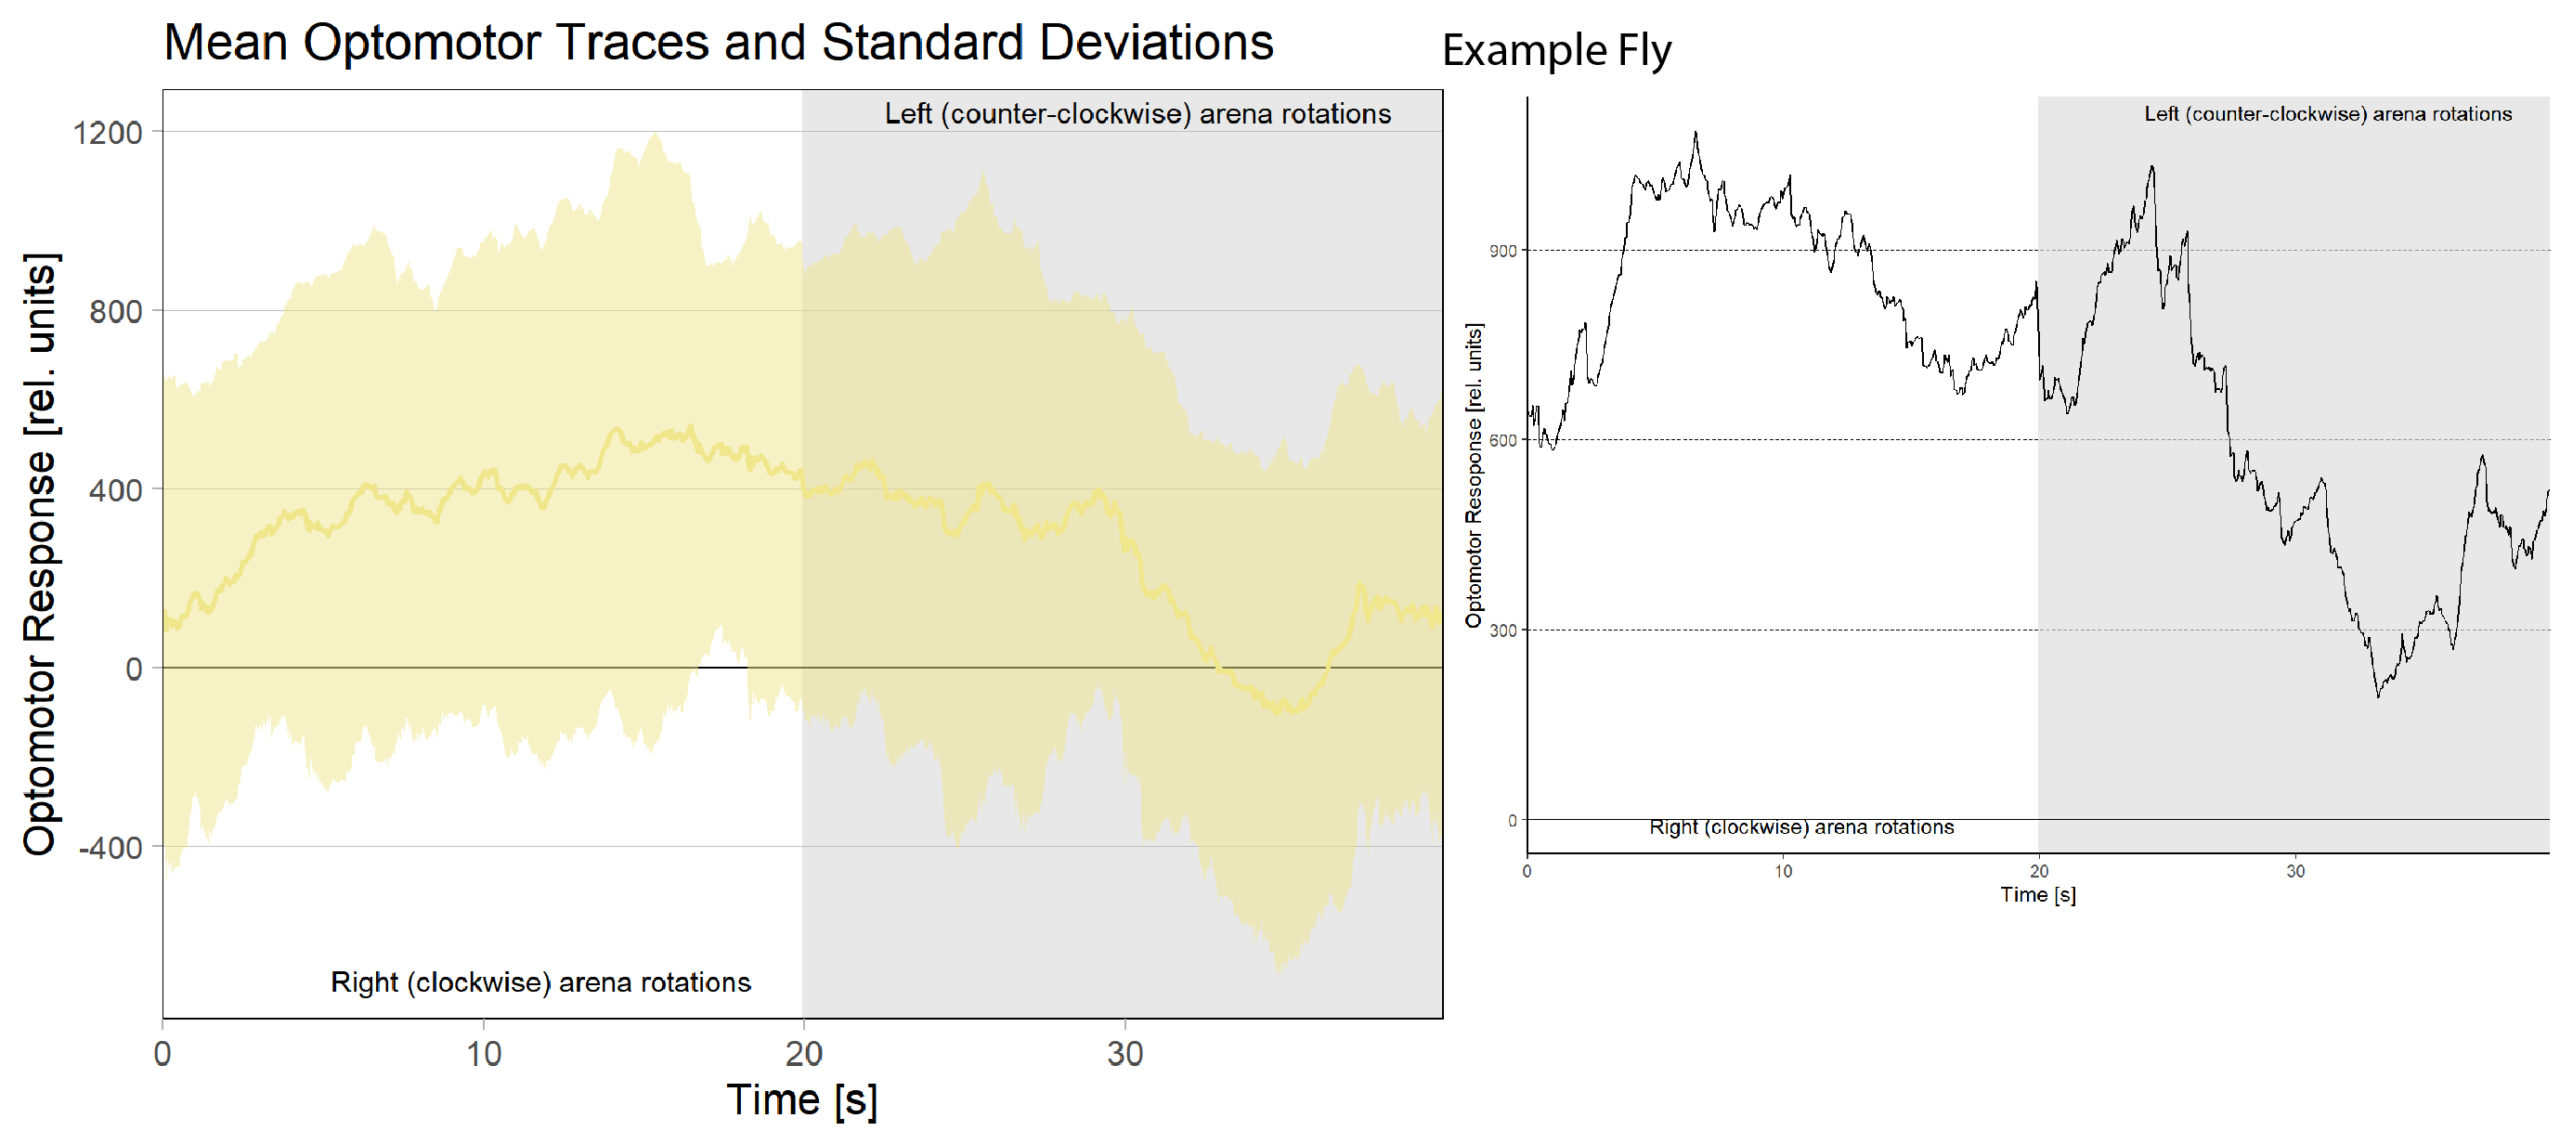
Optomotor response works consistently with old platform
The old platform works a lot more consistently compared to the new one. Unless major improvements are seen I do not see any reason to update it.
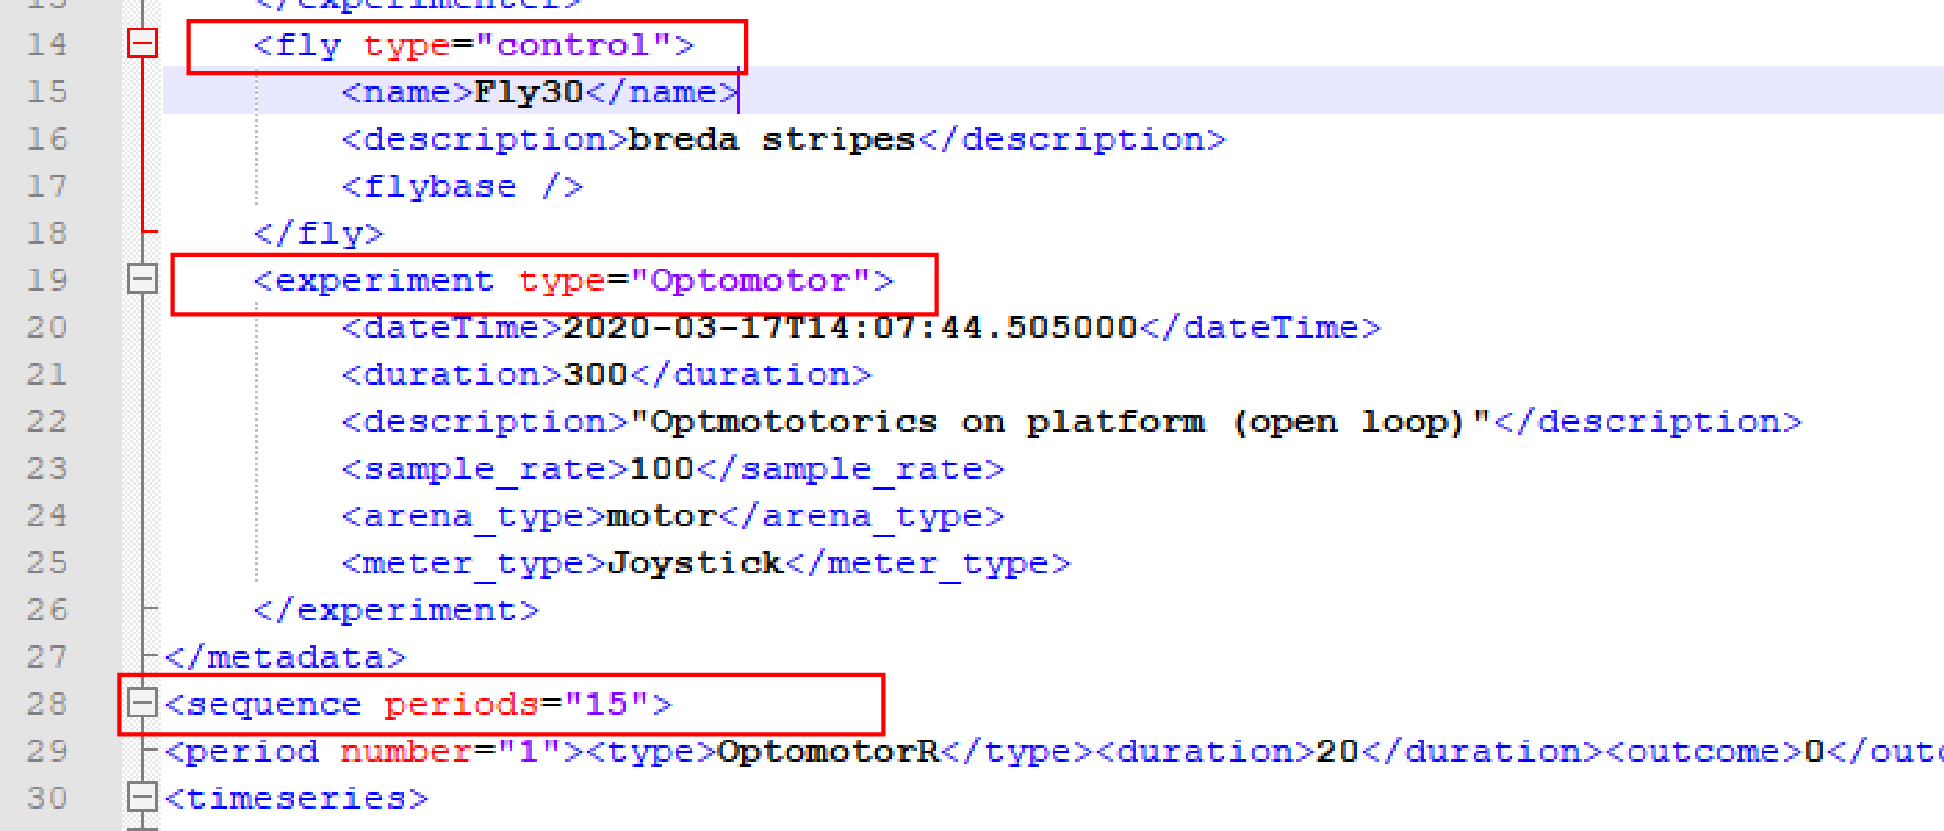
Updates on optomotor response software
- Added a timer
- Previous version generated faulty xml files. This bug has been squashed (see image below)
- Display window of the software now also prints which direction the striped arena turns
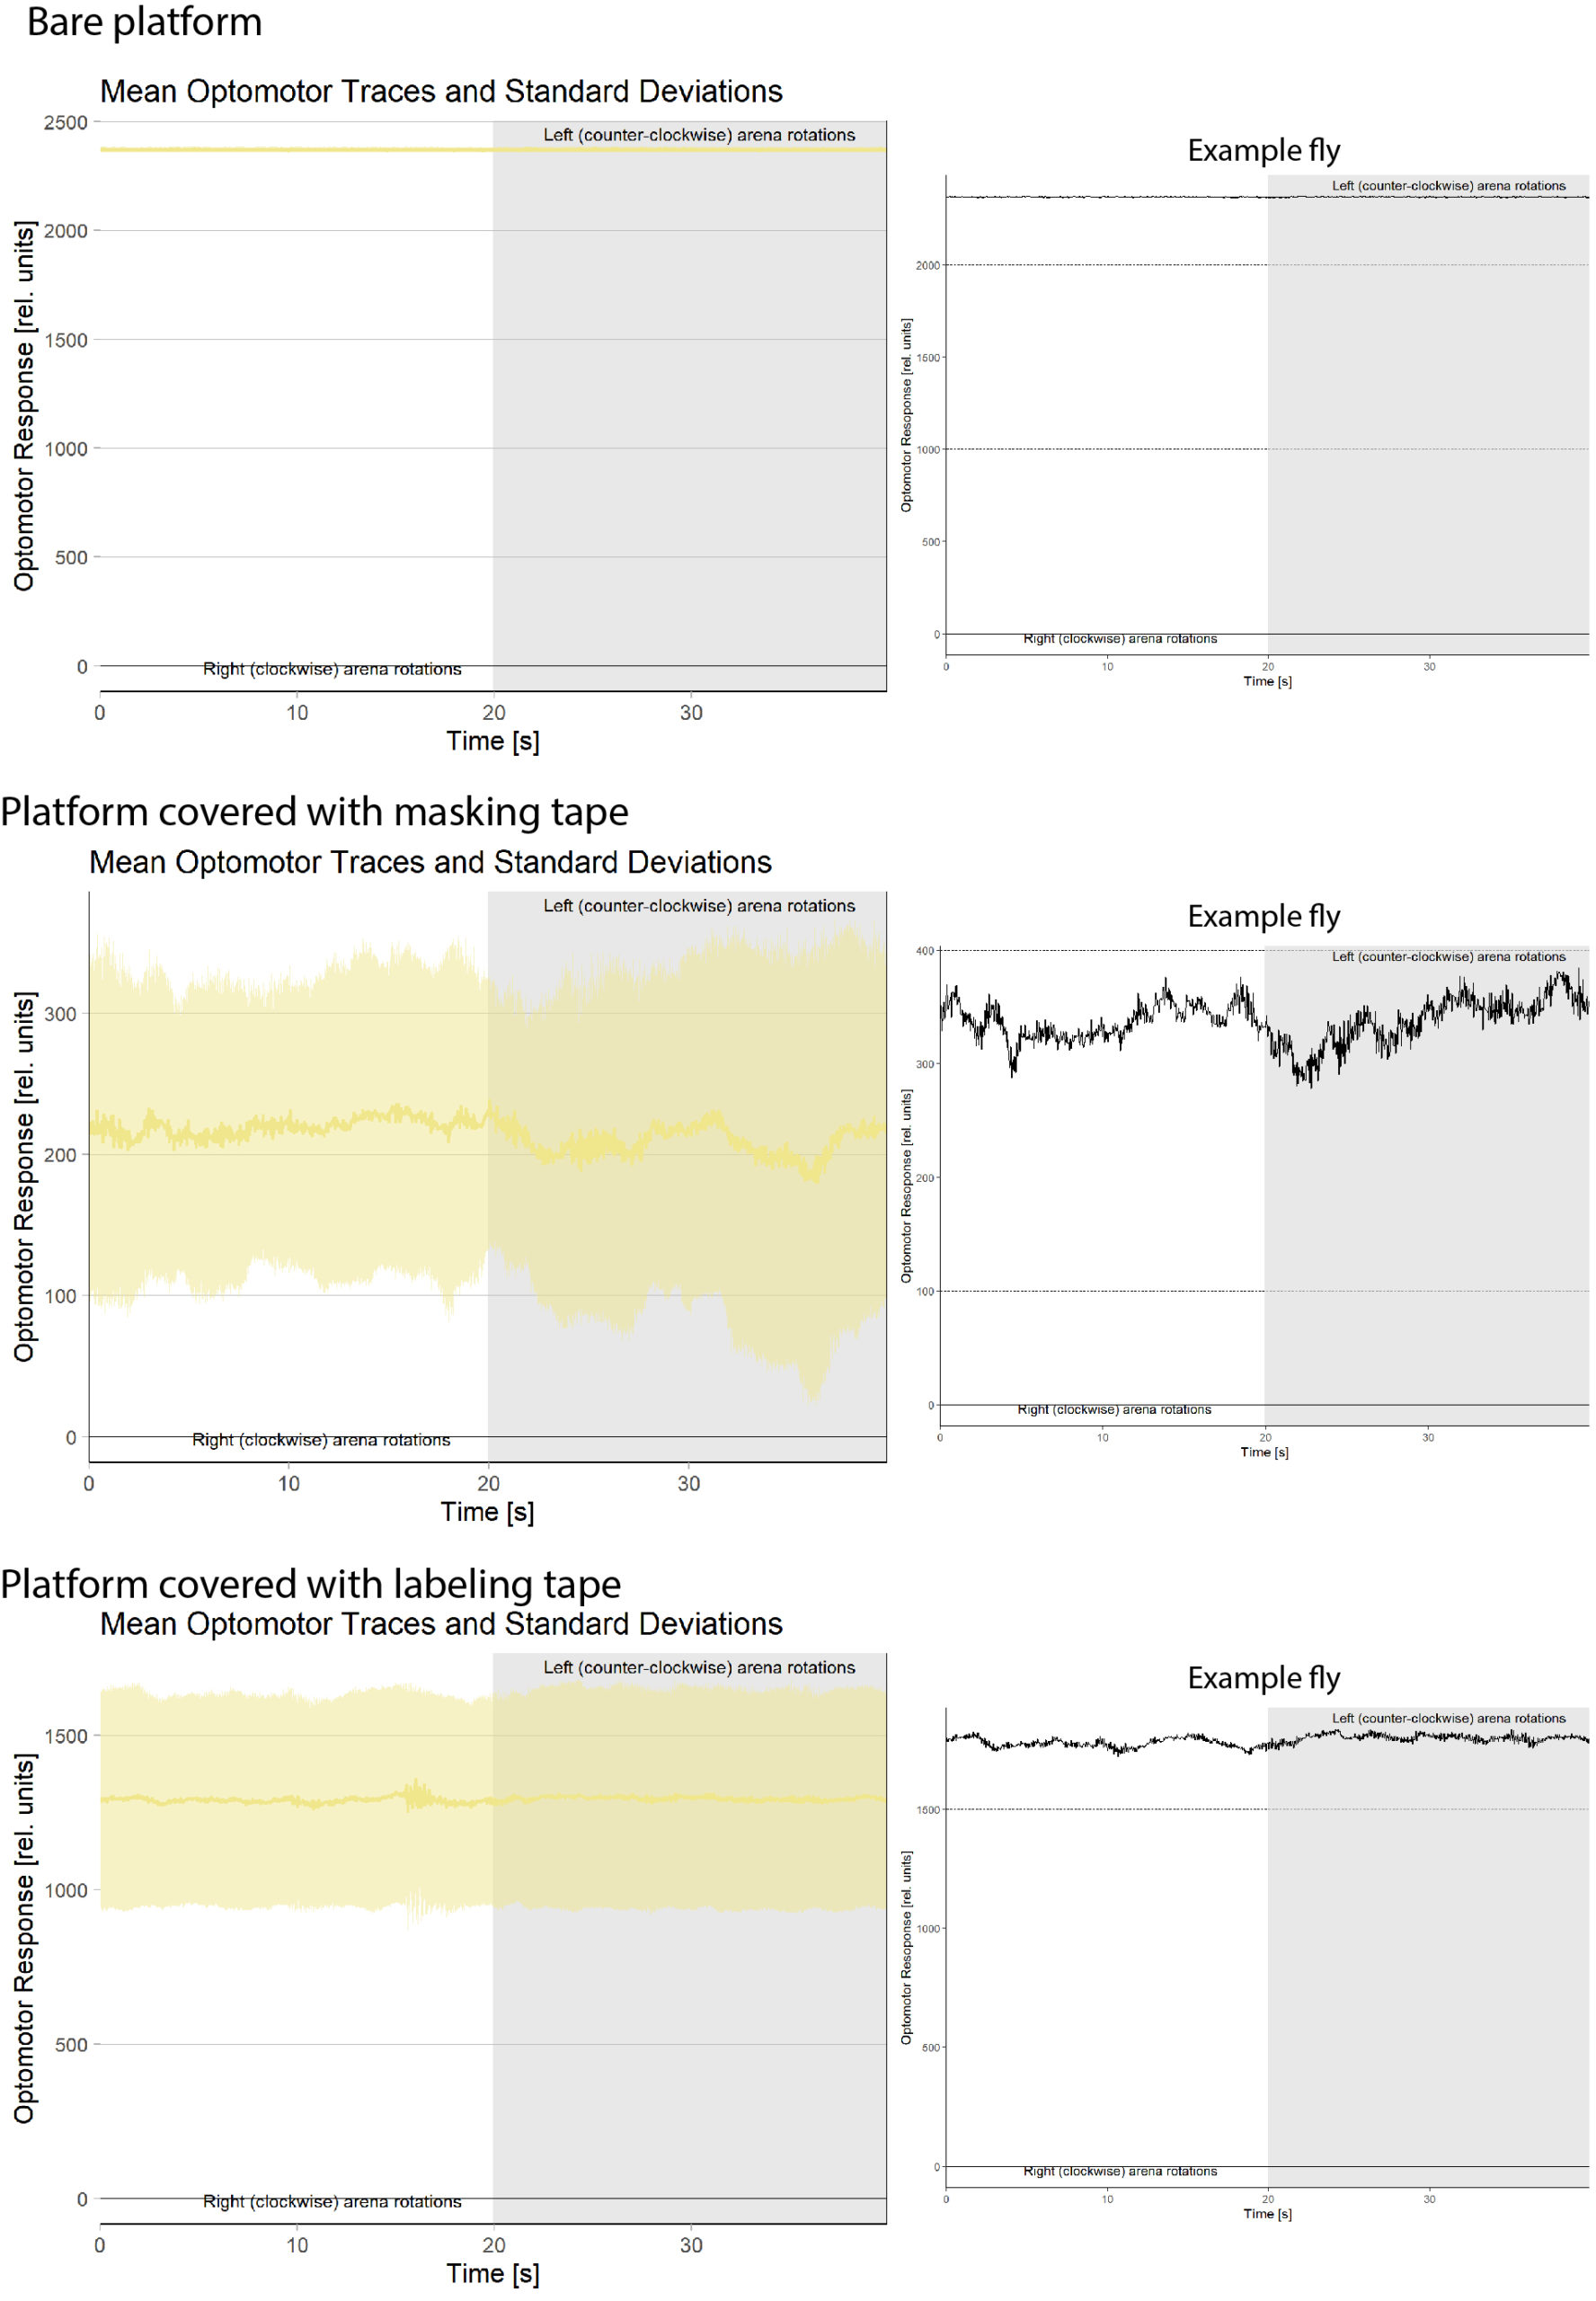
New optomotor platform not yet optimized
A new platform have been designed for the optomotor response. It is placed on a pivot with the axis attached on the back. In contrast to the previous design witch only monitored movement in the left/right direction, the new design in theory allows the fly to rotate the platform.
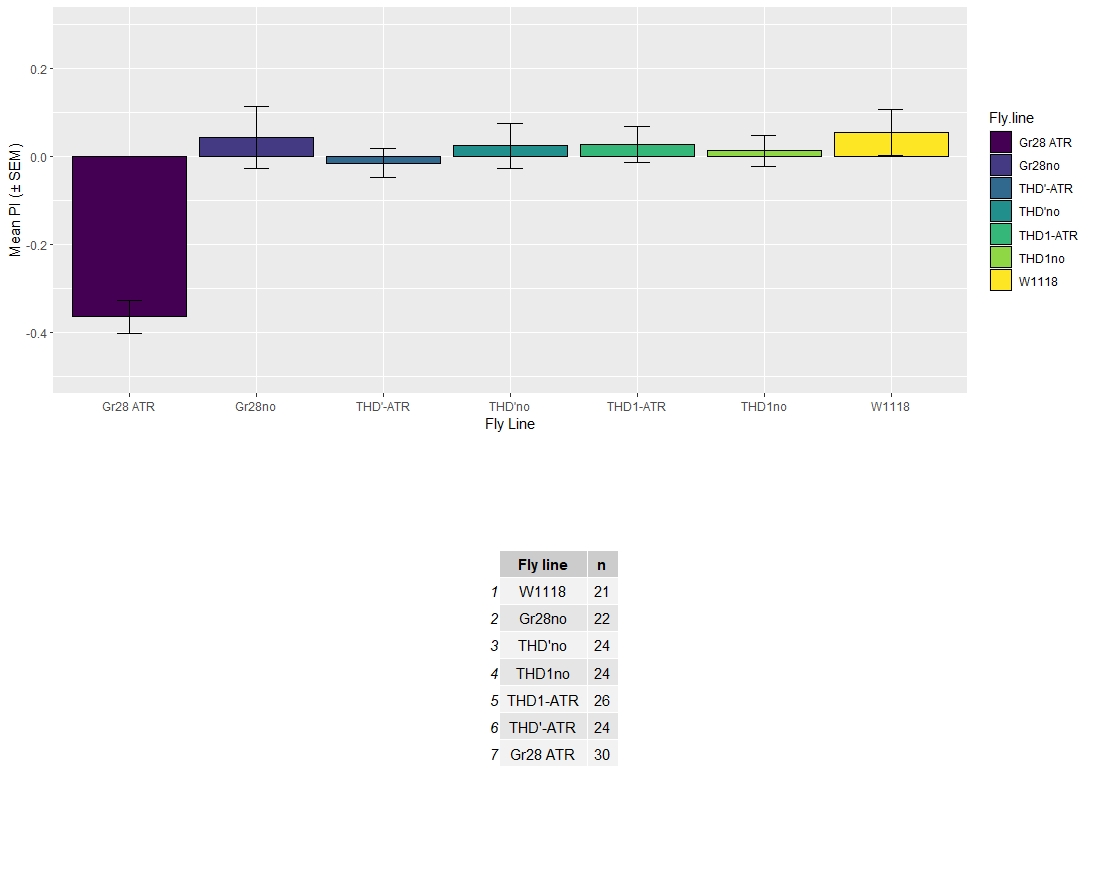
Optogenetic T-maze
The figure below contains the separate data from both Emer, and Ferruh/Kader. Both data sets have been merged too.
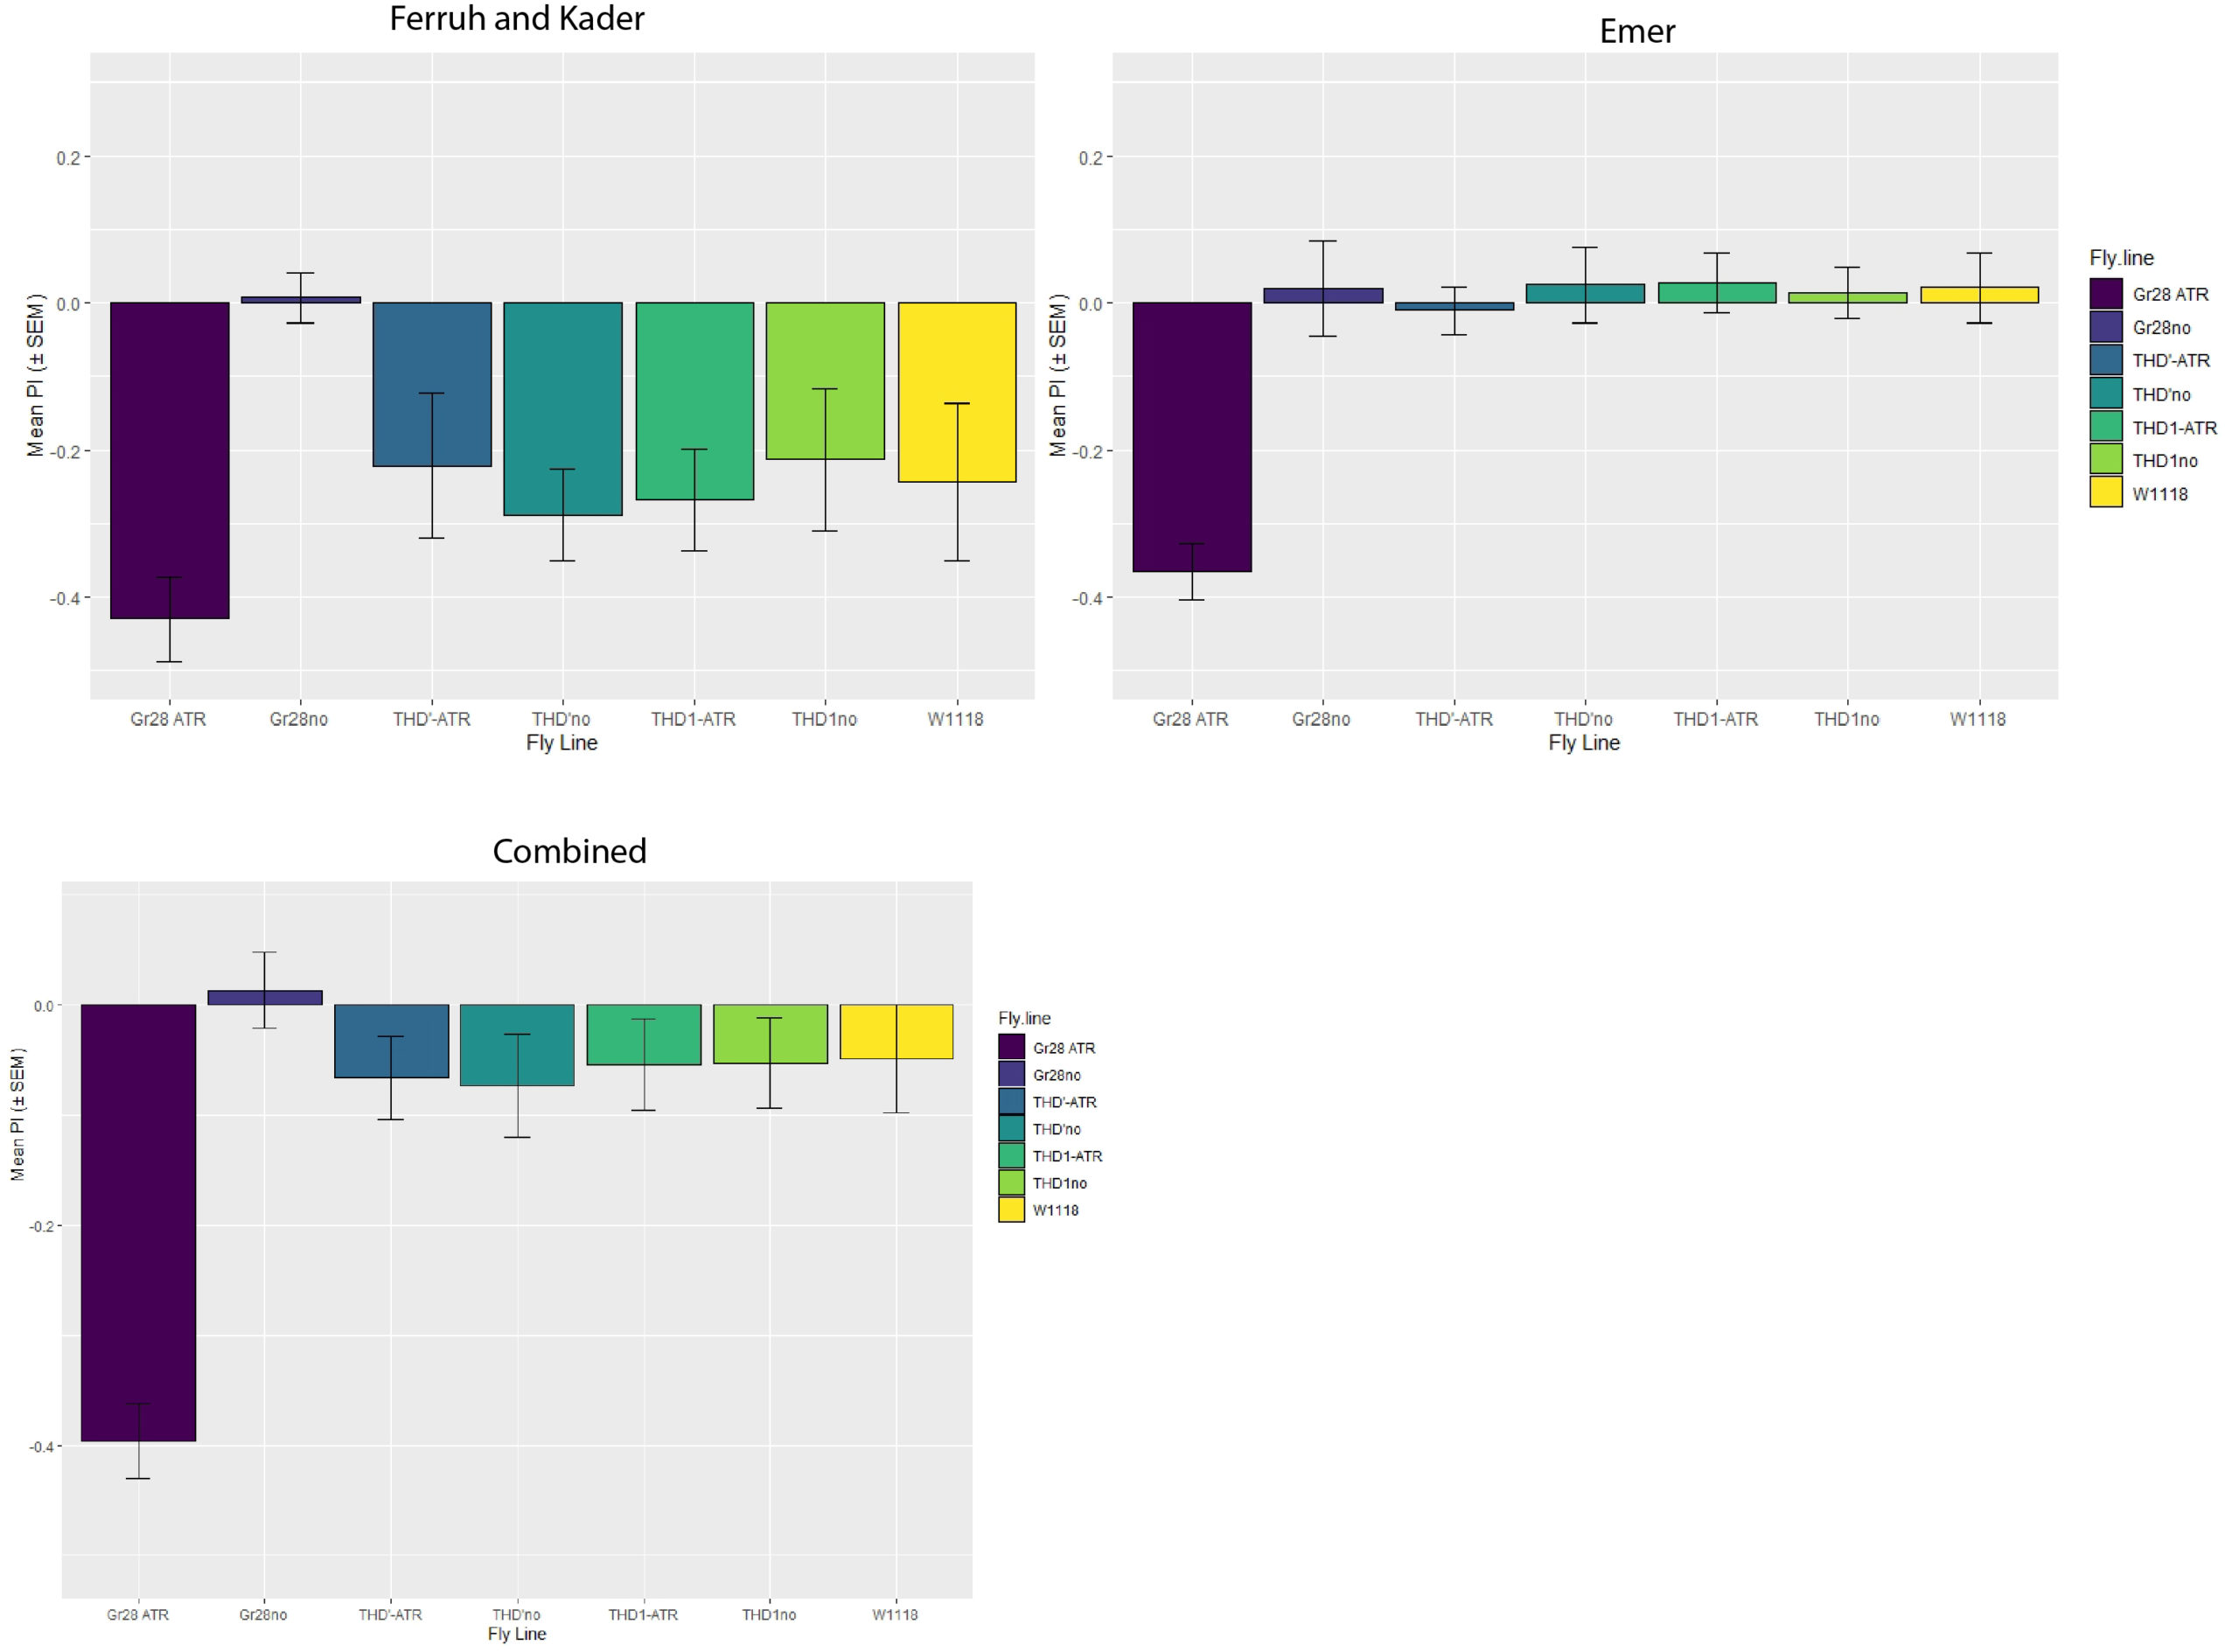
| Fly line | sample size |
| Gr28 ATR | 60 |
| Gr28no | 56 |
| W1118 | 35 |
| THD’-ATR | 35 |
| THD’no | 36 |
| THD1no | 35 |
| THD1-ATR | 37 |
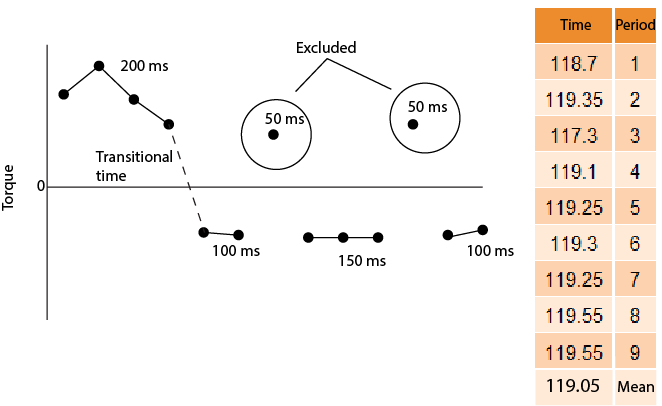
Dwelling time
The schematic drawing is an example. The method that is currently used to calculate the dwelling time is excluding times that are 50 ms. Each dwelling time is getting an additional 50ms to compensate for the transitional time loss (dashed line in schematic drawing). The chart on the right side is the total time for each period when adding negative and positive dwelling times.
Fluorescence histogram
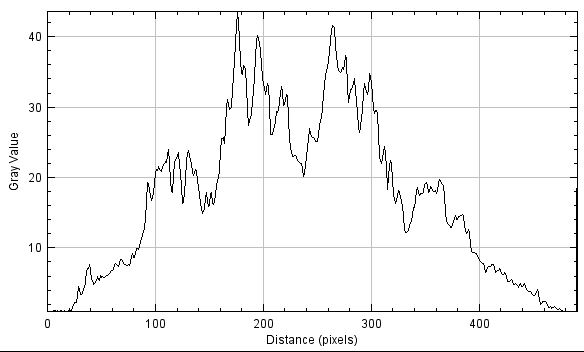
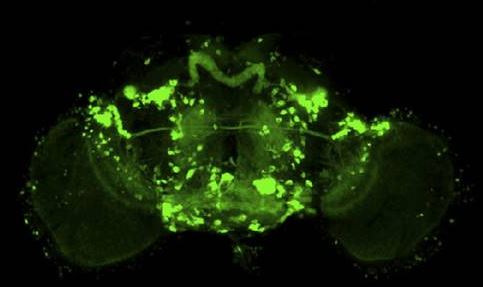
Proof of concept. I was playing around with ImageJ and found that there is a built in function already that does analyze the fluorescence intensity. I am just not sure exactly what it tells us. This is only as far as I have gotten yet.
The image below is the one I used.