Making sense of dwelling data
on Tuesday, March 24th, 2020 12:54 | by Anders Eriksson
Mean or median?
| Unpunished | Punished | |
| 100 | 1 | |
| 1 | 3 | |
| 1,2 | 1 | |
| 0,5 | 2 | |
| 0,3 | 5 | |
| 5 | ||
| Mean | 18 | 2,4 |
| Median | 1,1 | 2 |
A highly hypothetical scenario of how the distribution of dwelling times could be. Even if unrealistic, it still illustrates the problem of using median instead of mean.
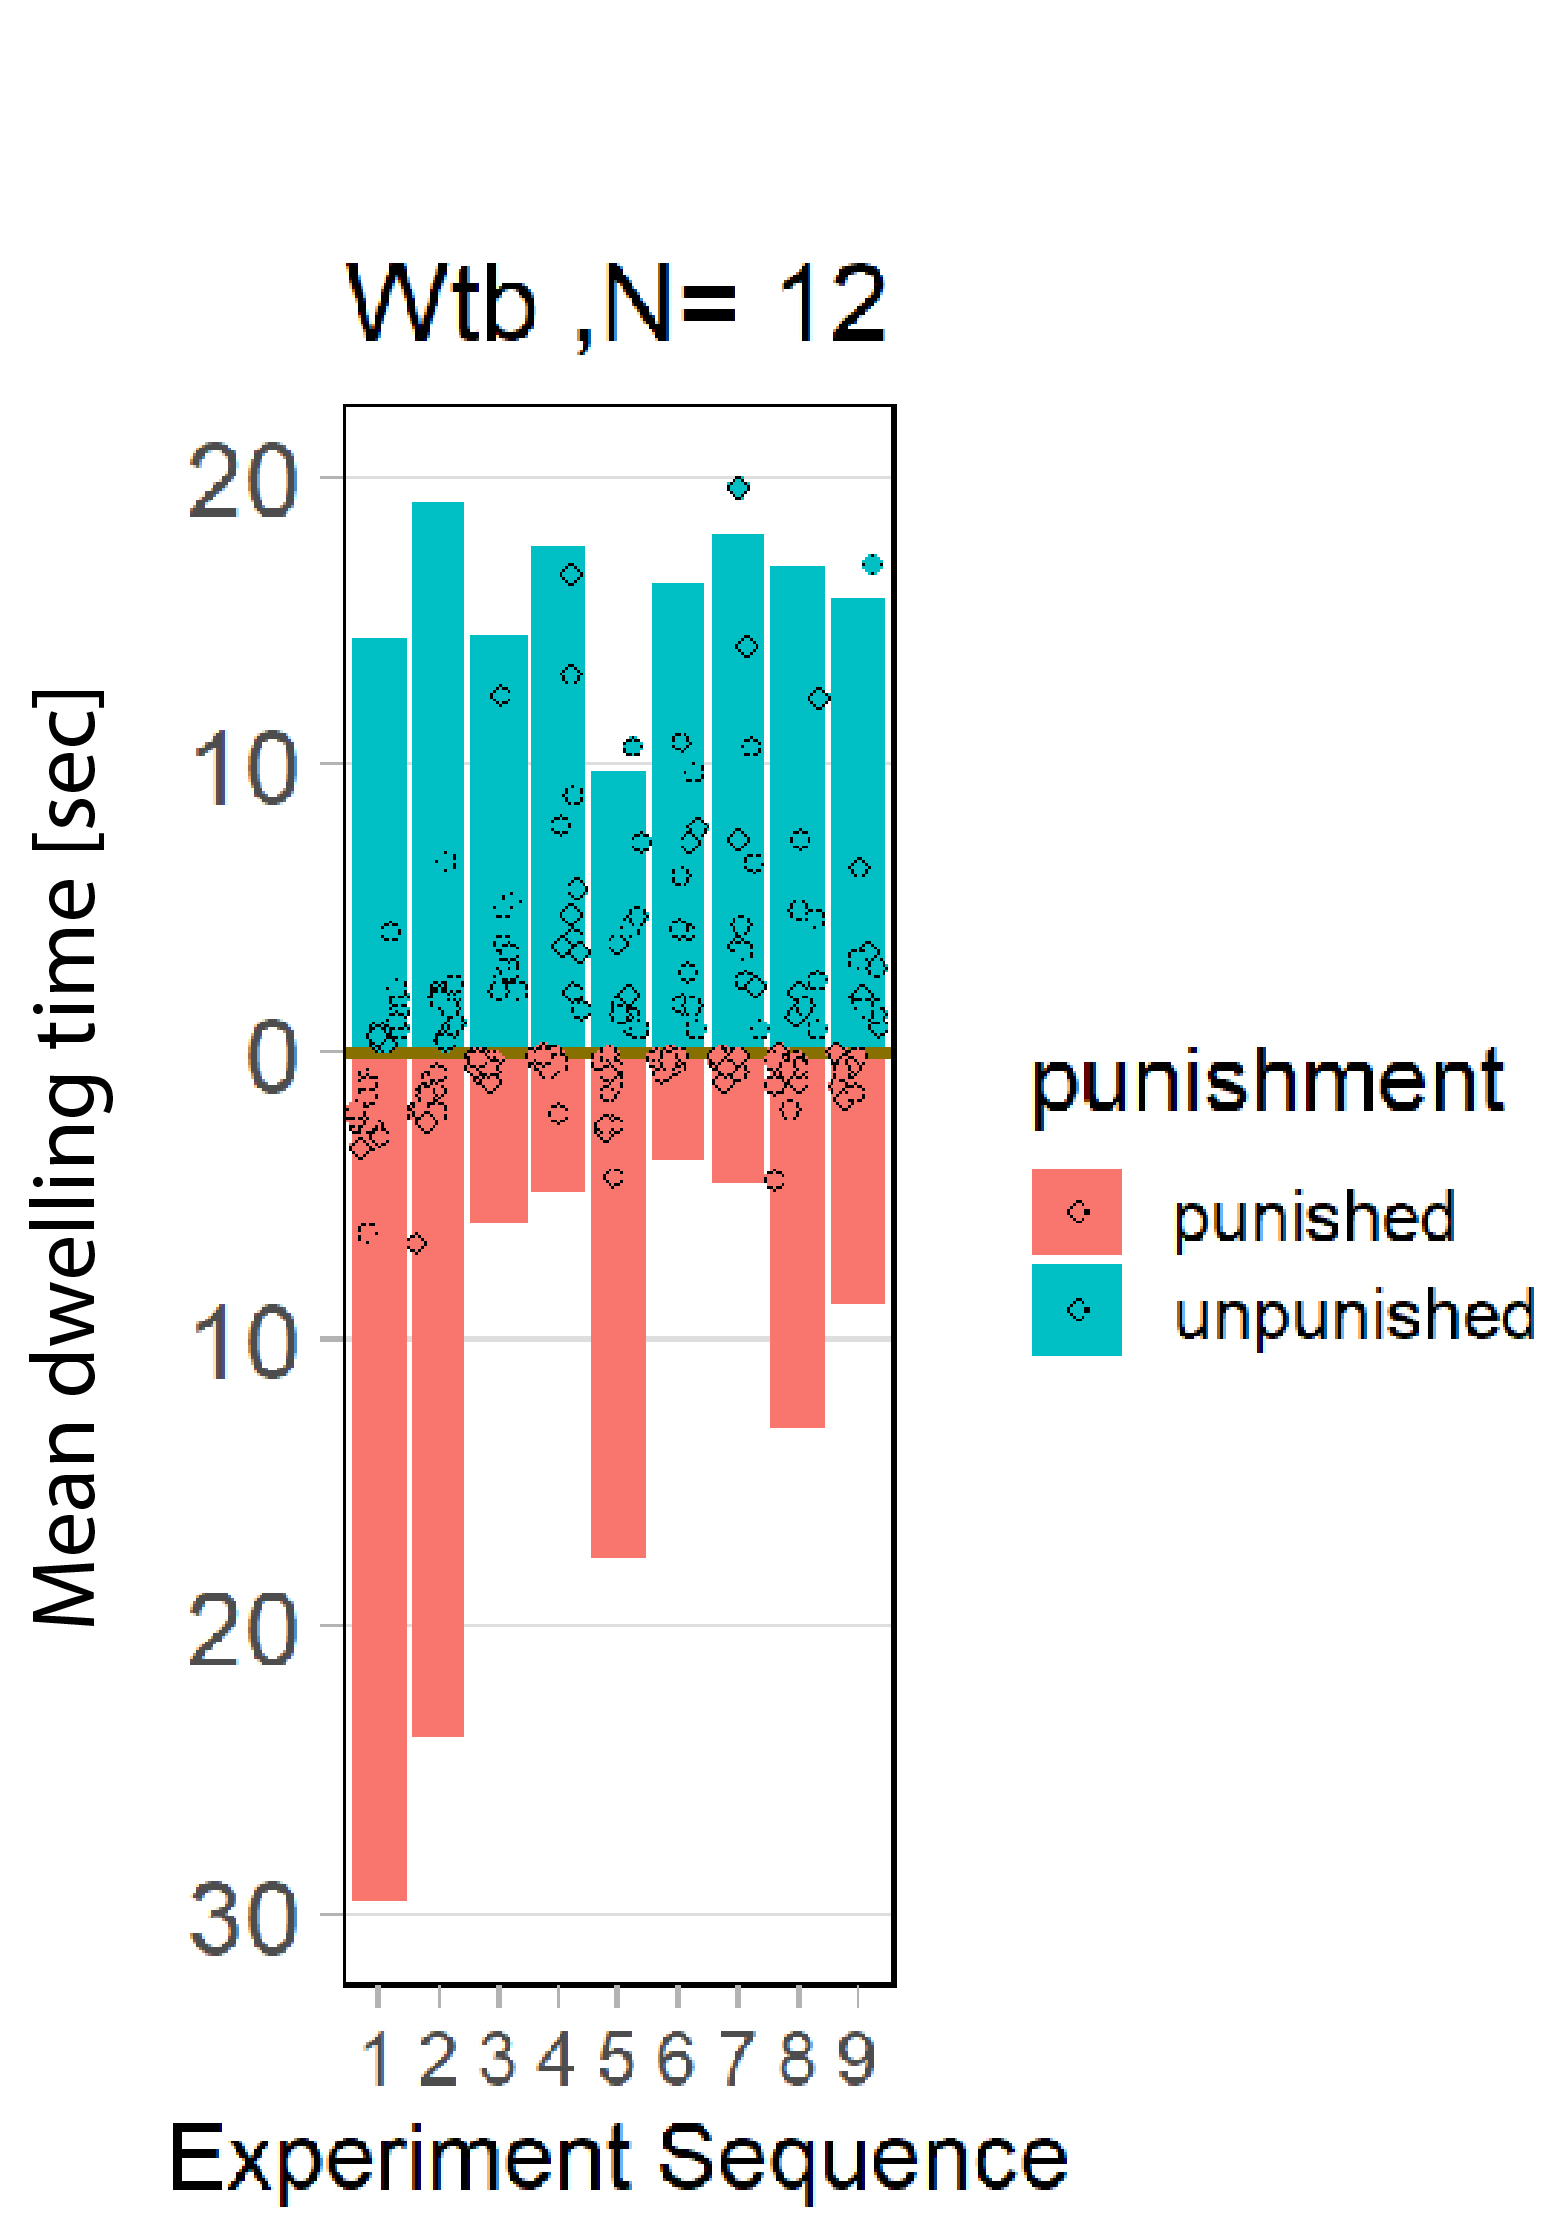
Plotting the dwelling times as means
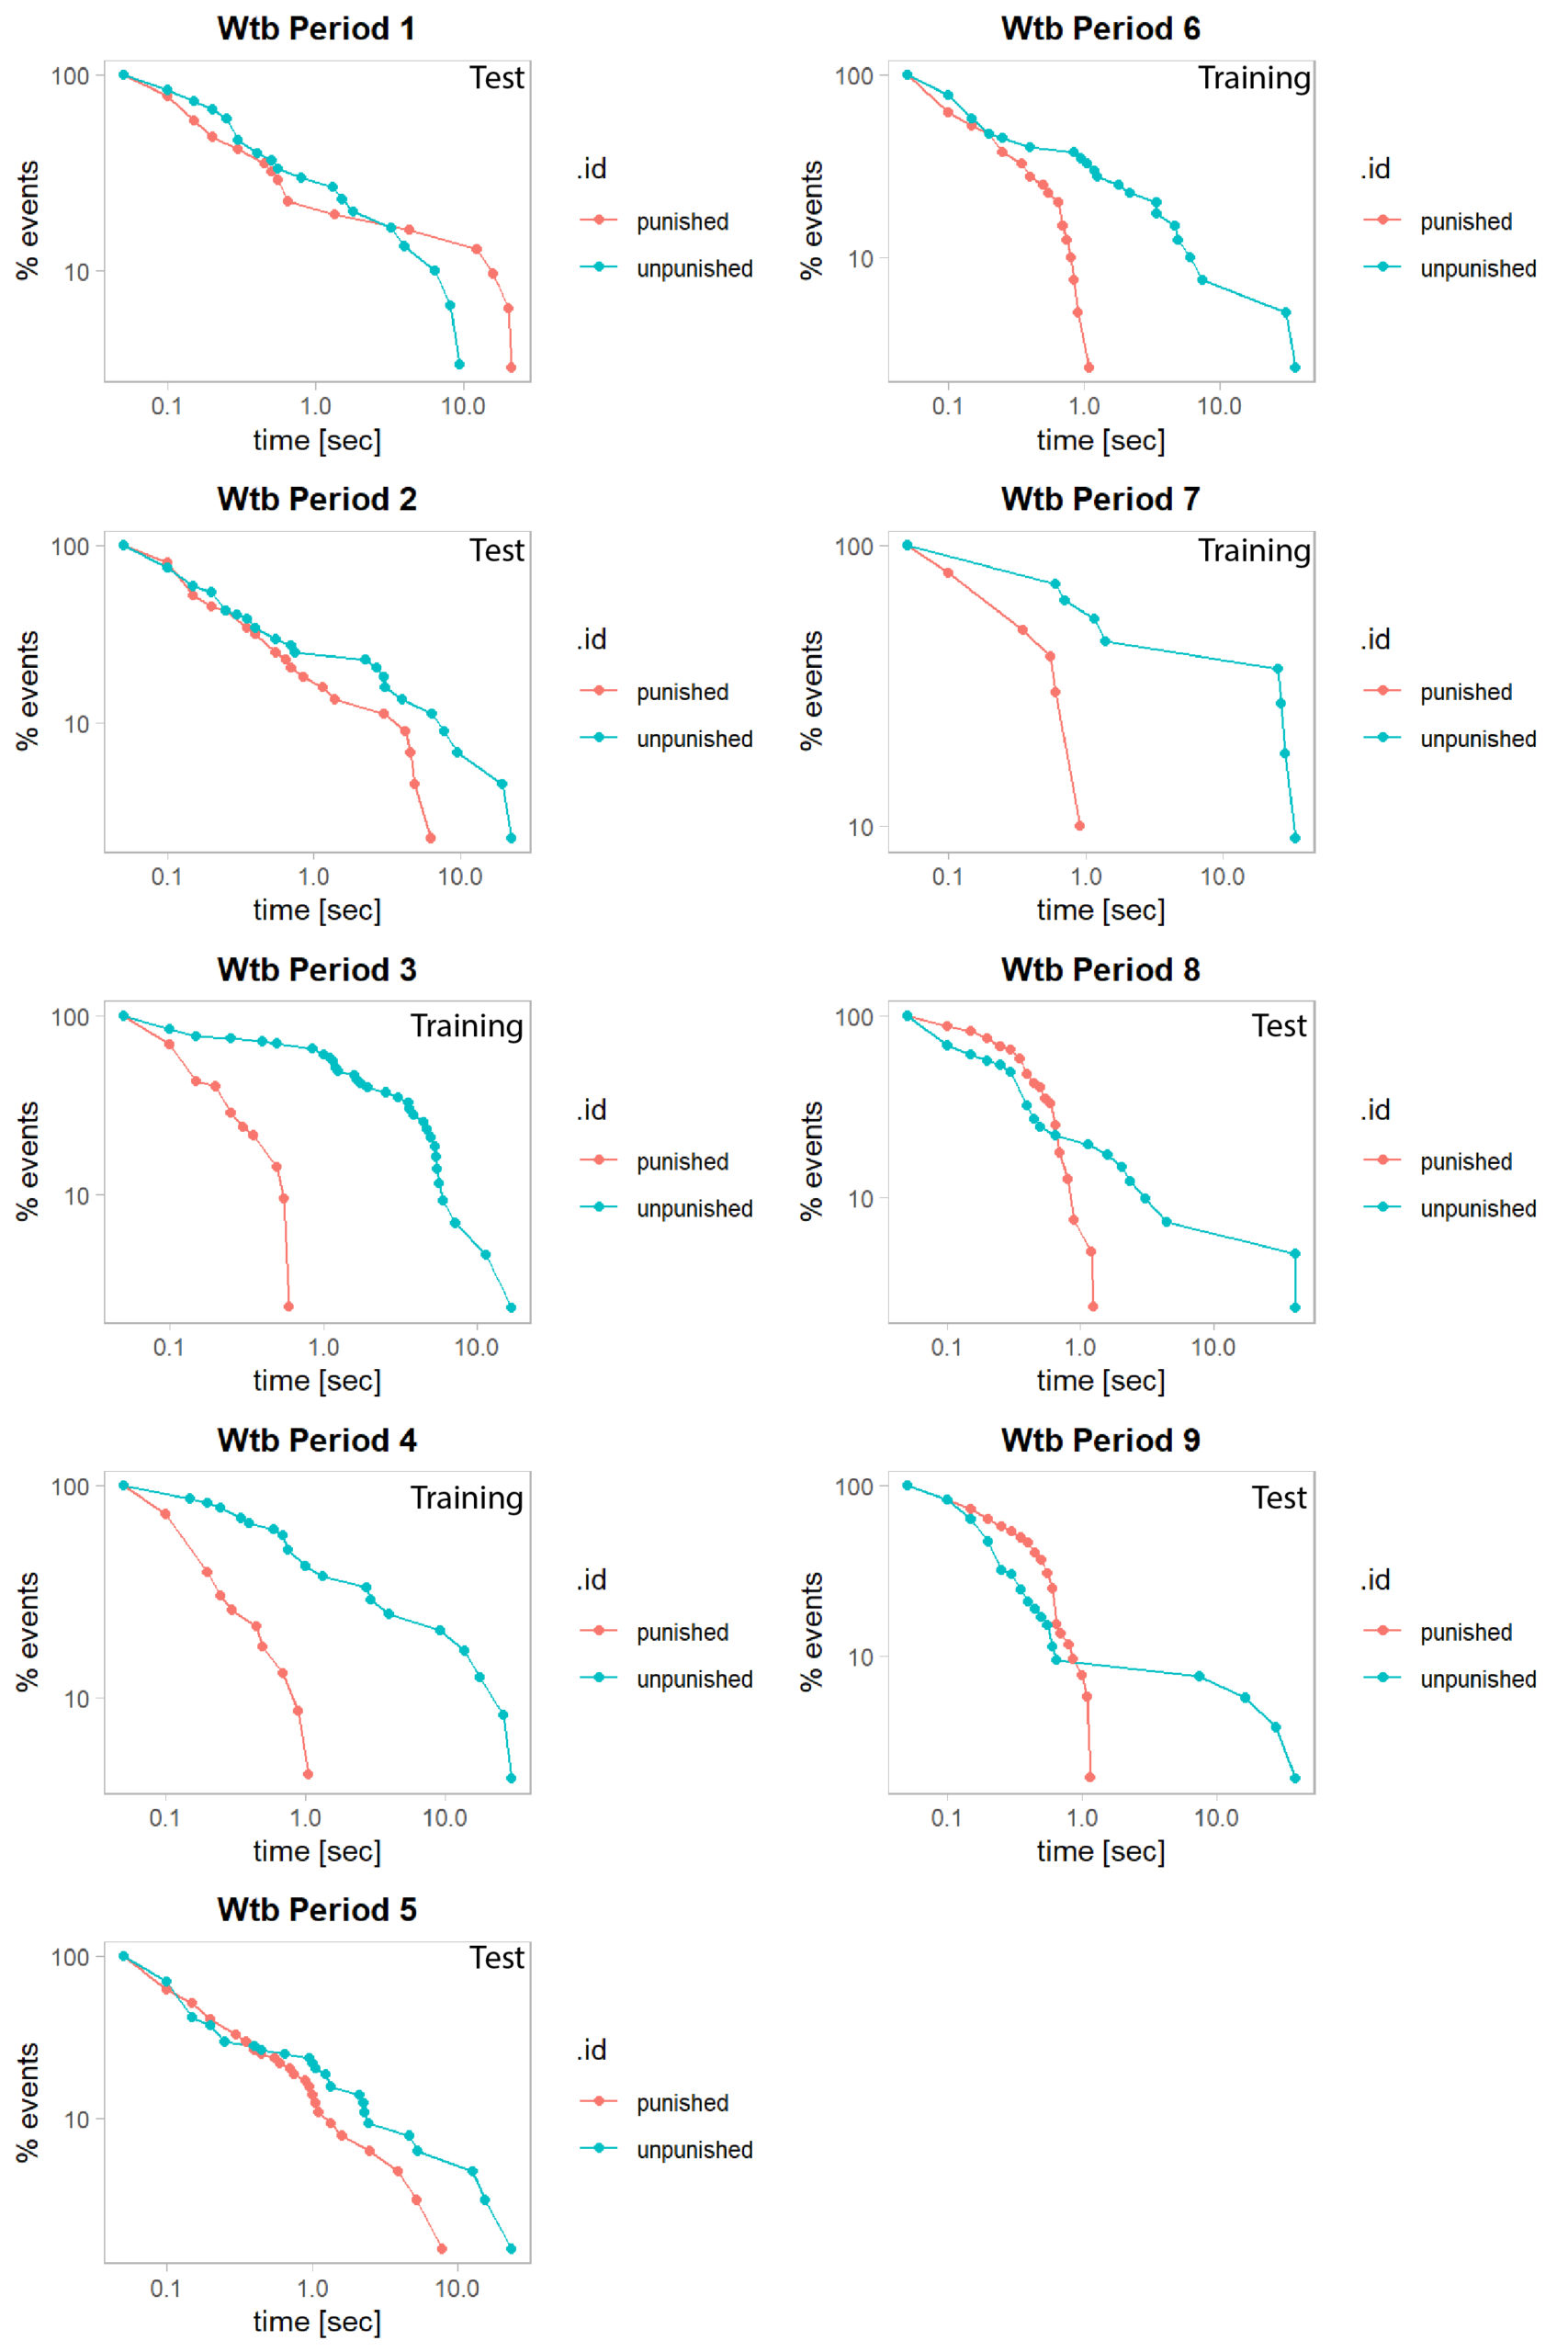
Grouped analysis of dwelling times
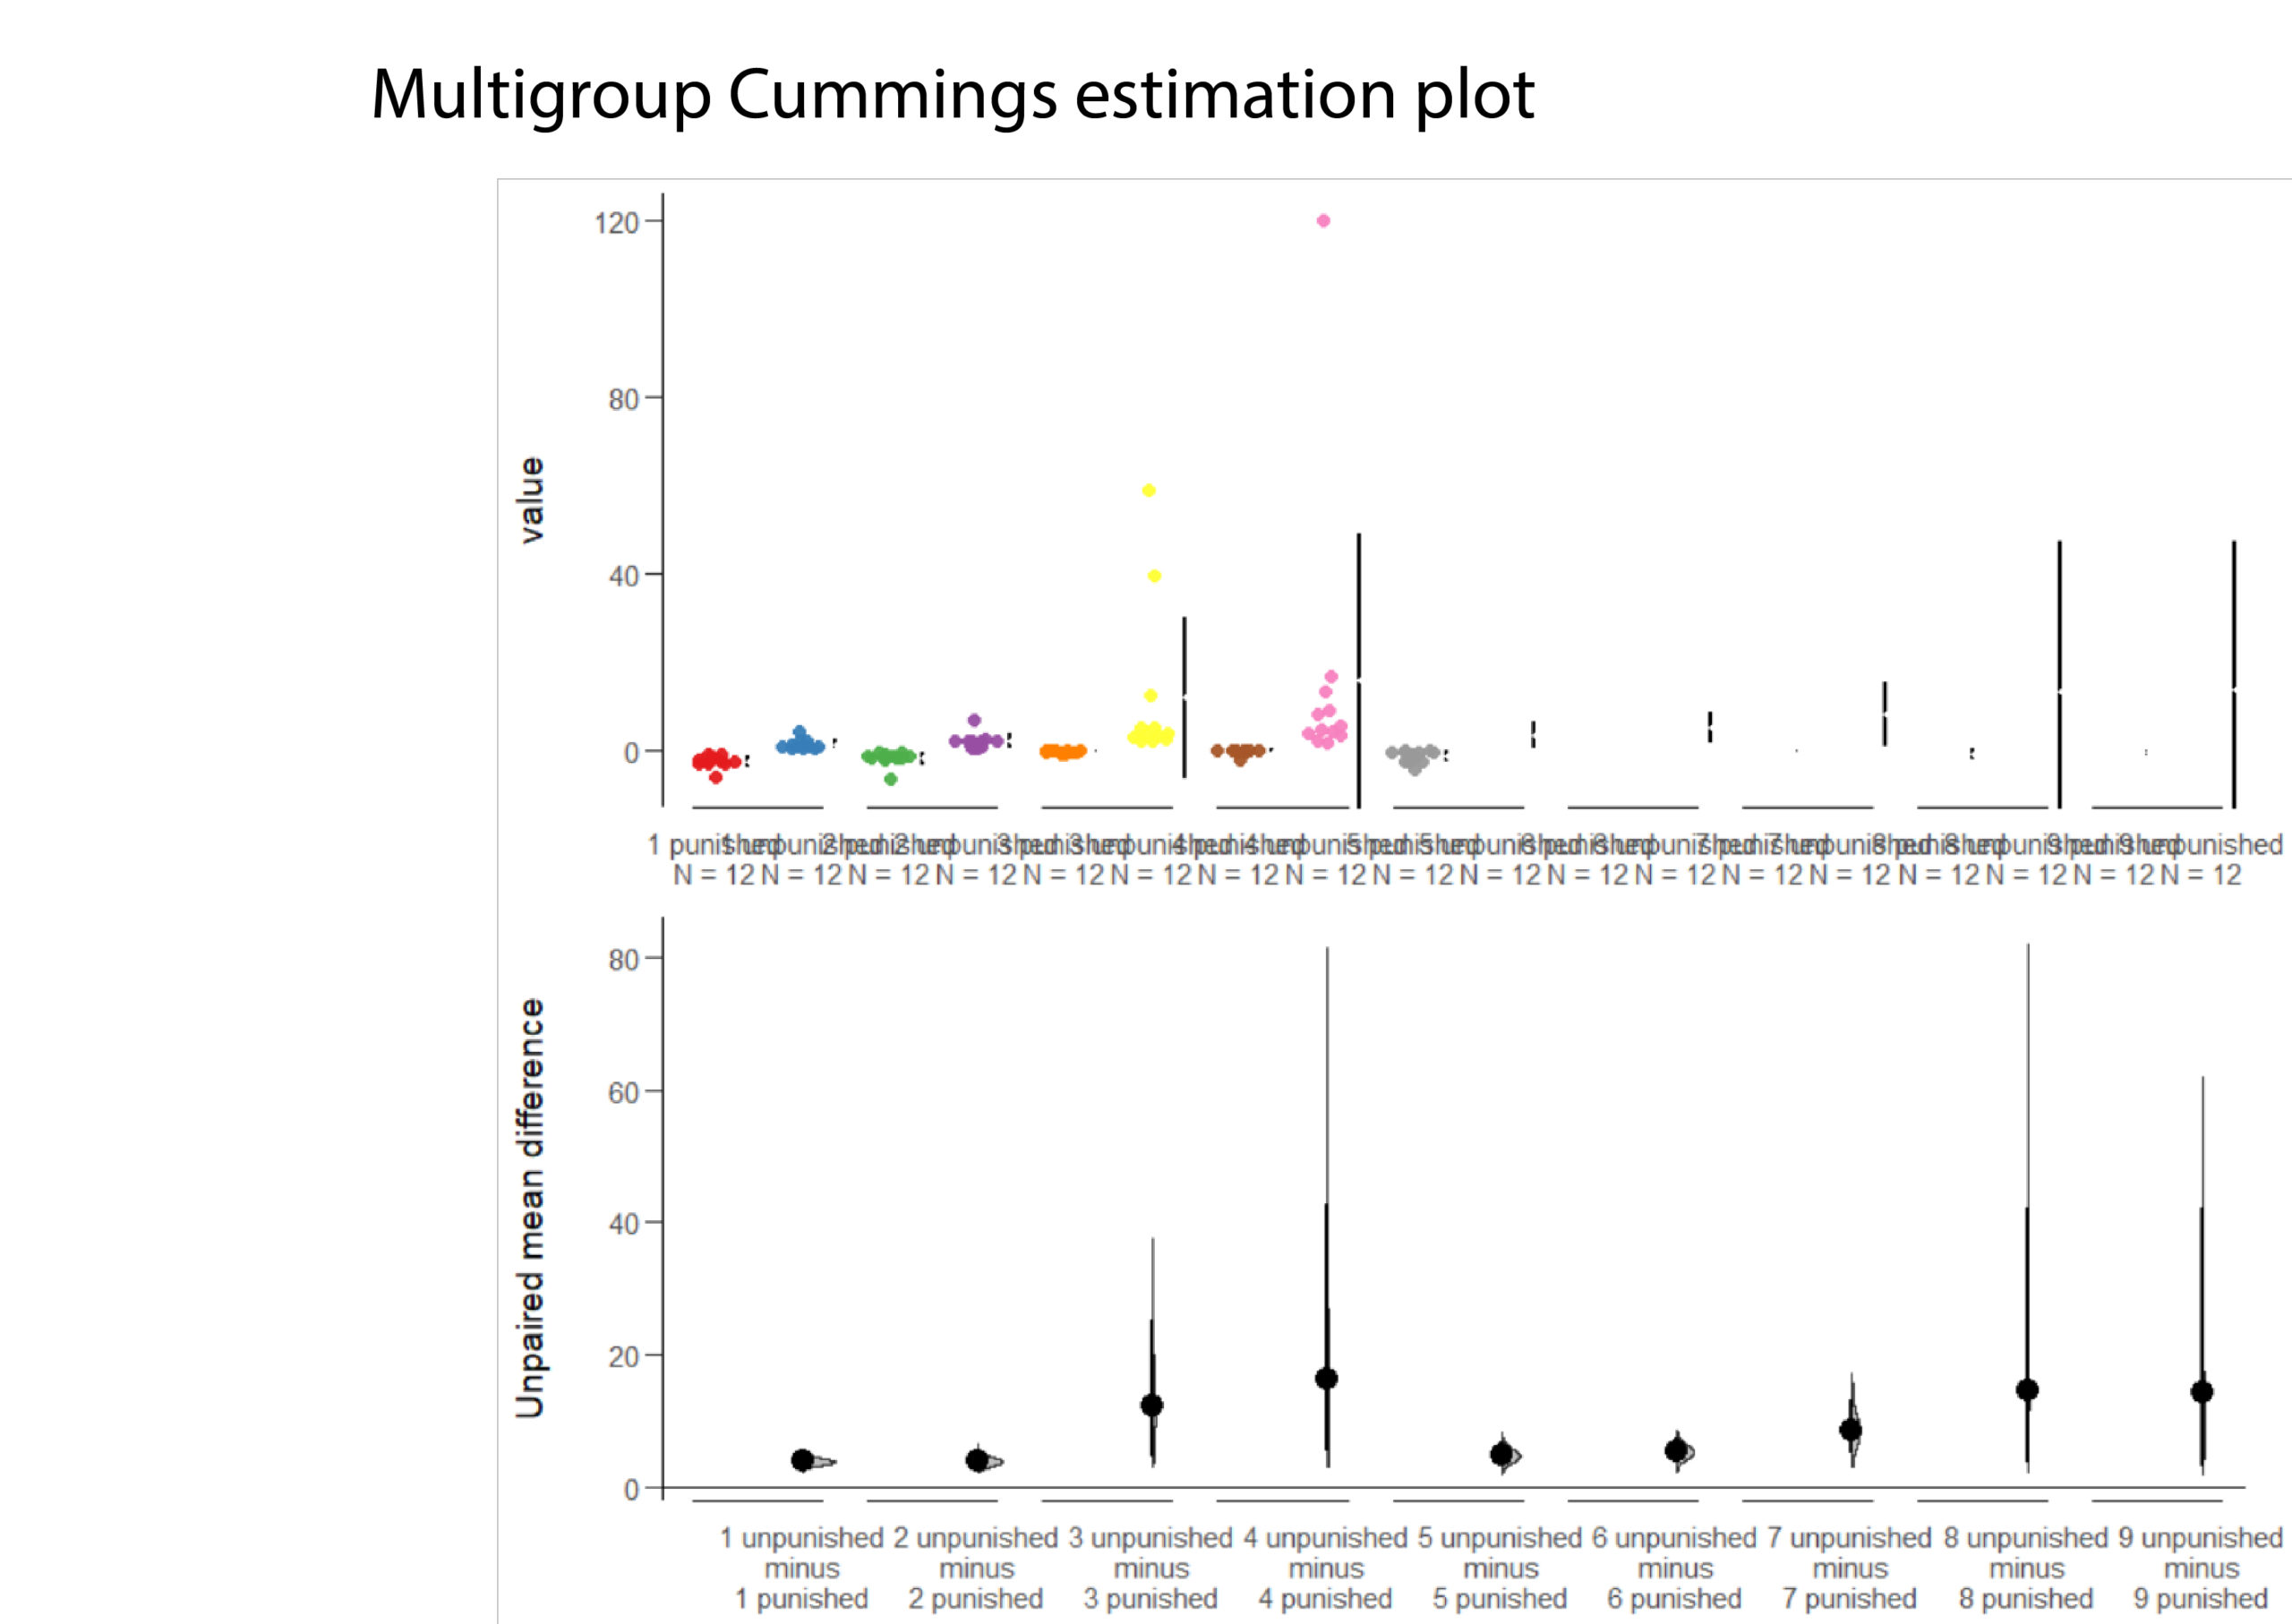
Cumming estimation plot

Category: flight, Memory, Operant learning, operant self-learning, R code
Leave a Reply