Optogenetic T-maze
on Wednesday, February 19th, 2020 1:45 | by Anders Eriksson
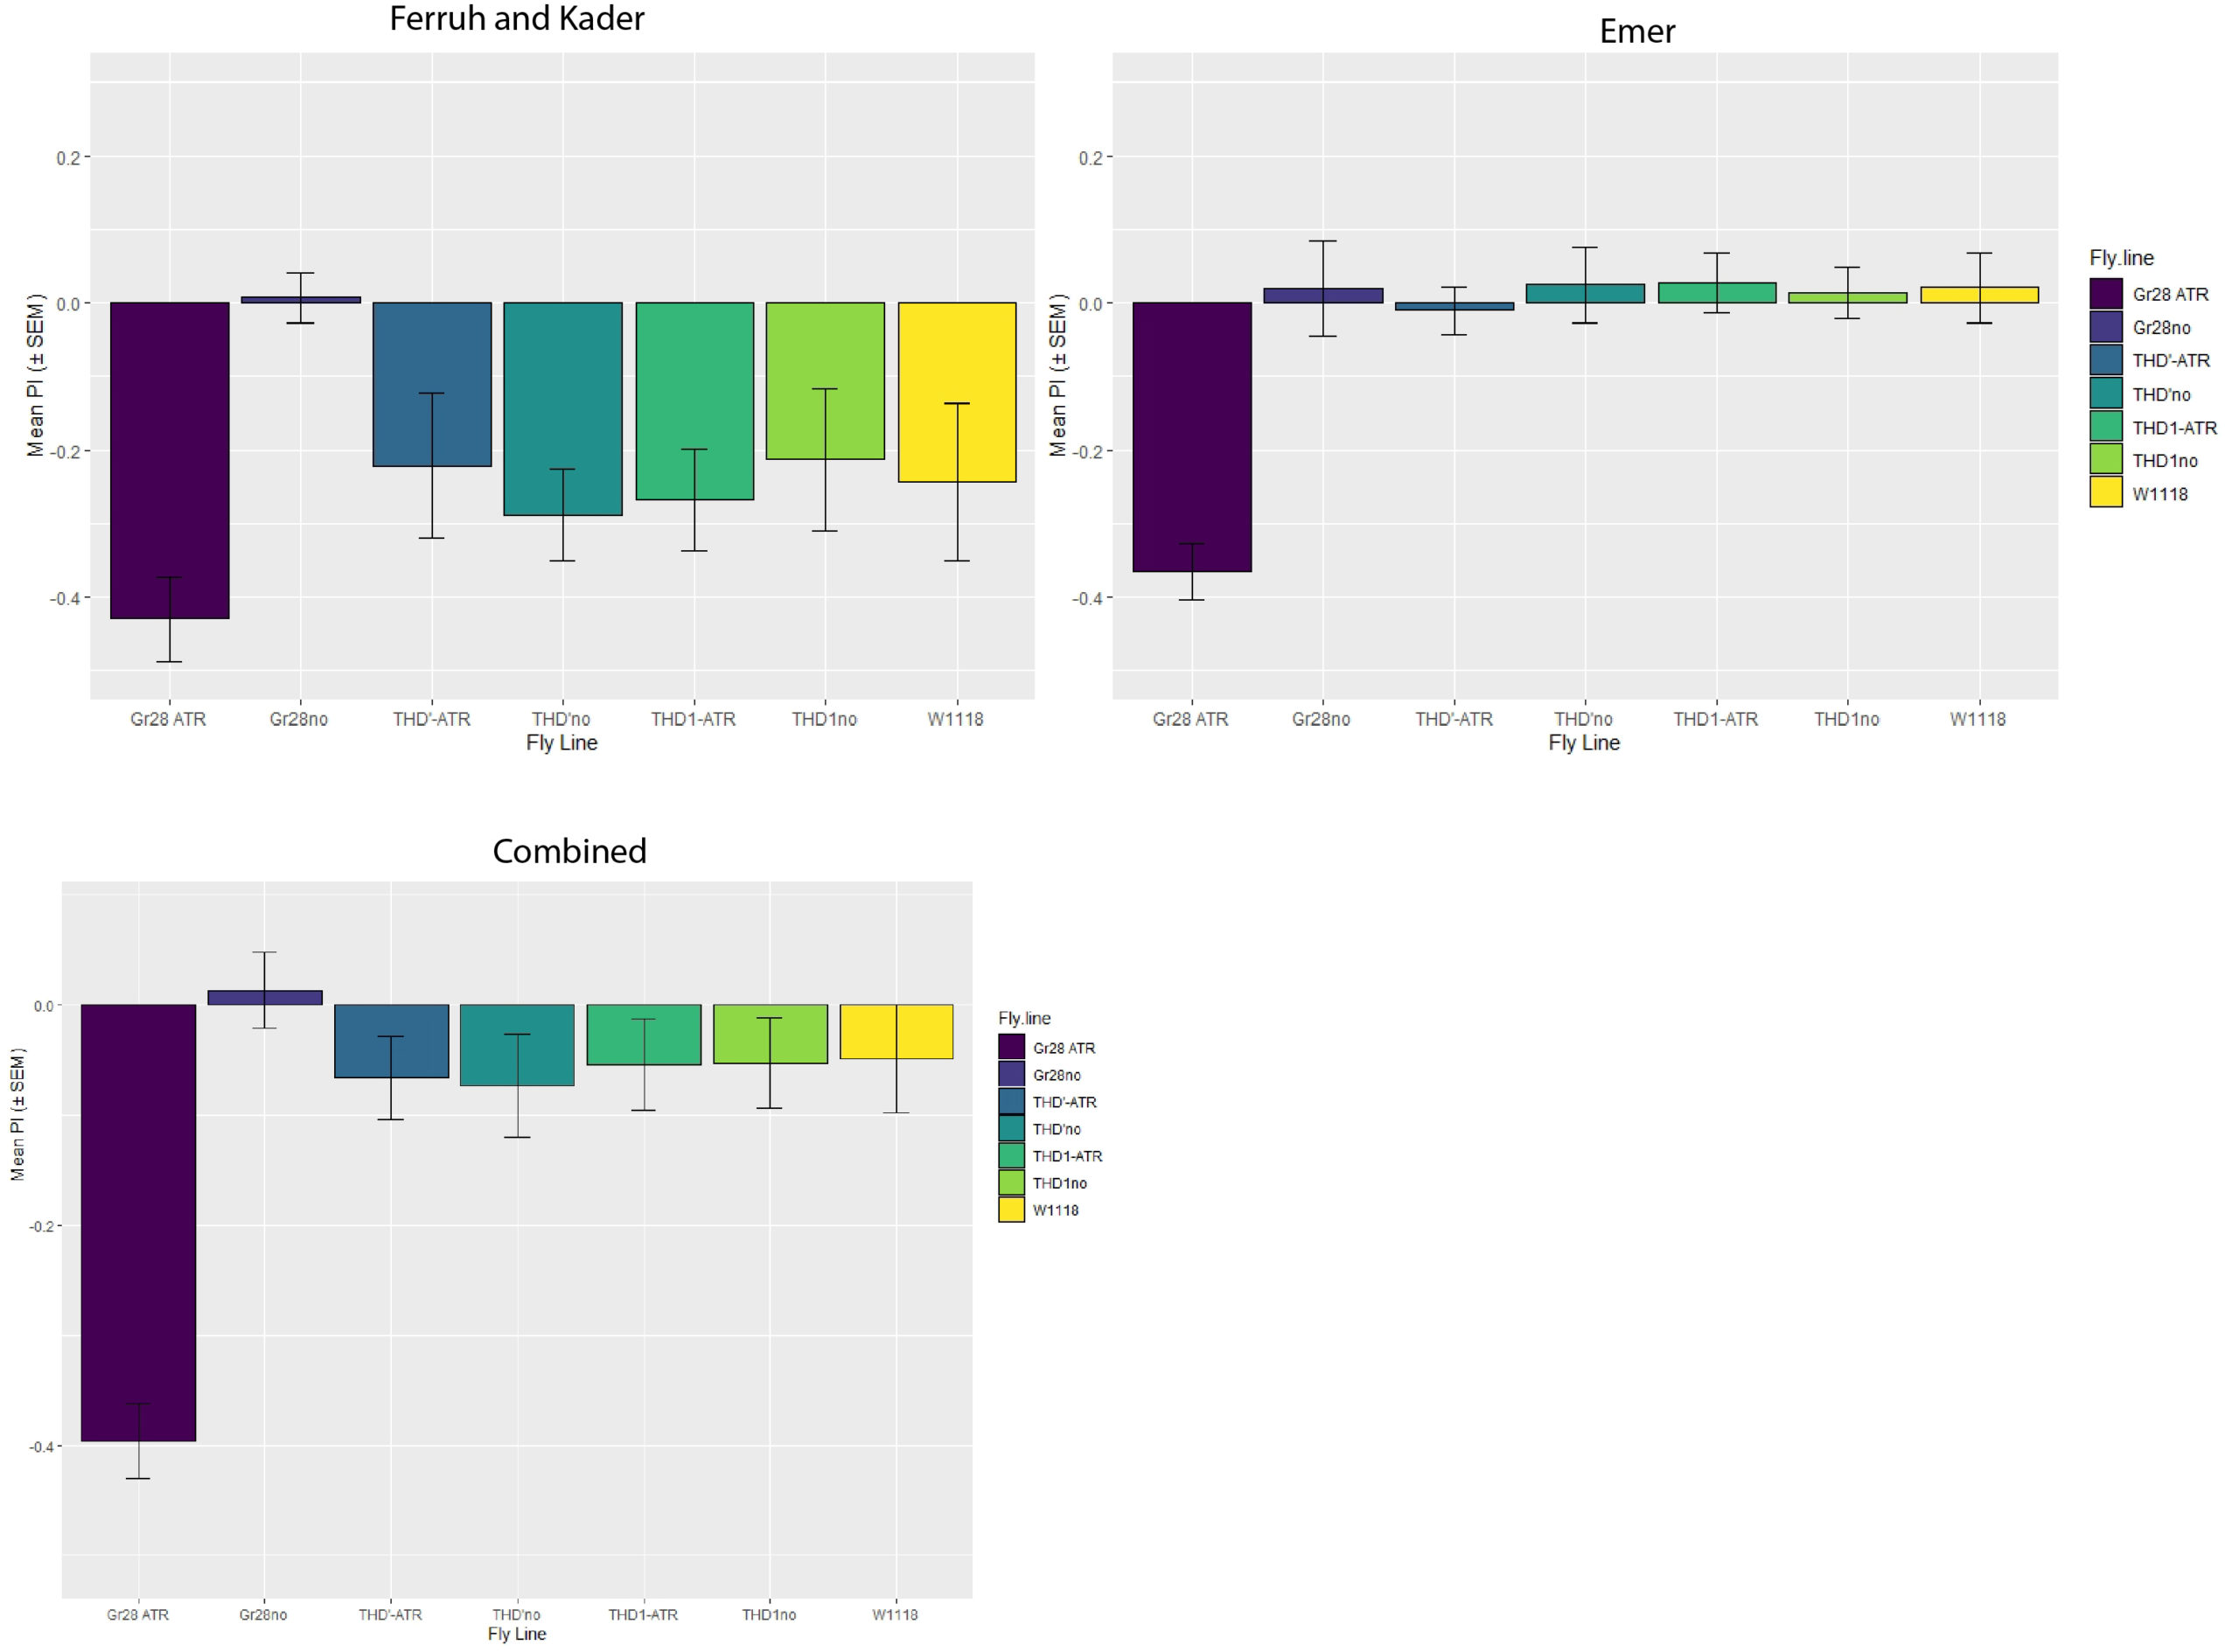
The figure below contains the separate data from both Emer, and Ferruh/Kader. Both data sets have been merged too.
| Fly line | sample size |
| Gr28 ATR | 60 |
| Gr28no | 56 |
| W1118 | 35 |
| THD’-ATR | 35 |
| THD’no | 36 |
| THD1no | 35 |
| THD1-ATR | 37 |

Category: neuronal activation, Optogenetics
Leave a Reply