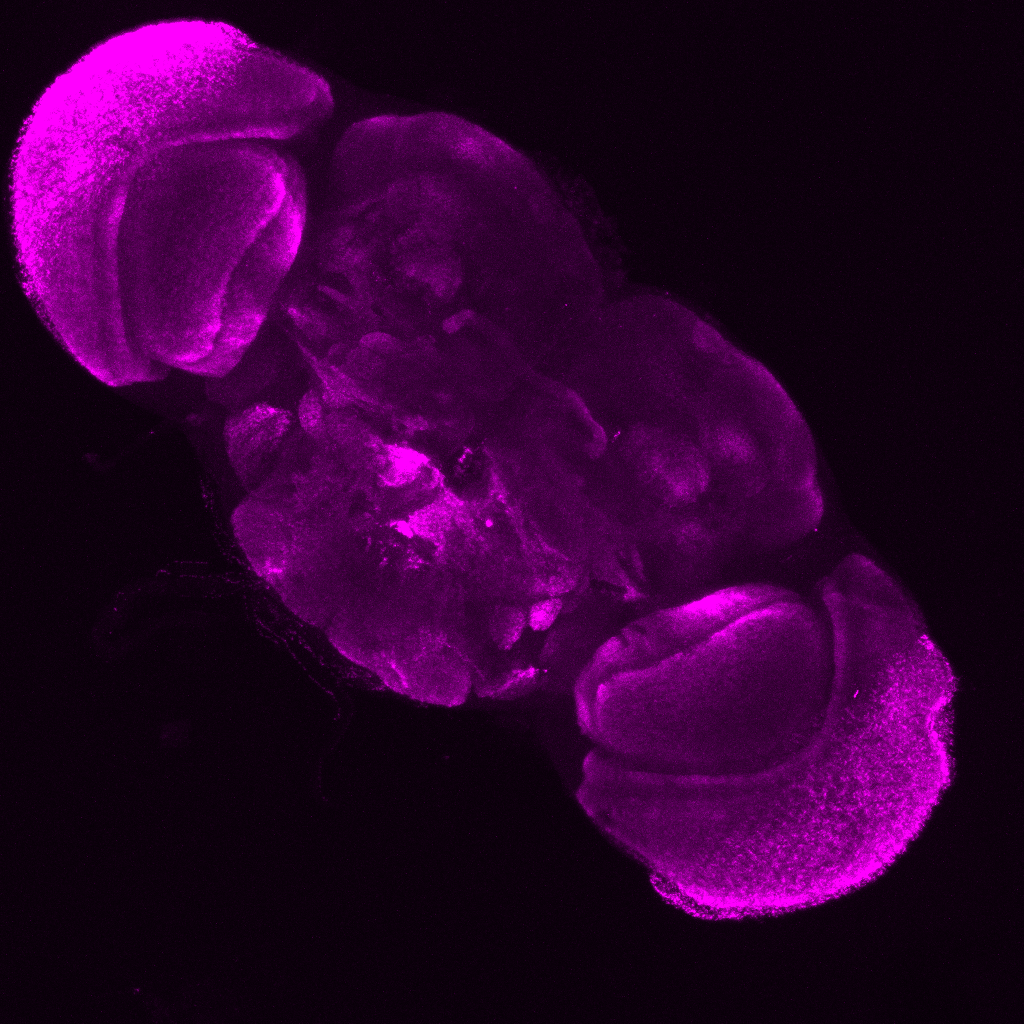
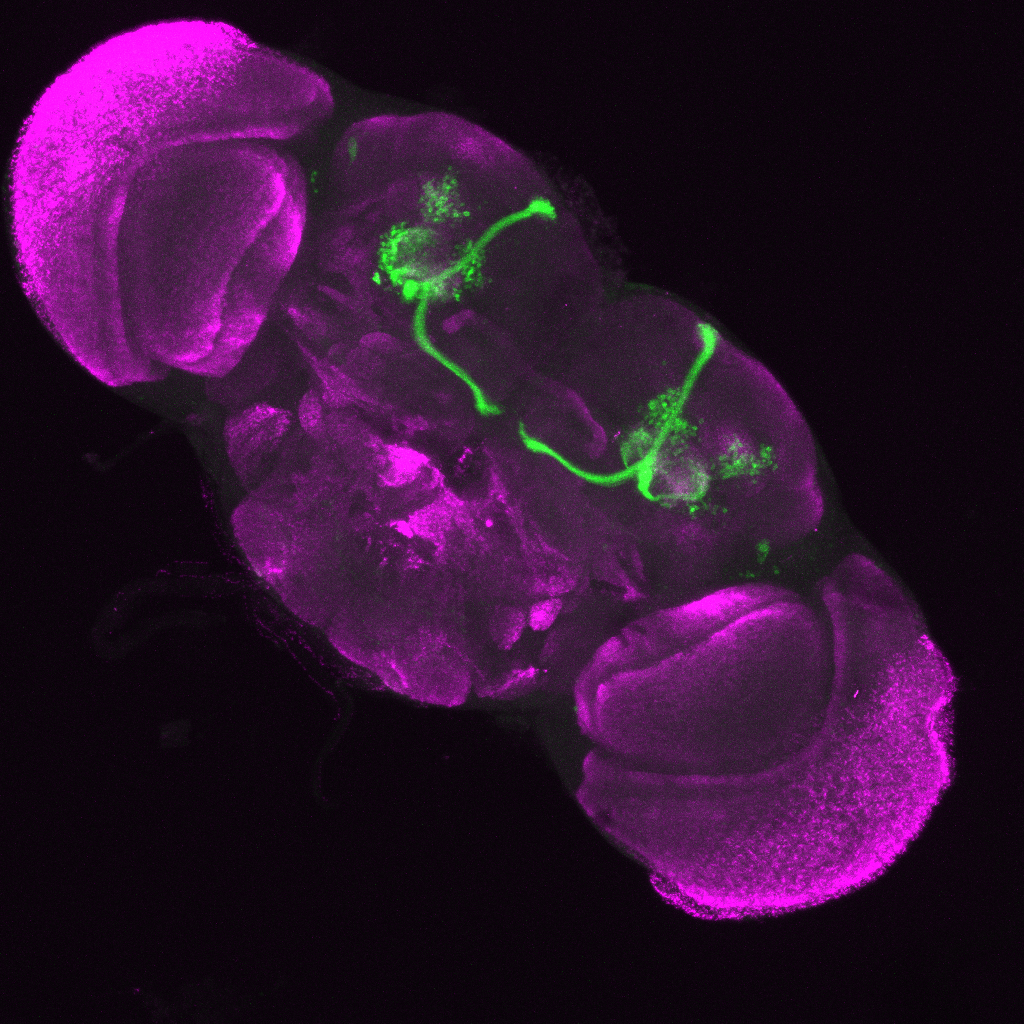
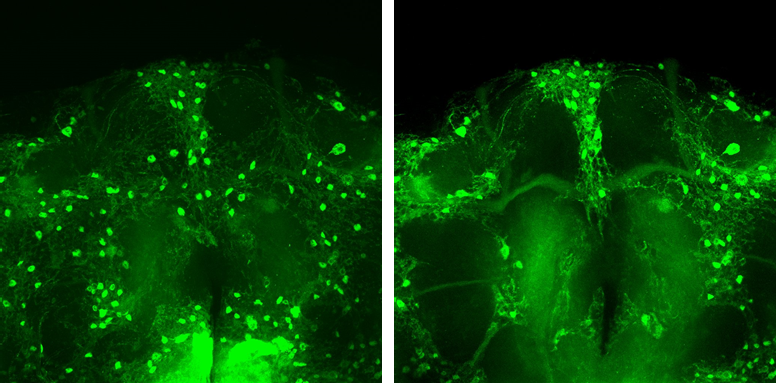
FoxP-KO
on Sunday, December 2nd, 2018 3:27 | by Ottavia Palazzo
FoxP-KO
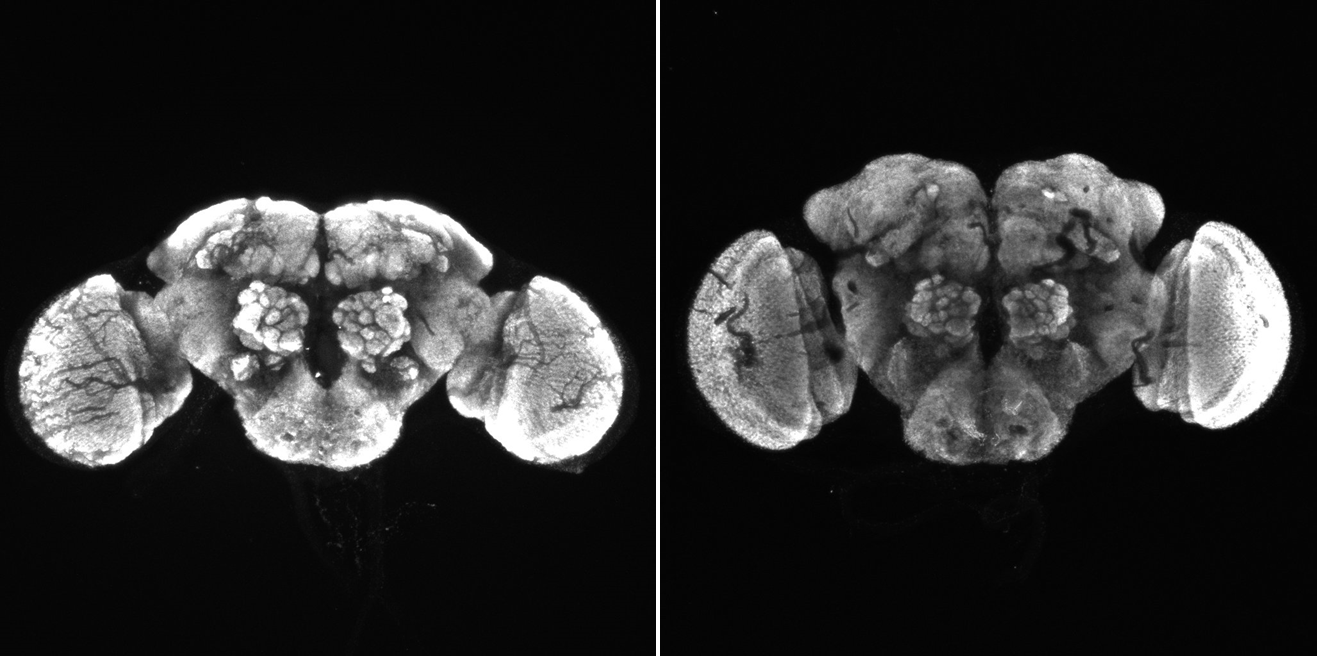
WT (from random papers)

Category: Anatomy, Foxp | No Comments
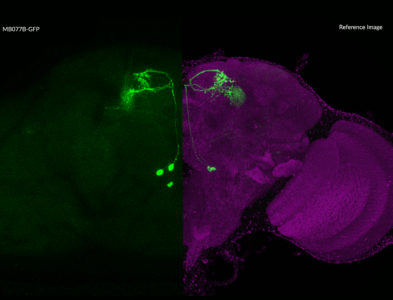
Control experiments for GFP expression of MBON lines
on Monday, October 29th, 2018 2:38 | by Anders Eriksson
MB057B
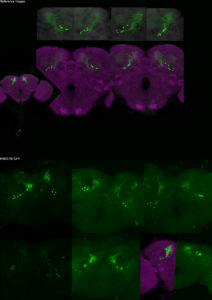
MB077B
Category: Anatomy, crosses, genetics | No Comments
17d-GFP with Bruchtpilot staining
on Monday, October 8th, 2018 2:32 | by Anders Eriksson
Adult brain

Adult ventral nerve cord
Category: Anatomy, crosses, genetics | No Comments
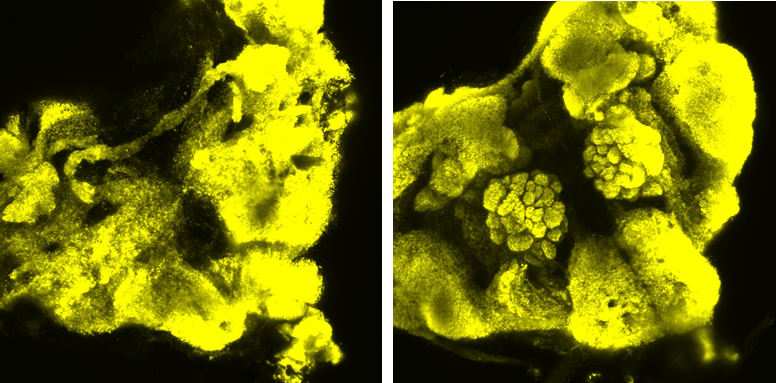
63x picture of 2 of the FoxPB-Gal4 positive clusters
on Sunday, October 7th, 2018 6:11 | by Ottavia Palazzo
The dorsal cluster neurons are really evident and with a typical organization


From Hassam et al., 2000
Category: Anatomy, Foxp | No Comments
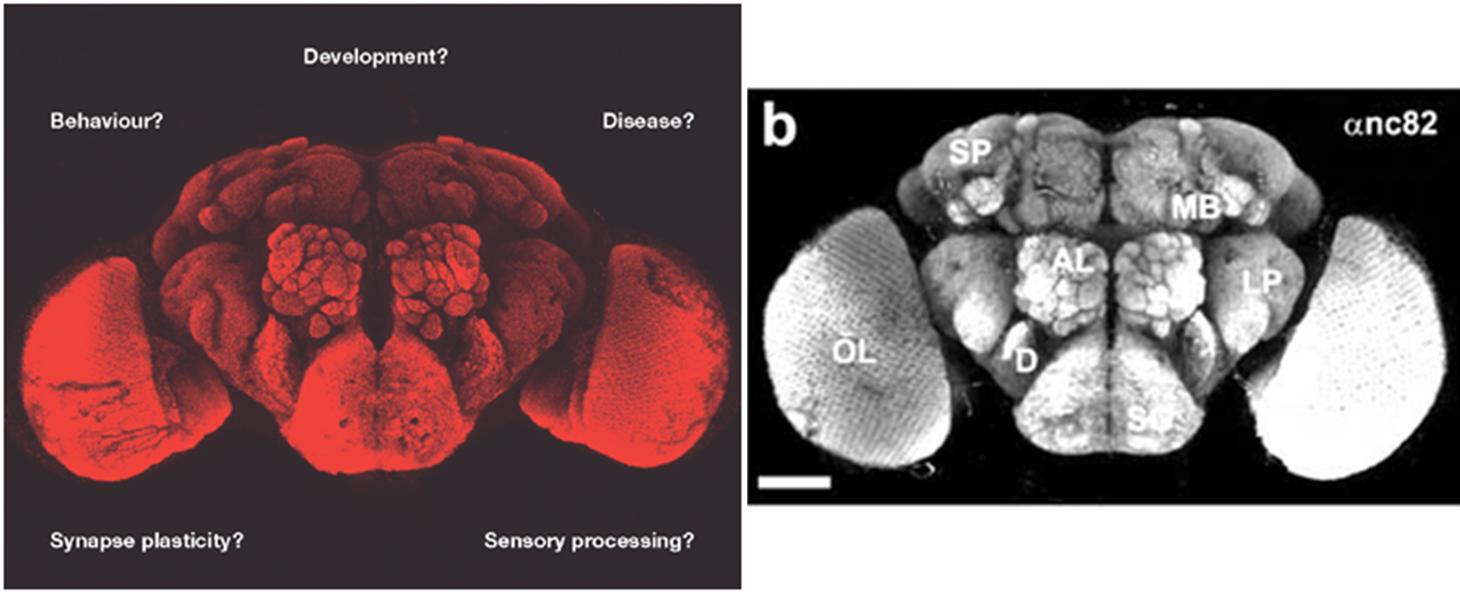
Protocerebral bridge in FoxP-KO flies
on Sunday, October 7th, 2018 6:06 | by Ottavia Palazzo
The more brains I see, the more I am convinced that the problem is not about my dissection
Category: Anatomy, Foxp | No Comments
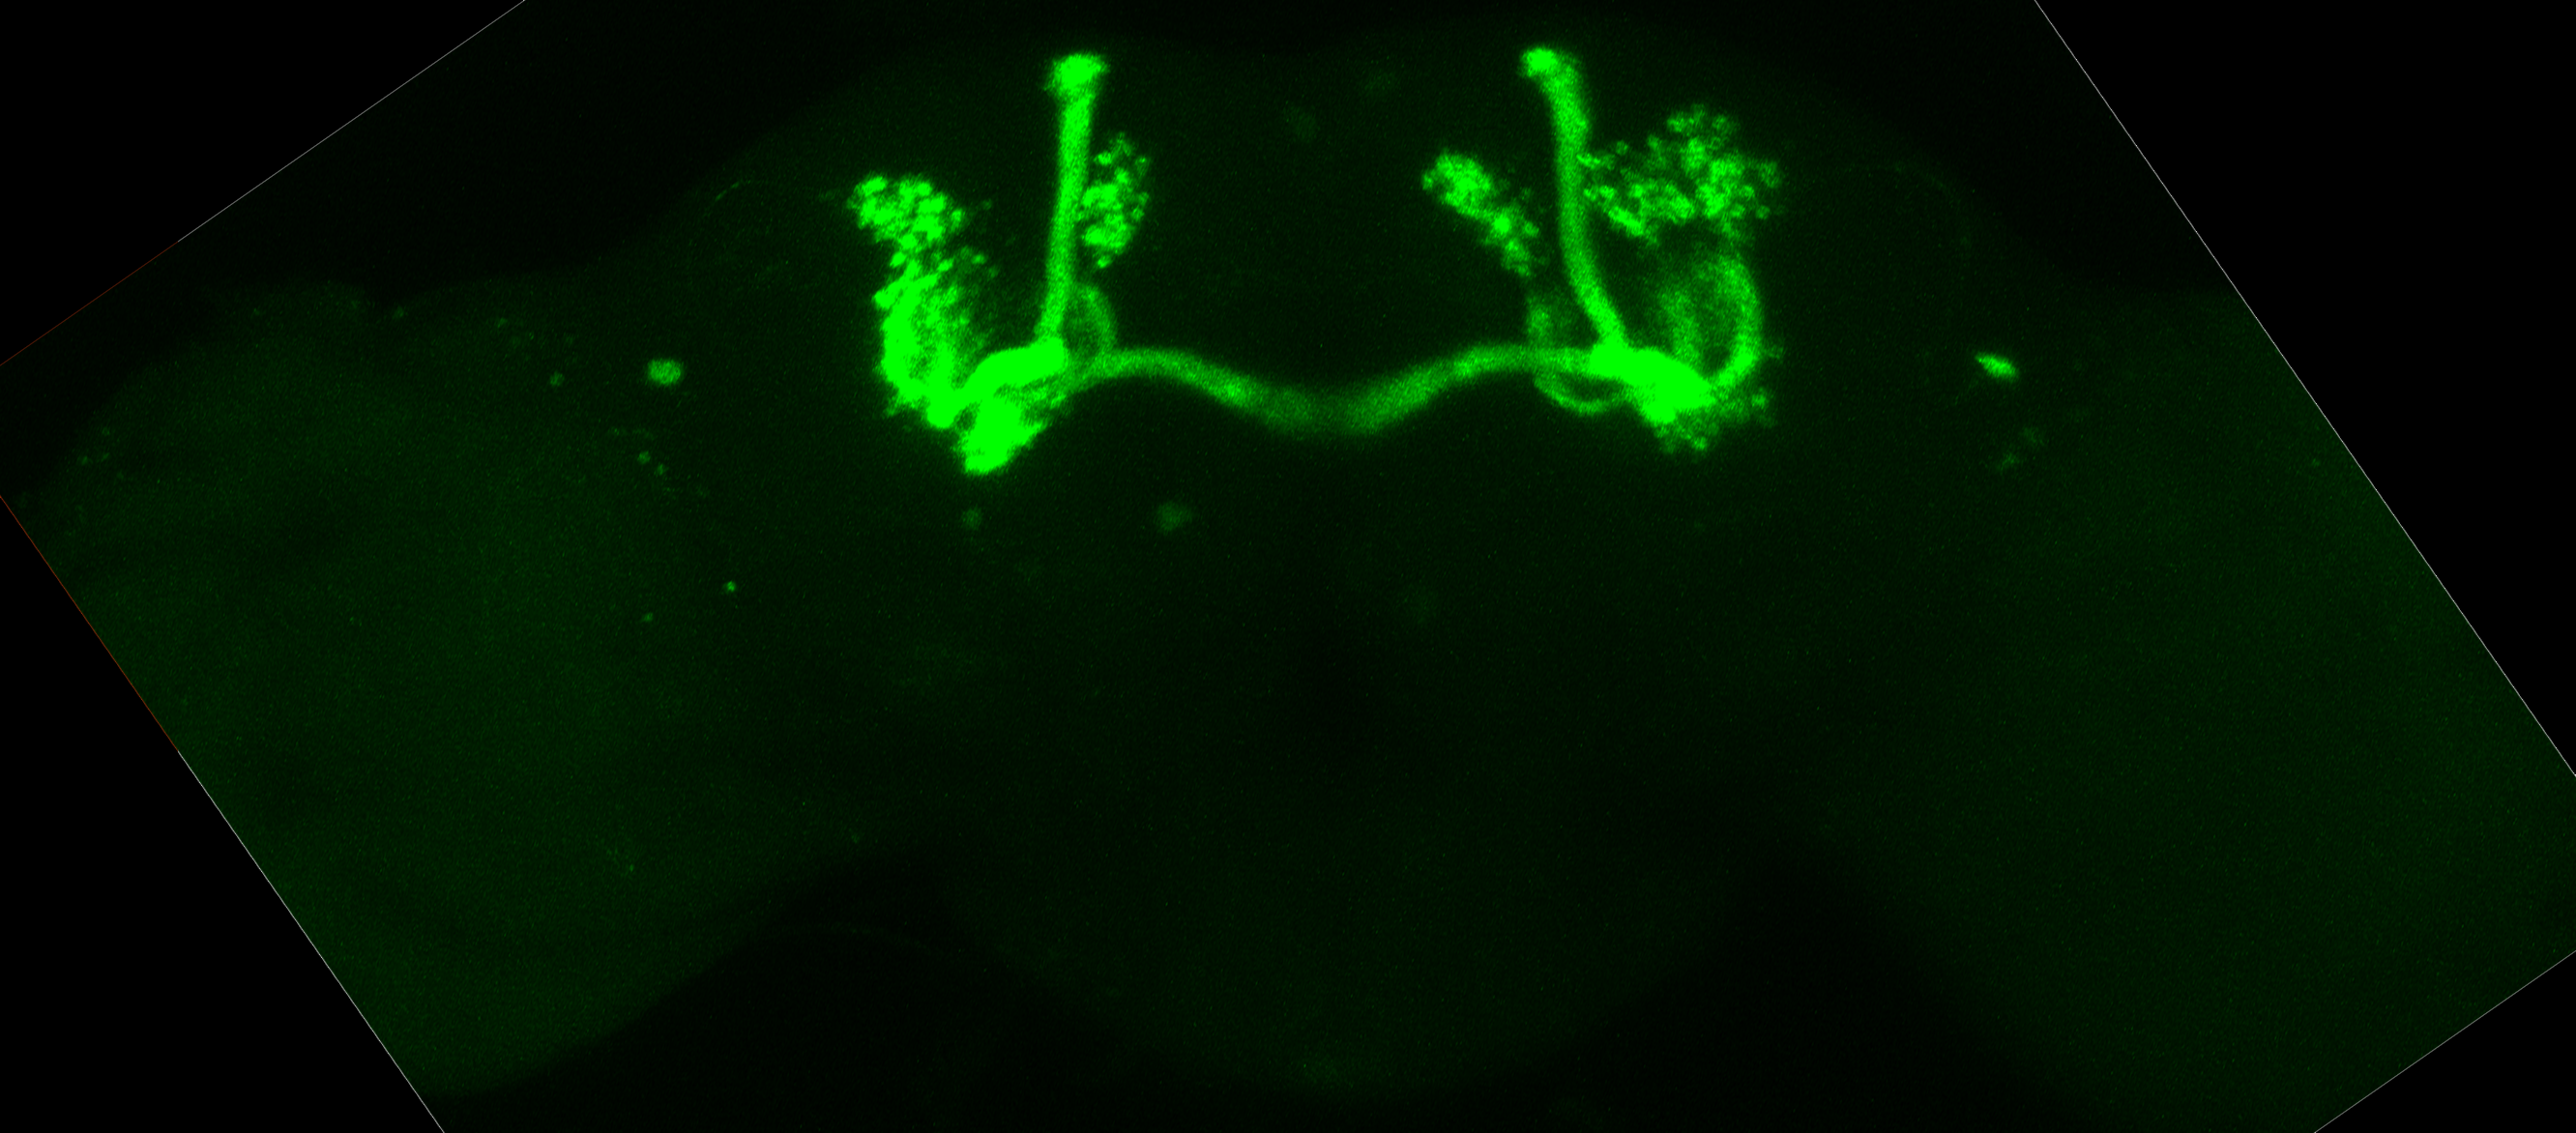
MB in FoxPB-Gal4 with GFP on the 2nd chromosome (homozigous)
on Sunday, October 7th, 2018 6:03 | by Ottavia Palazzo
this result is still to be verified by deleting the red fluorescent eyes to the flies
Category: Anatomy, Foxp | No Comments
17d-GFP
on Monday, October 1st, 2018 2:37 | by Anders Eriksson
Category: Anatomy, crosses, genetics, Lab | No Comments
17d
on Monday, September 10th, 2018 1:03 | by Anders Eriksson
Been working on 17d for the past month.
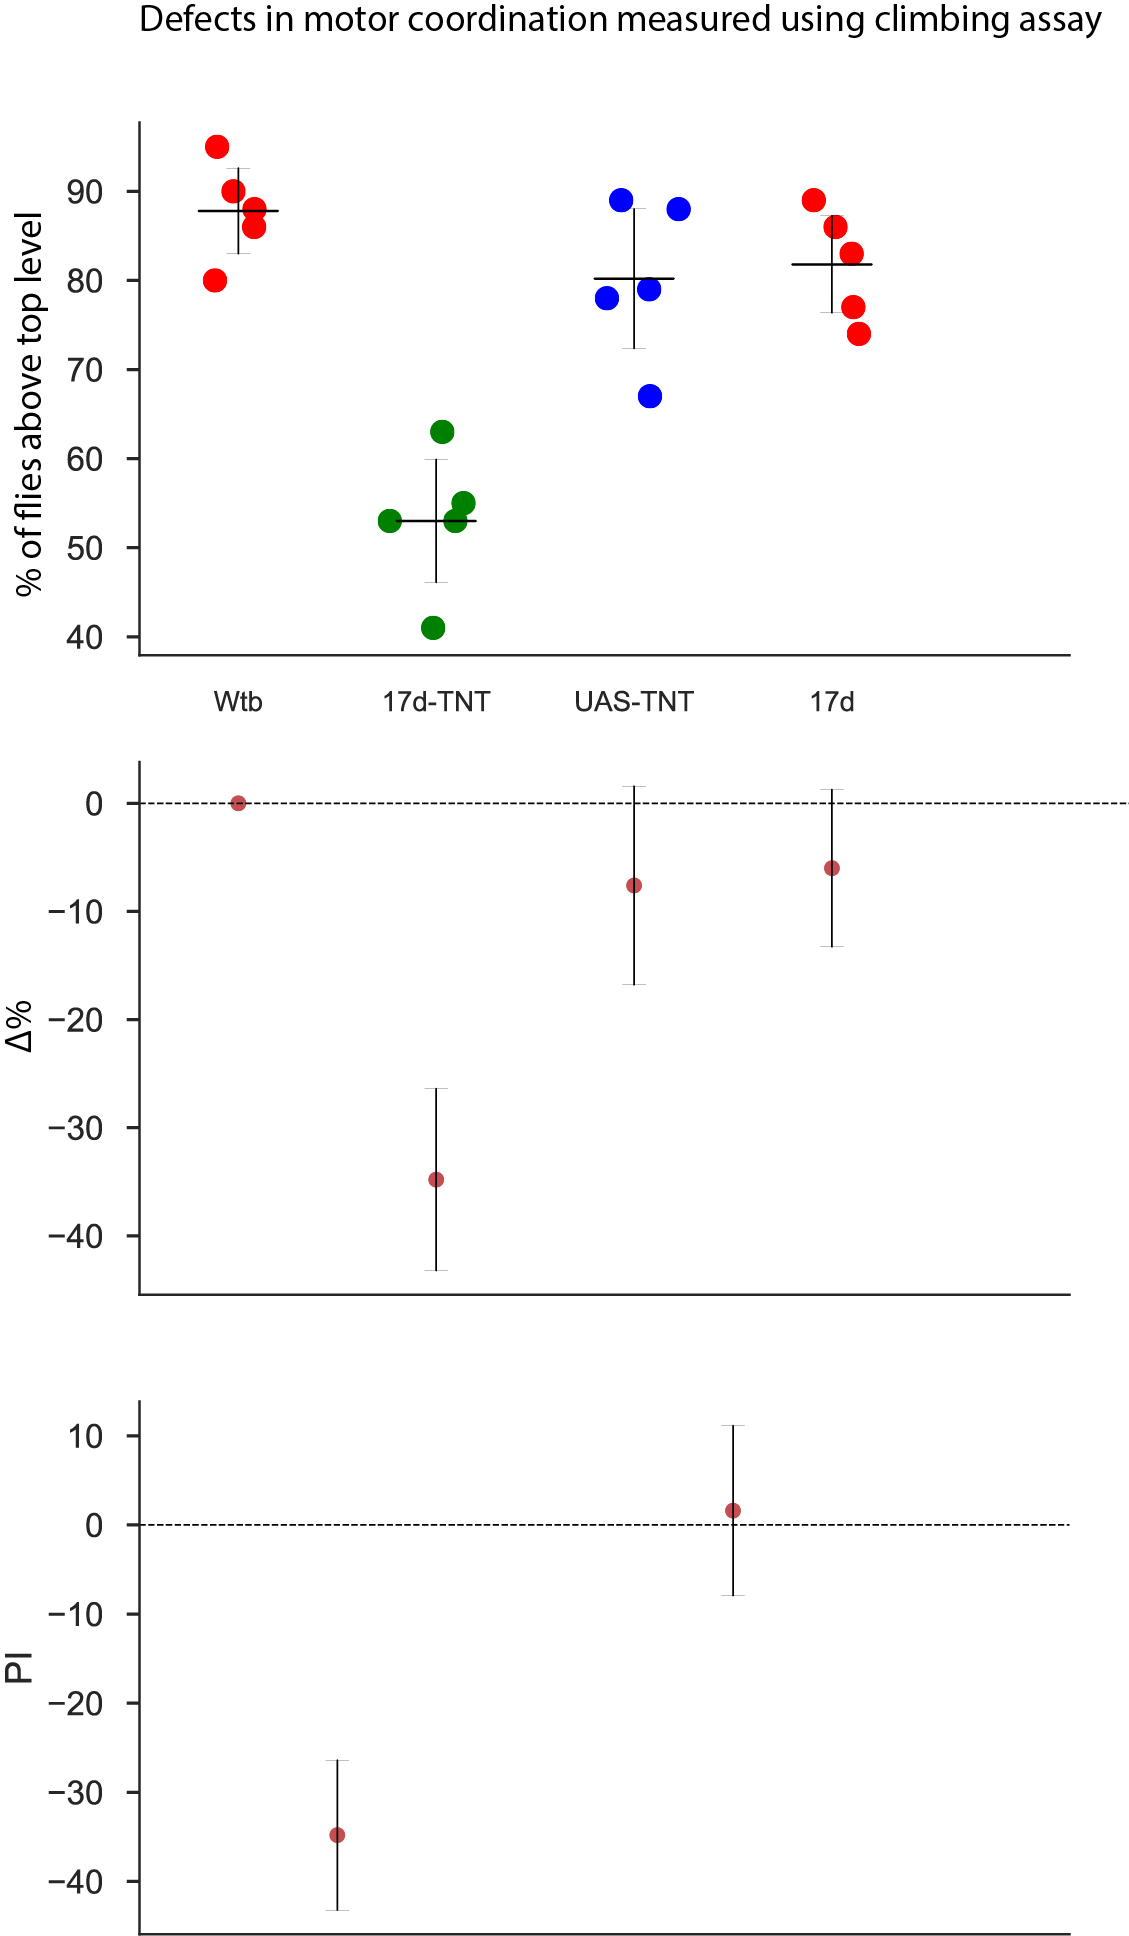
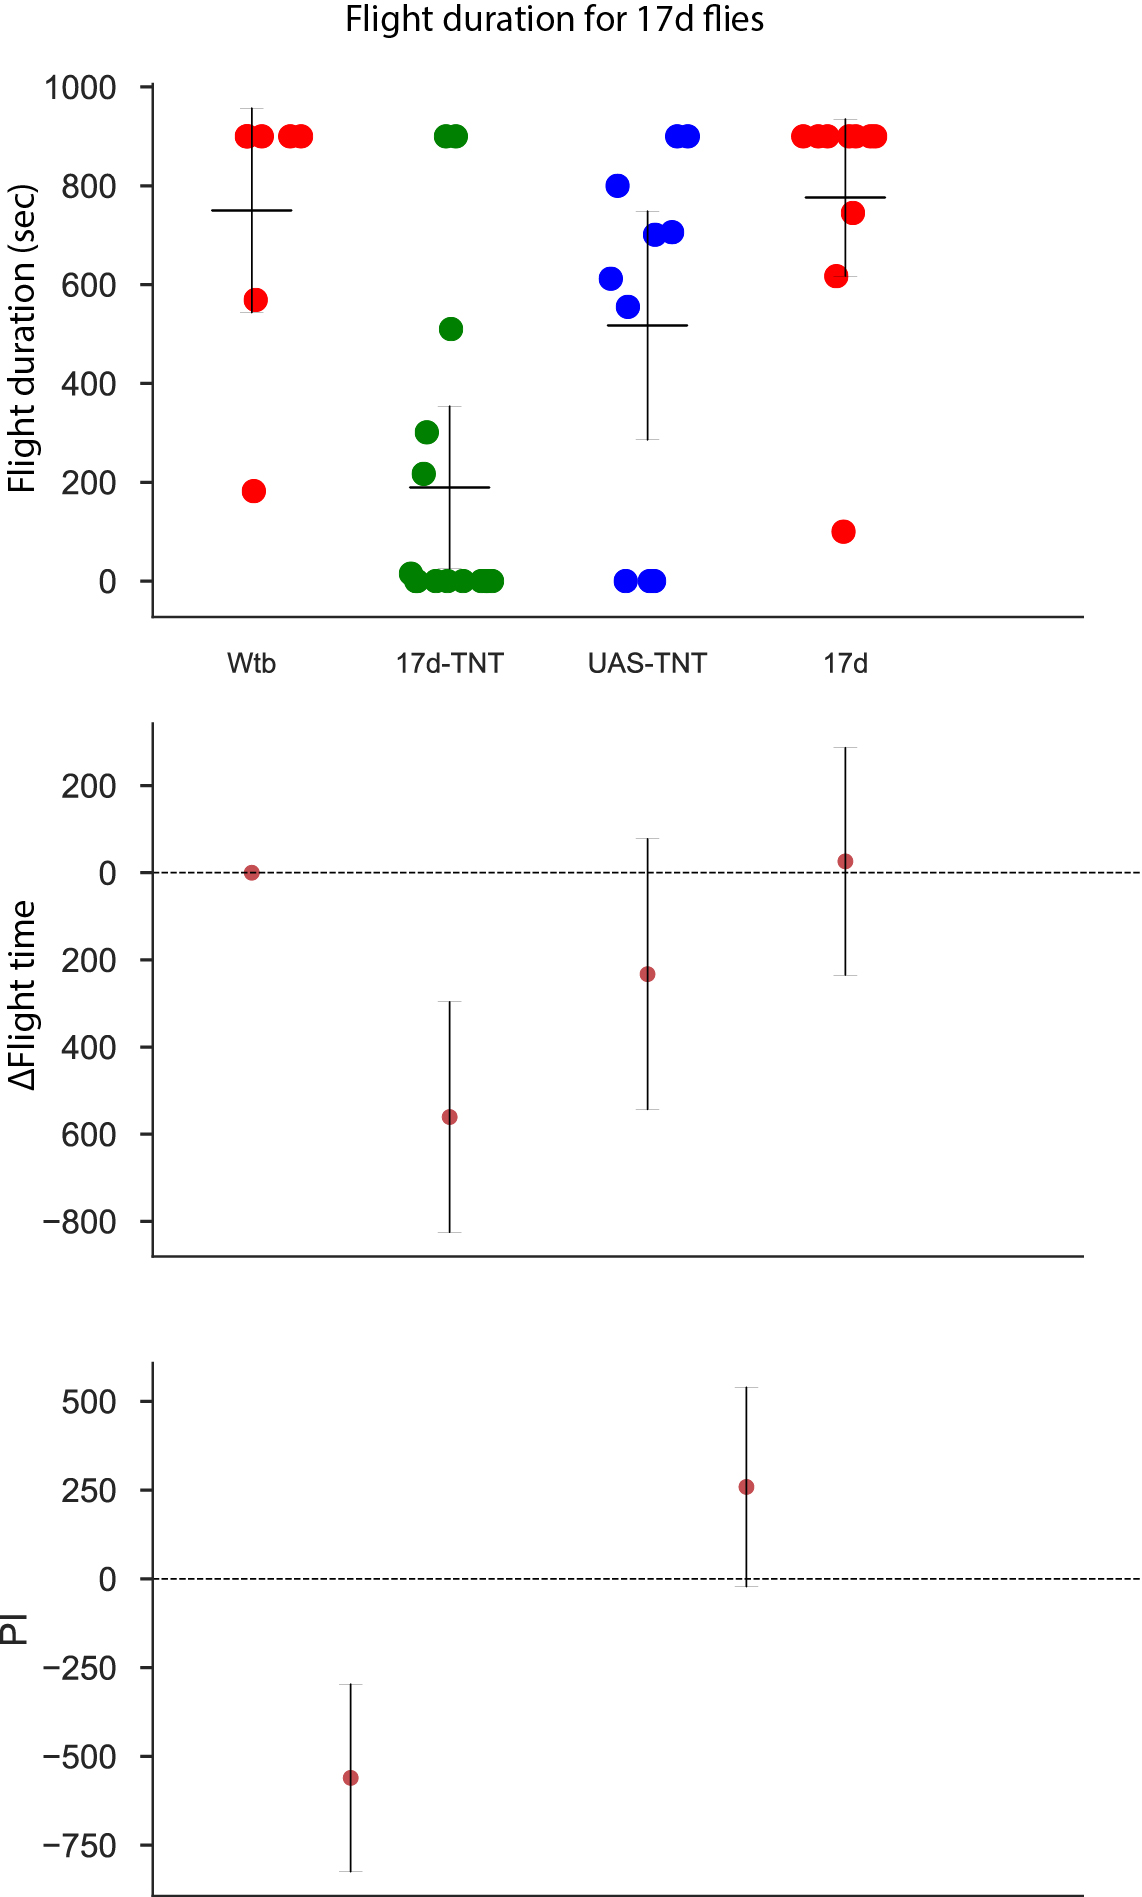
The experiments in the flight simulator. Self-learning performance indices in a two-minute test with the heat switched off after 4 and 8 minutes of training, indicated impairment of 17d-TNT flies.

The flies also showed clear impairments in their flight performance. To quantify this I assessed both possible alterations in their motor coordination (using climbing assay) as well as flight performance. The climbing assay relies on walking rather than flying. Both experiments show reduced ability of motor coordination and flight performance.
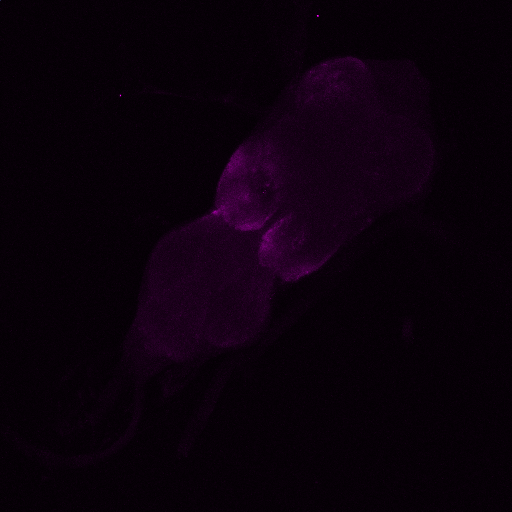
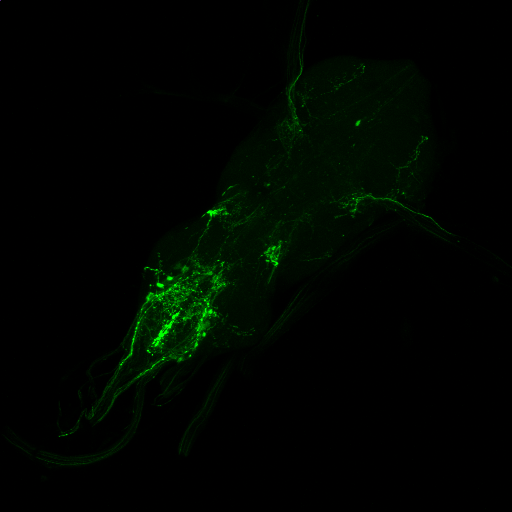
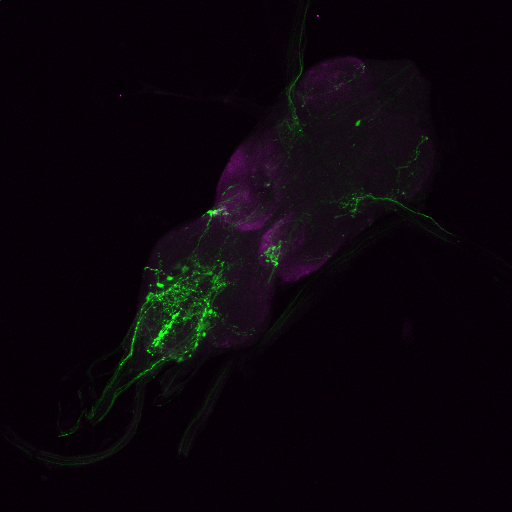
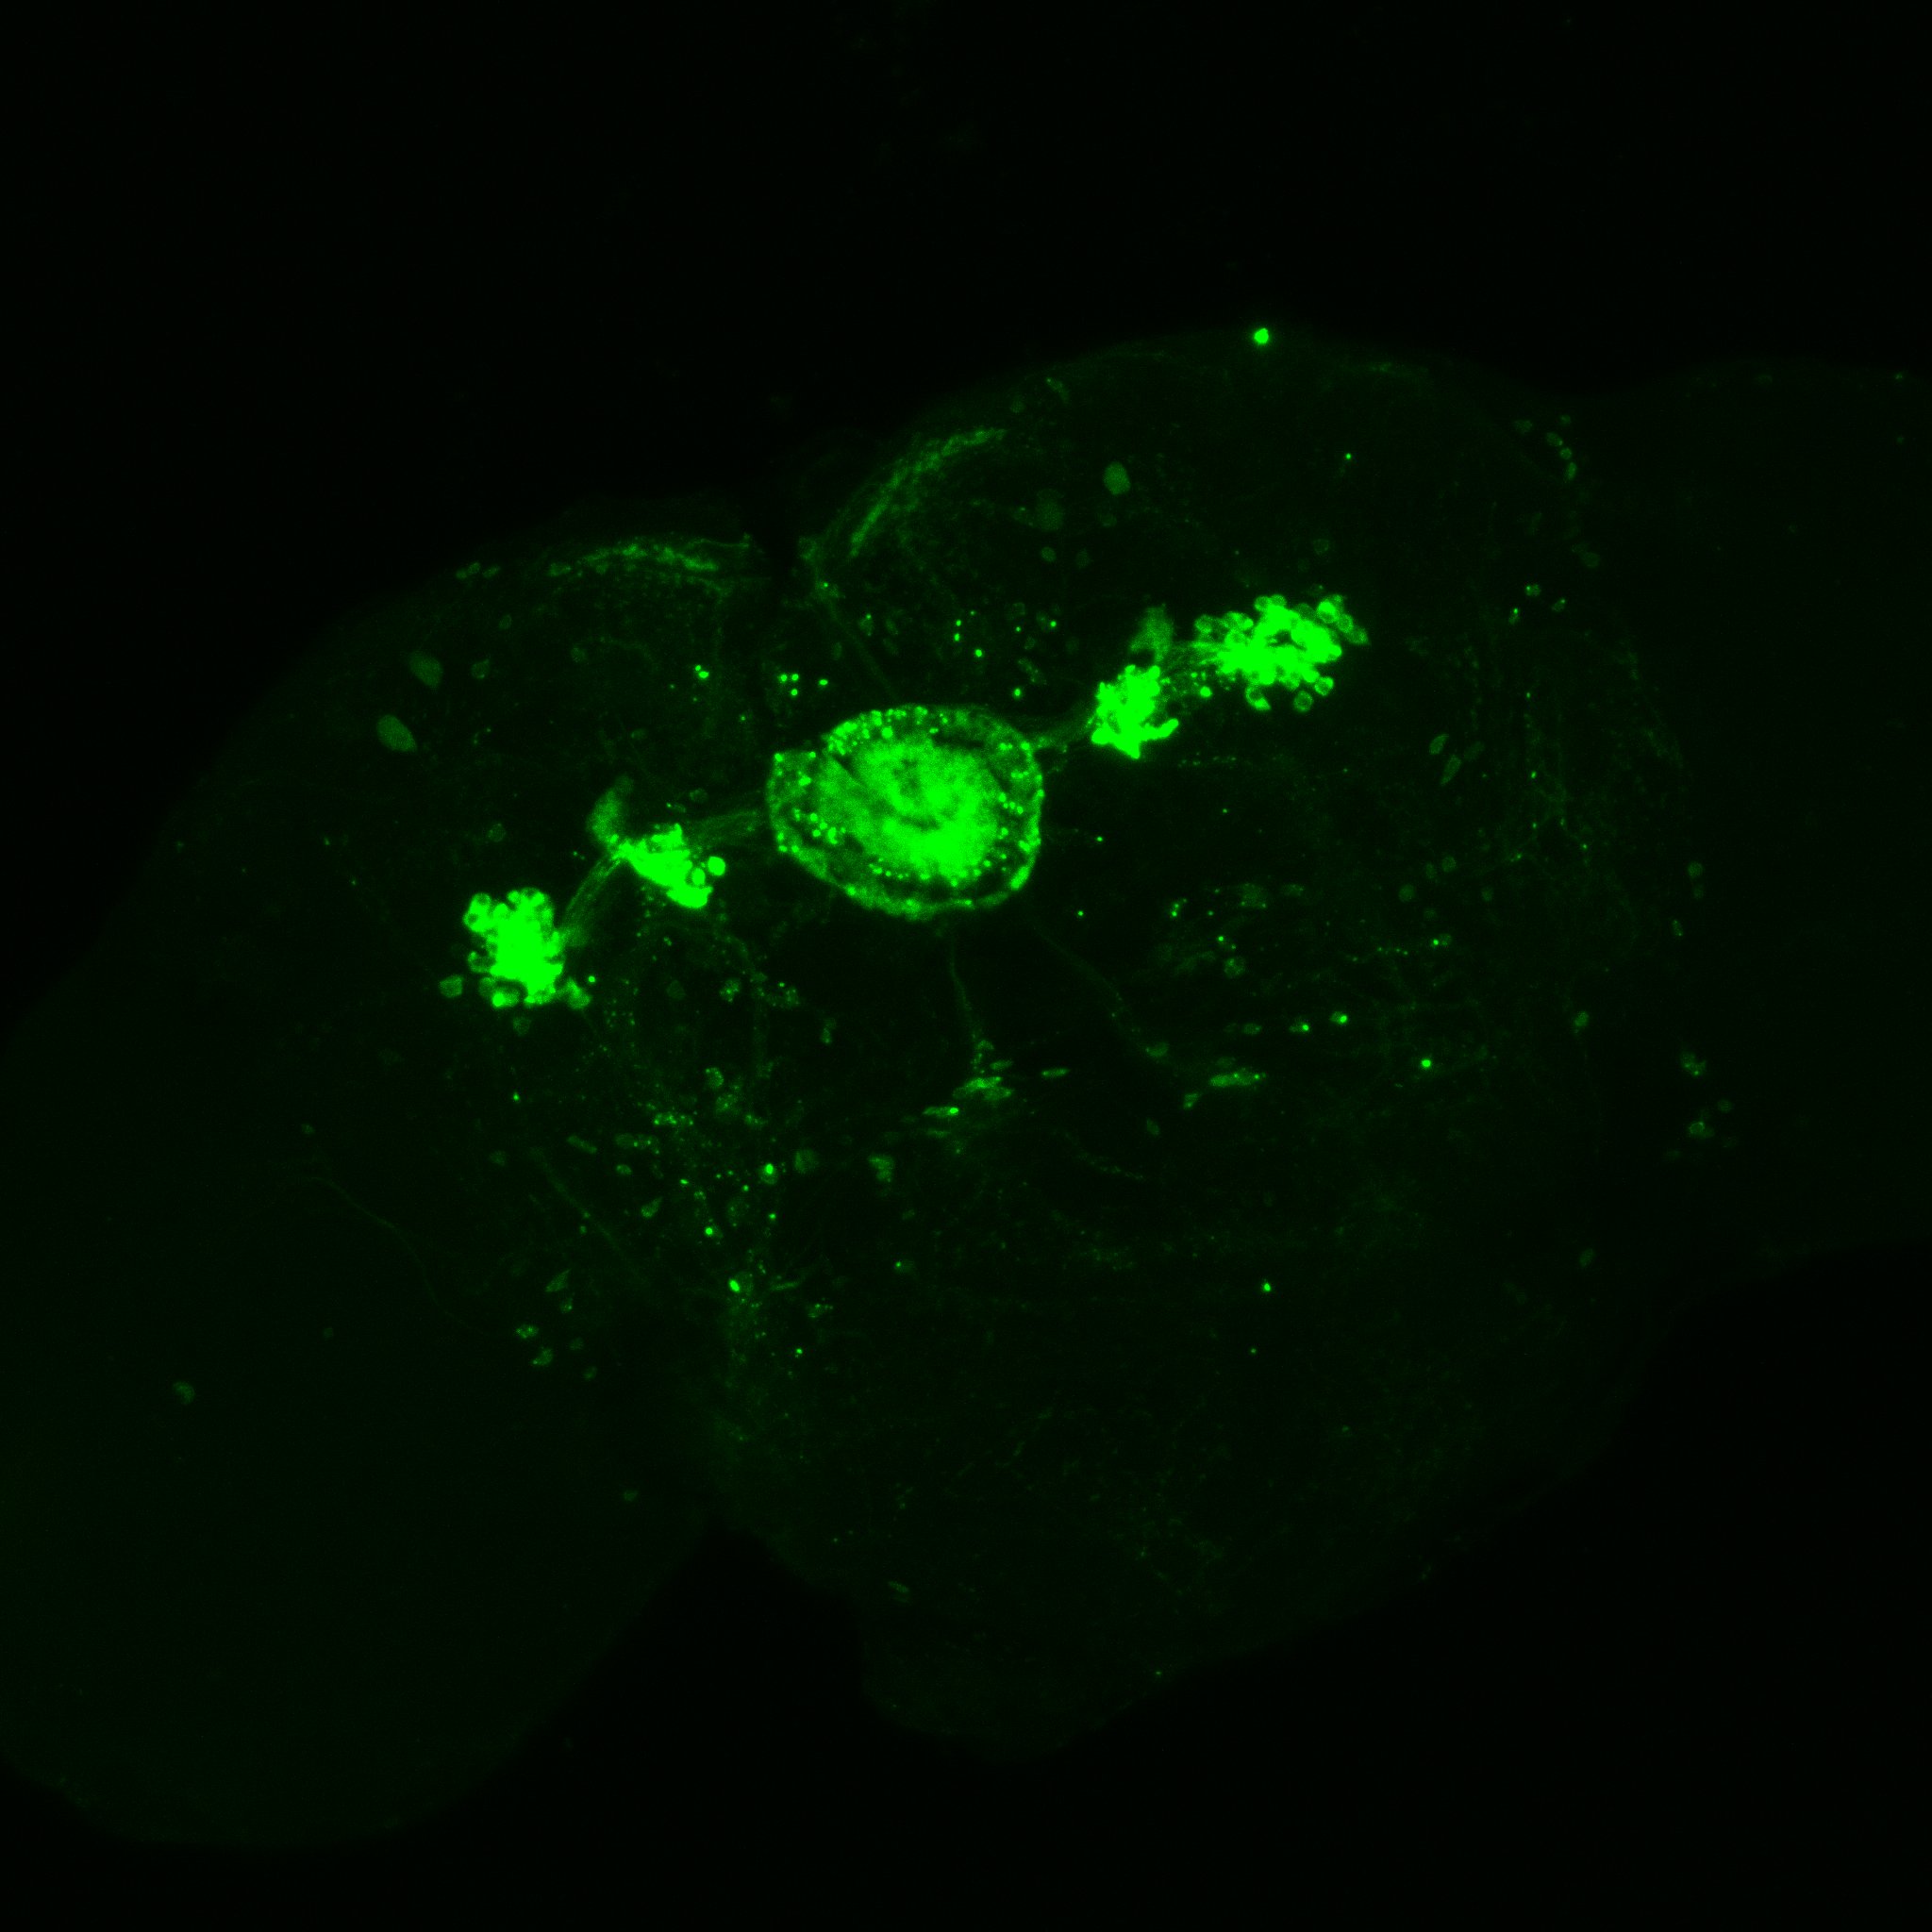
To confirm the specificity of the 17d-Gal4 fly I used the trans-tango flies.
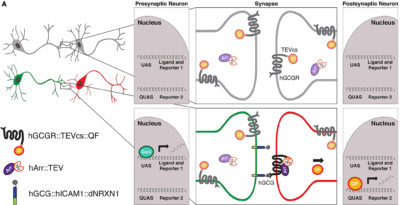
Neuron, 96 (2017) 783-799. doi:10.1016/j.neuron.2017.10.011
![]()
The trans-tango is notorious for having a low expression in adult flies, which was also observed by me. The image is taking without any GFP-antibody.
Category: Anatomy, crosses, flight, genetics, Memory, operant self-learning | No Comments
TH-D’ regions of interest
on Tuesday, August 21st, 2018 2:50 | by Christian Rohrsen
These are all the graphs I could fetch from other articles referring to TH-D’ expression.
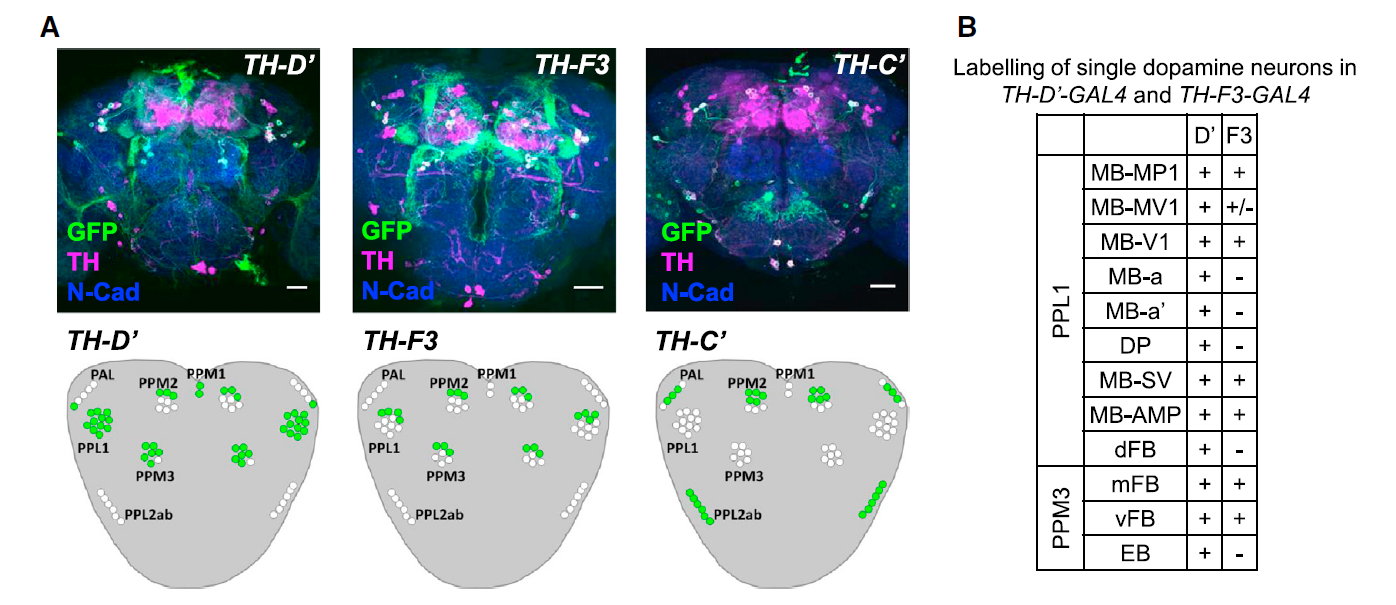
from Galili et al. 2014:
from the table in B, the expression of TH-D’-G4 is different from TH-F3-G4 in PPL1 regions projecting to alpha and alpha’ as well to dorsal Fan Shaped Body (dFB) and DP. I would not focus on the alpha projections into the Mushroom bodies (MB), because the other G4s targeting the alpha lobes did not yield any effect.
In PPM3 only is different the projection to the ellipsoid body (EB). In addition from graph A, PPM1 and PAL regions are stained by TH-D’ but might not be targeted by the other drivers shown.
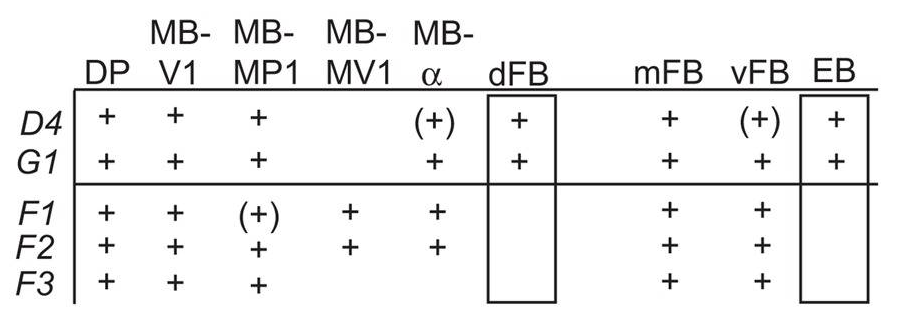
from Liu et al. 2012:
We see that other drivers that were also tested in our screen (like TH-D4 and TH-G1) also stain the PPL1->dFB, PPL1->DP and PPM3->EB. Since these two drivers did not have a phenotyp,e we might not attribute the effect of TH-D’ because of these projections.
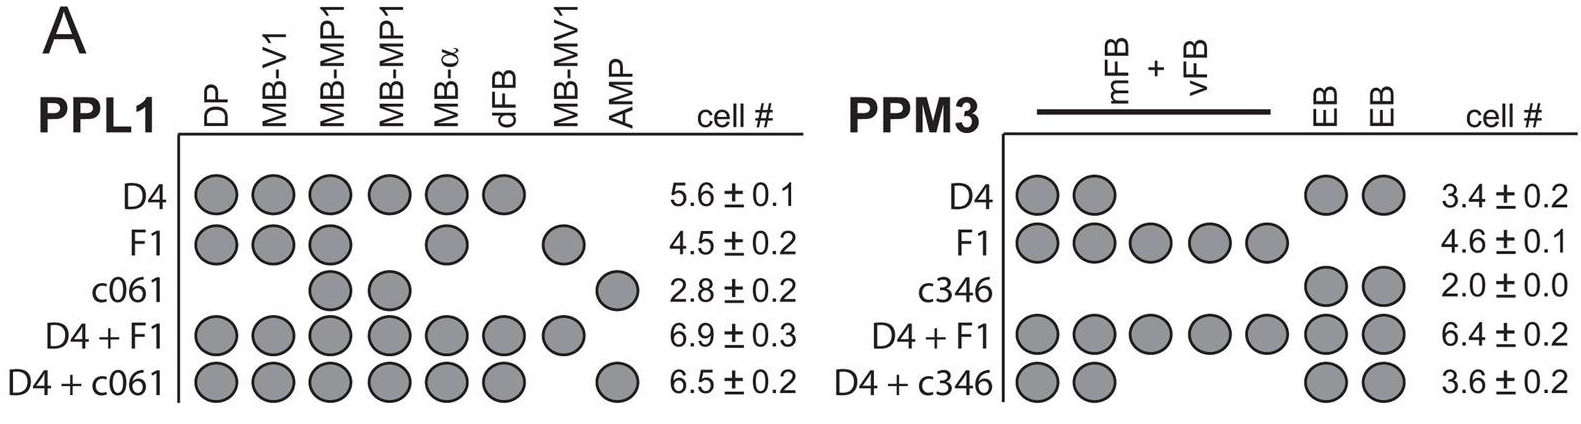
From Pathak et al. 2015:
We have a different pattern where they do not describe expression in regions like PPM2, PPM1 or PAL. They point out the expression in PPM3 and PPL1 but we already discarded these regions as the ones involved in reinforcement in the graphs above in this post. They also observed expression in PPL2, which might be a region also stained by TH-G4, TH-D1 and TH-C’, but we do not know how they overlap. A few TH+ neurons in the ventral ganglia are also targeted by TH-D’.
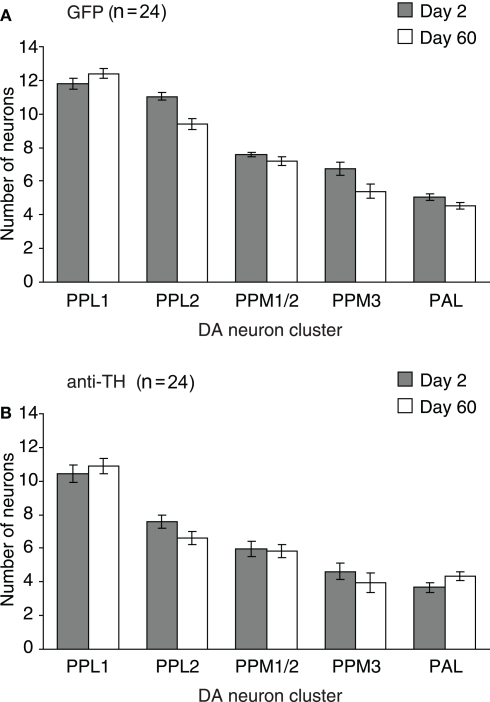
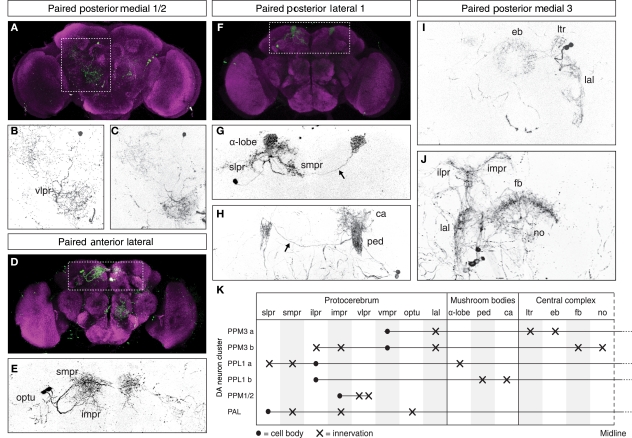
From White et al. 2011?:
We see more general dopaminergic anatomical properties, like the number of neurons in each dopaminergic cluster. In the second graph one can see where the PPL1, PPM3, PPM1/2 and PAL project to.
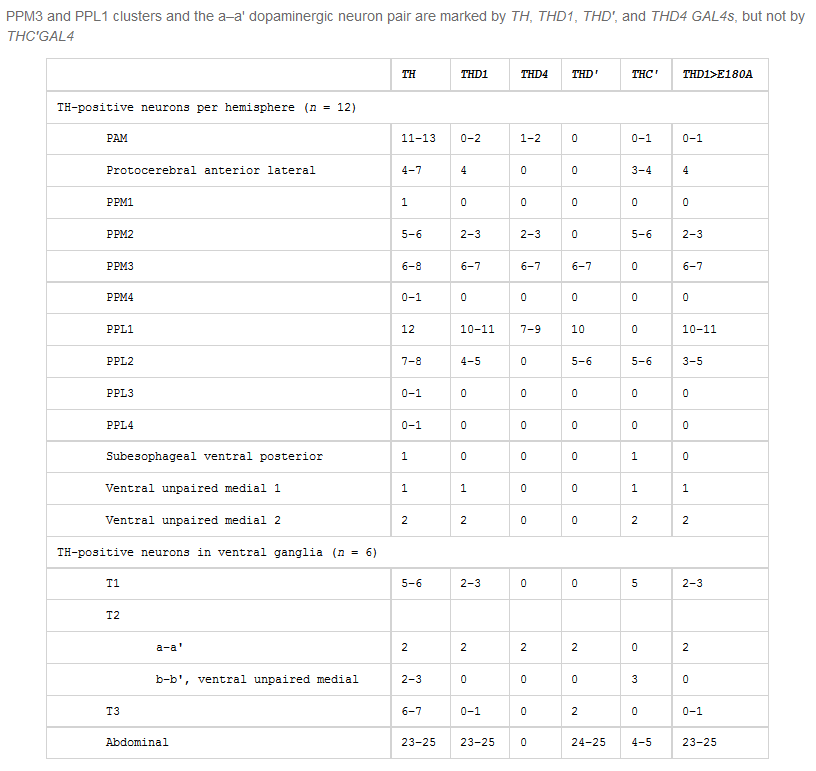
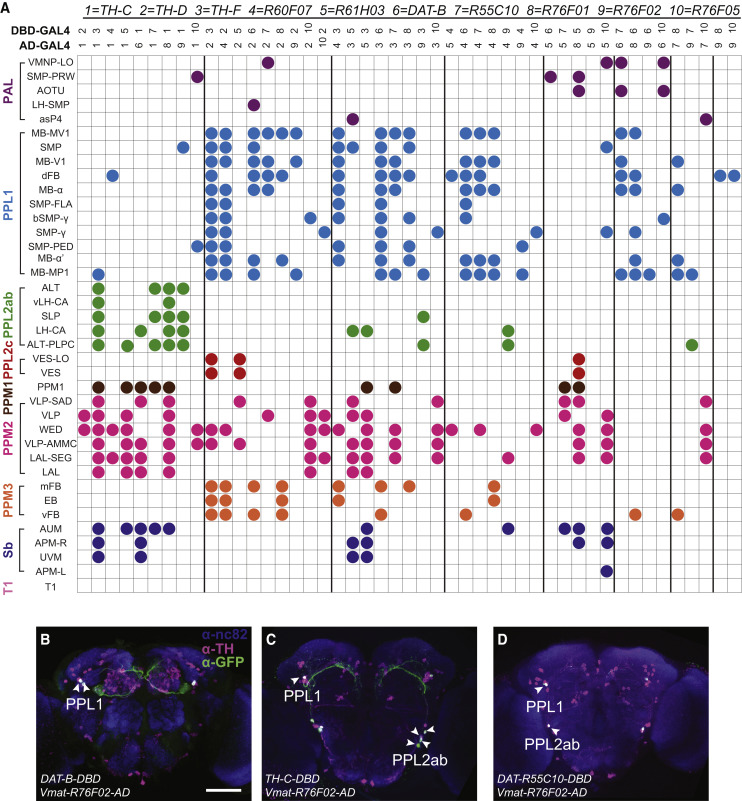
from Xie et al. 2018:
I would say that the only two interesting columns are 1&2 and 2&3 which finds common regions for TH-C vs TH-D and TH-D vs TH-F, respectively. The only conclusion I would take from the first is that a few PPM2 regions are discarded as interesting, and from the second that the whole PPL1 does not seem to have differential expression in TH-D’.
Category: Anatomy, neuronal activation, Operant reinforcment, Optogenetics | No Comments
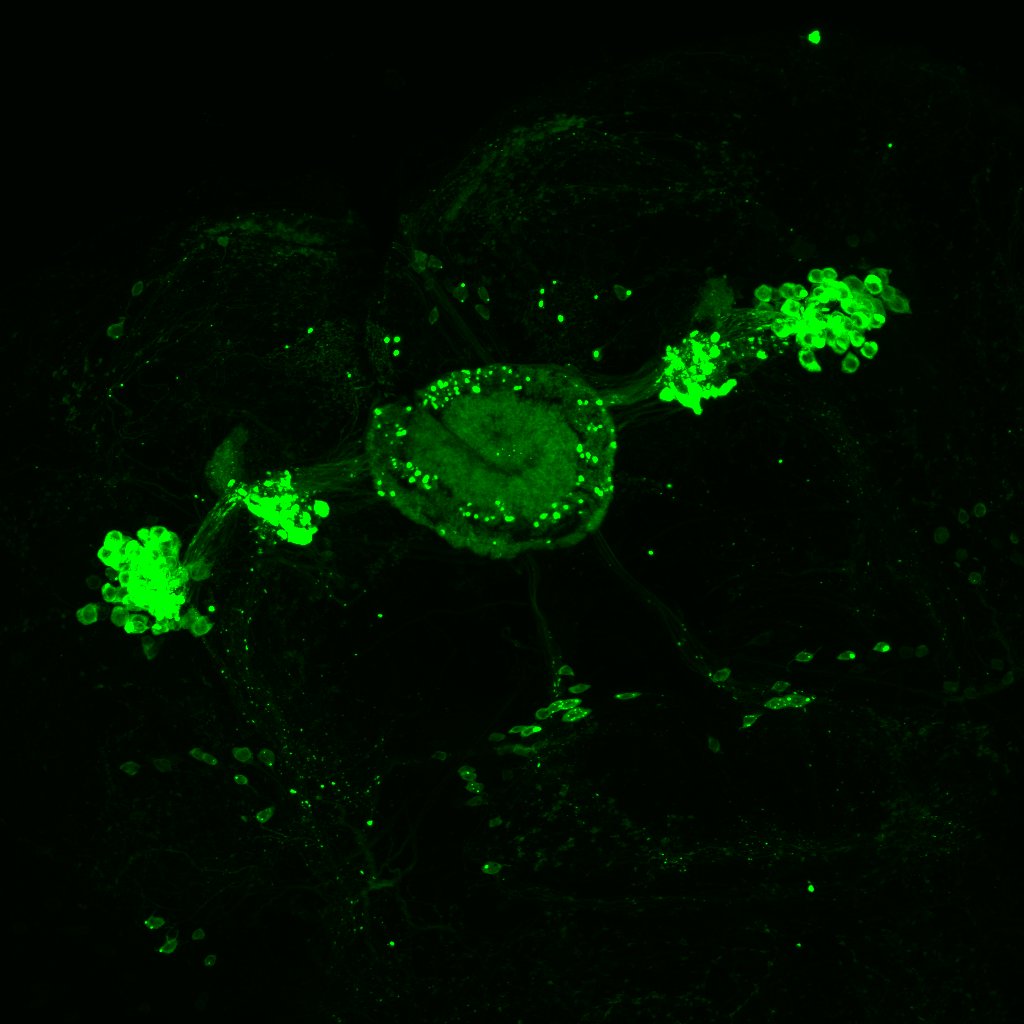
Confocal images and boxplots from my results in strokelitude
on Tuesday, May 15th, 2018 12:26 | by Christian Rohrsen
Confocal image MAX stack of one of the brains at 20x
and at 40x
In this link we have a video of a 3D stainning pattern zoomed_CC
In addition I add here teh boxplots from the final results of the Ping Pong ball setup with these experiments 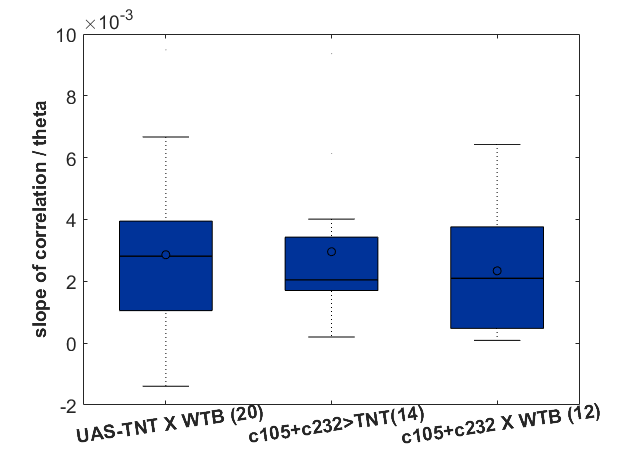
Category: Anatomy, flight, Spontaneous Behavior, strokelitude, WingStroke | No Comments