Side project
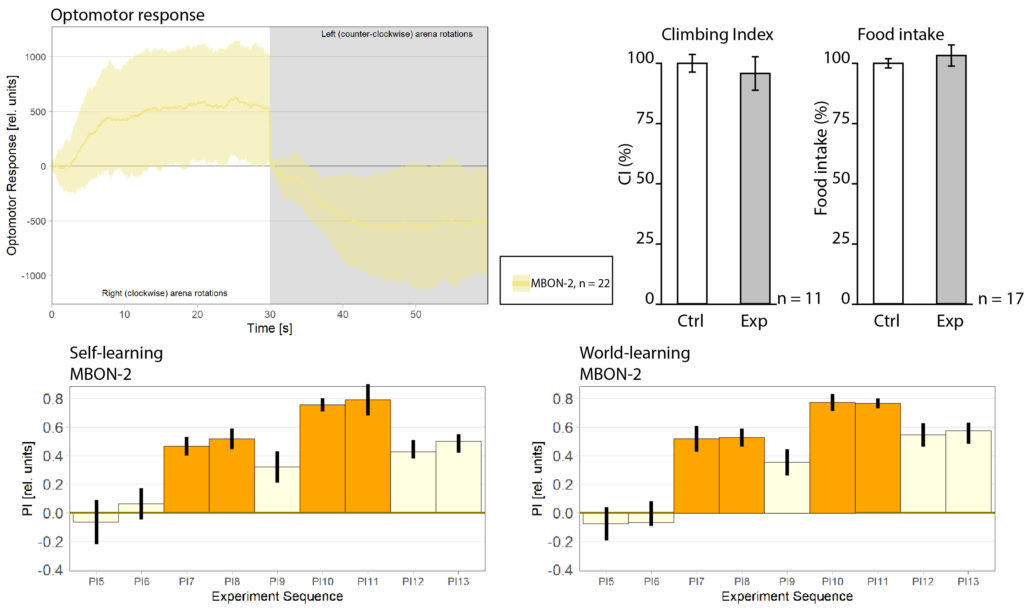
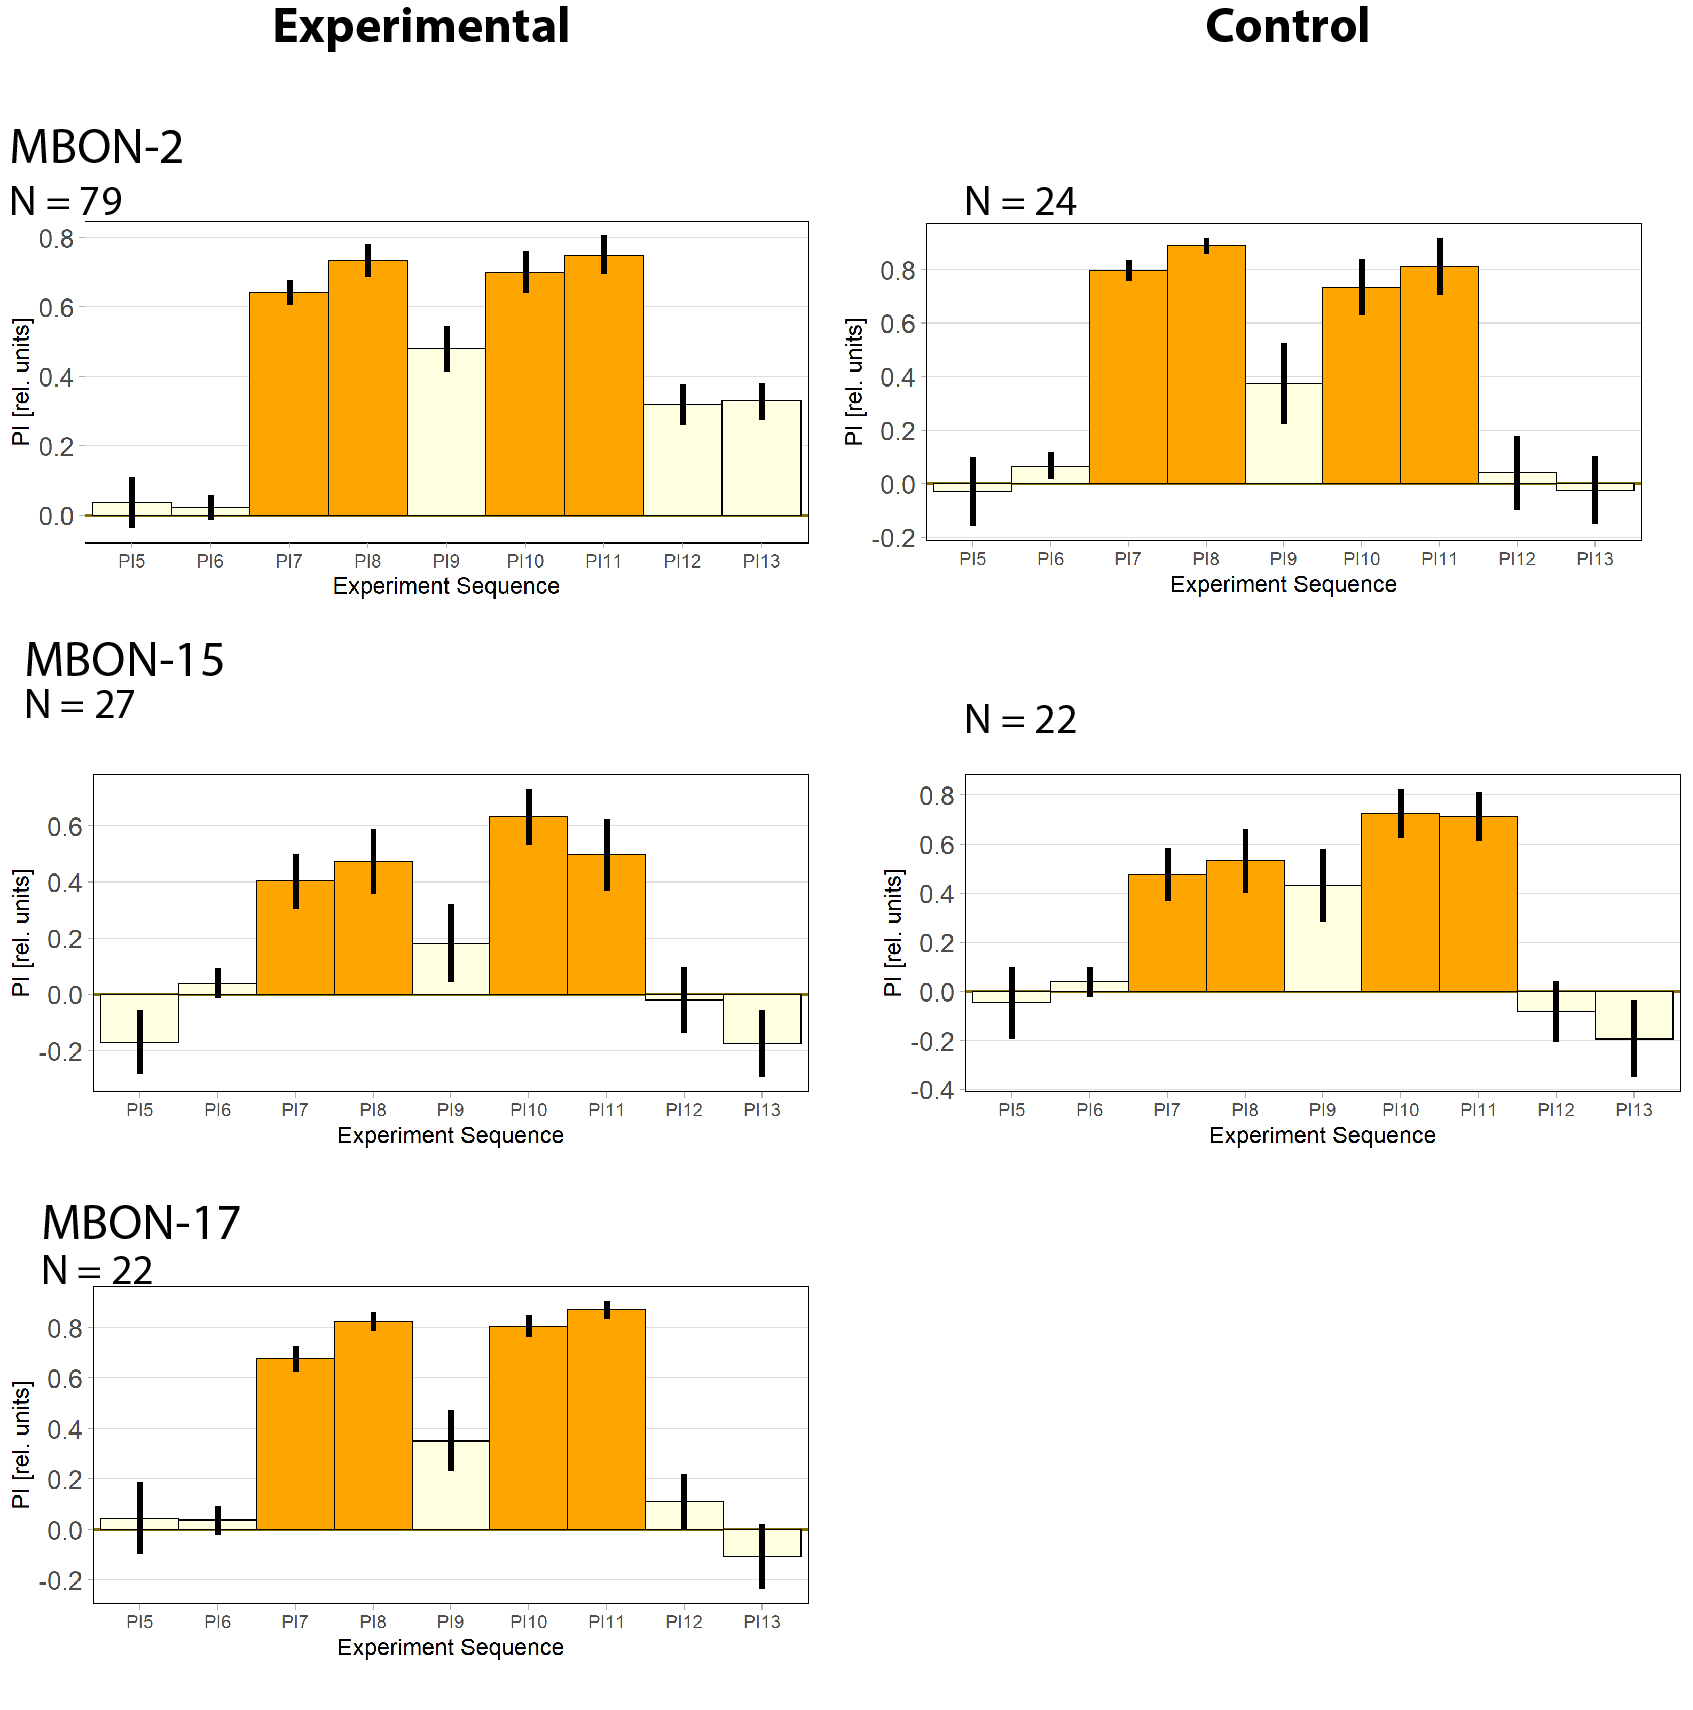
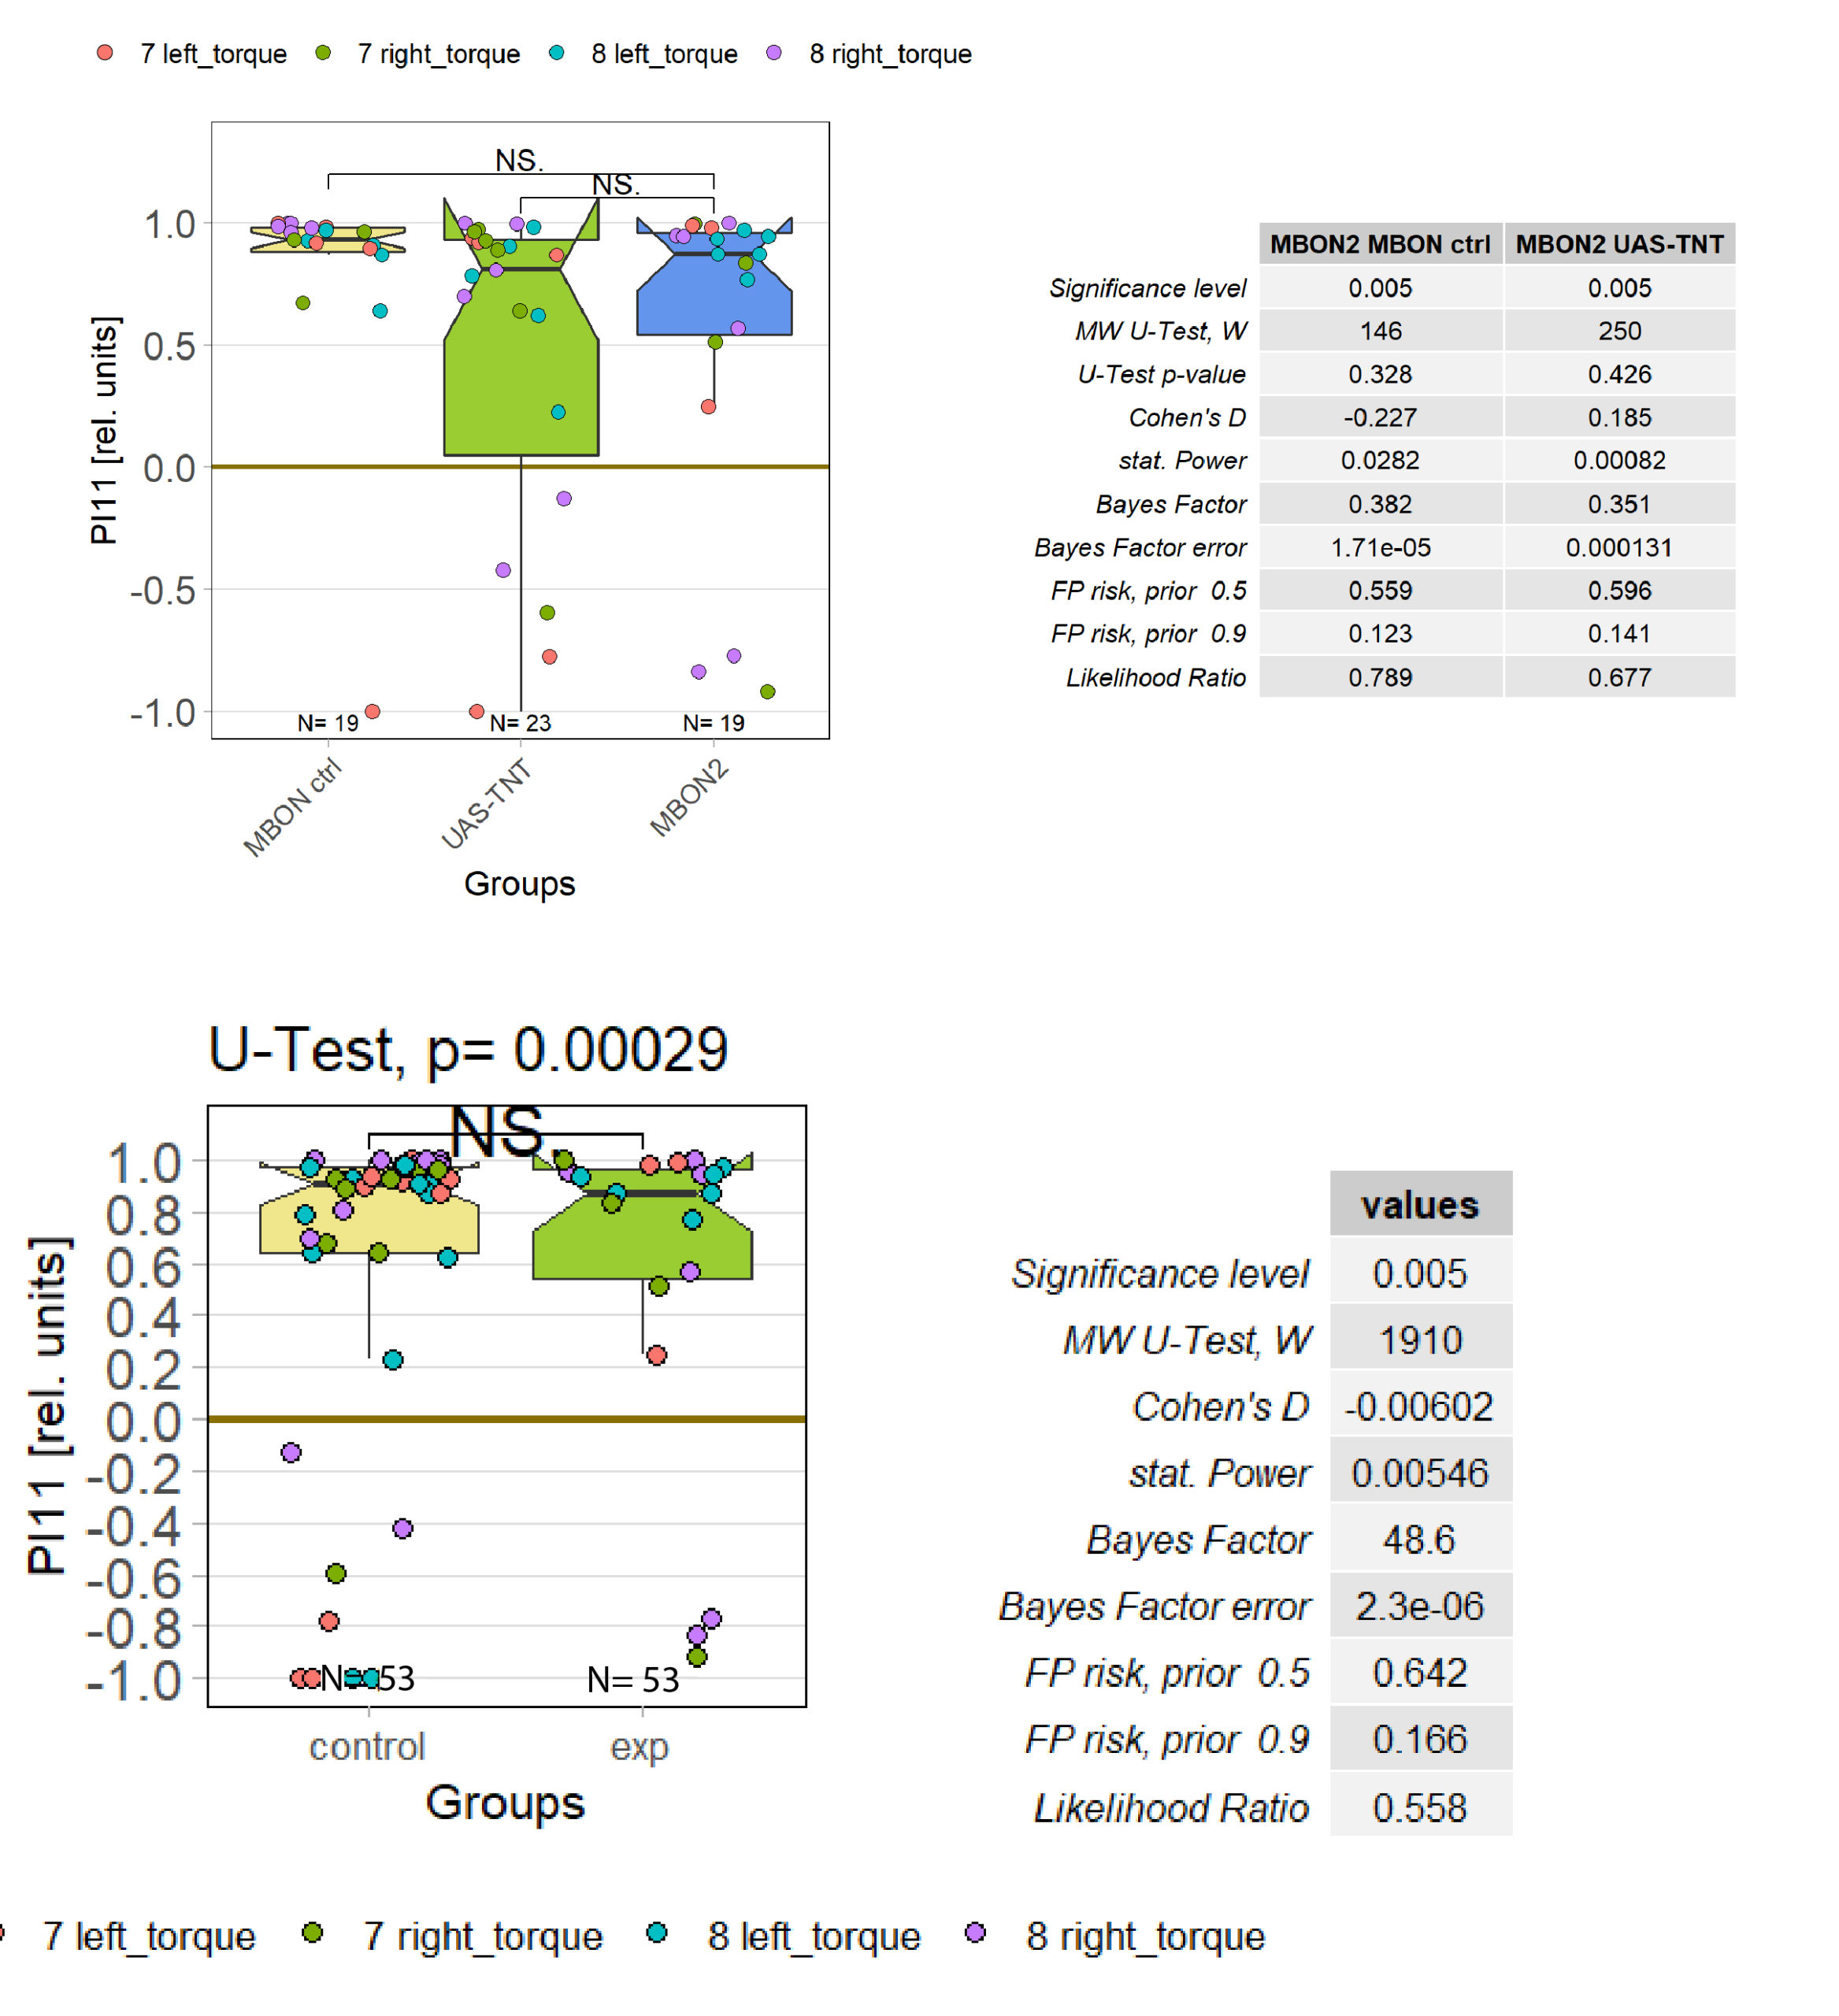
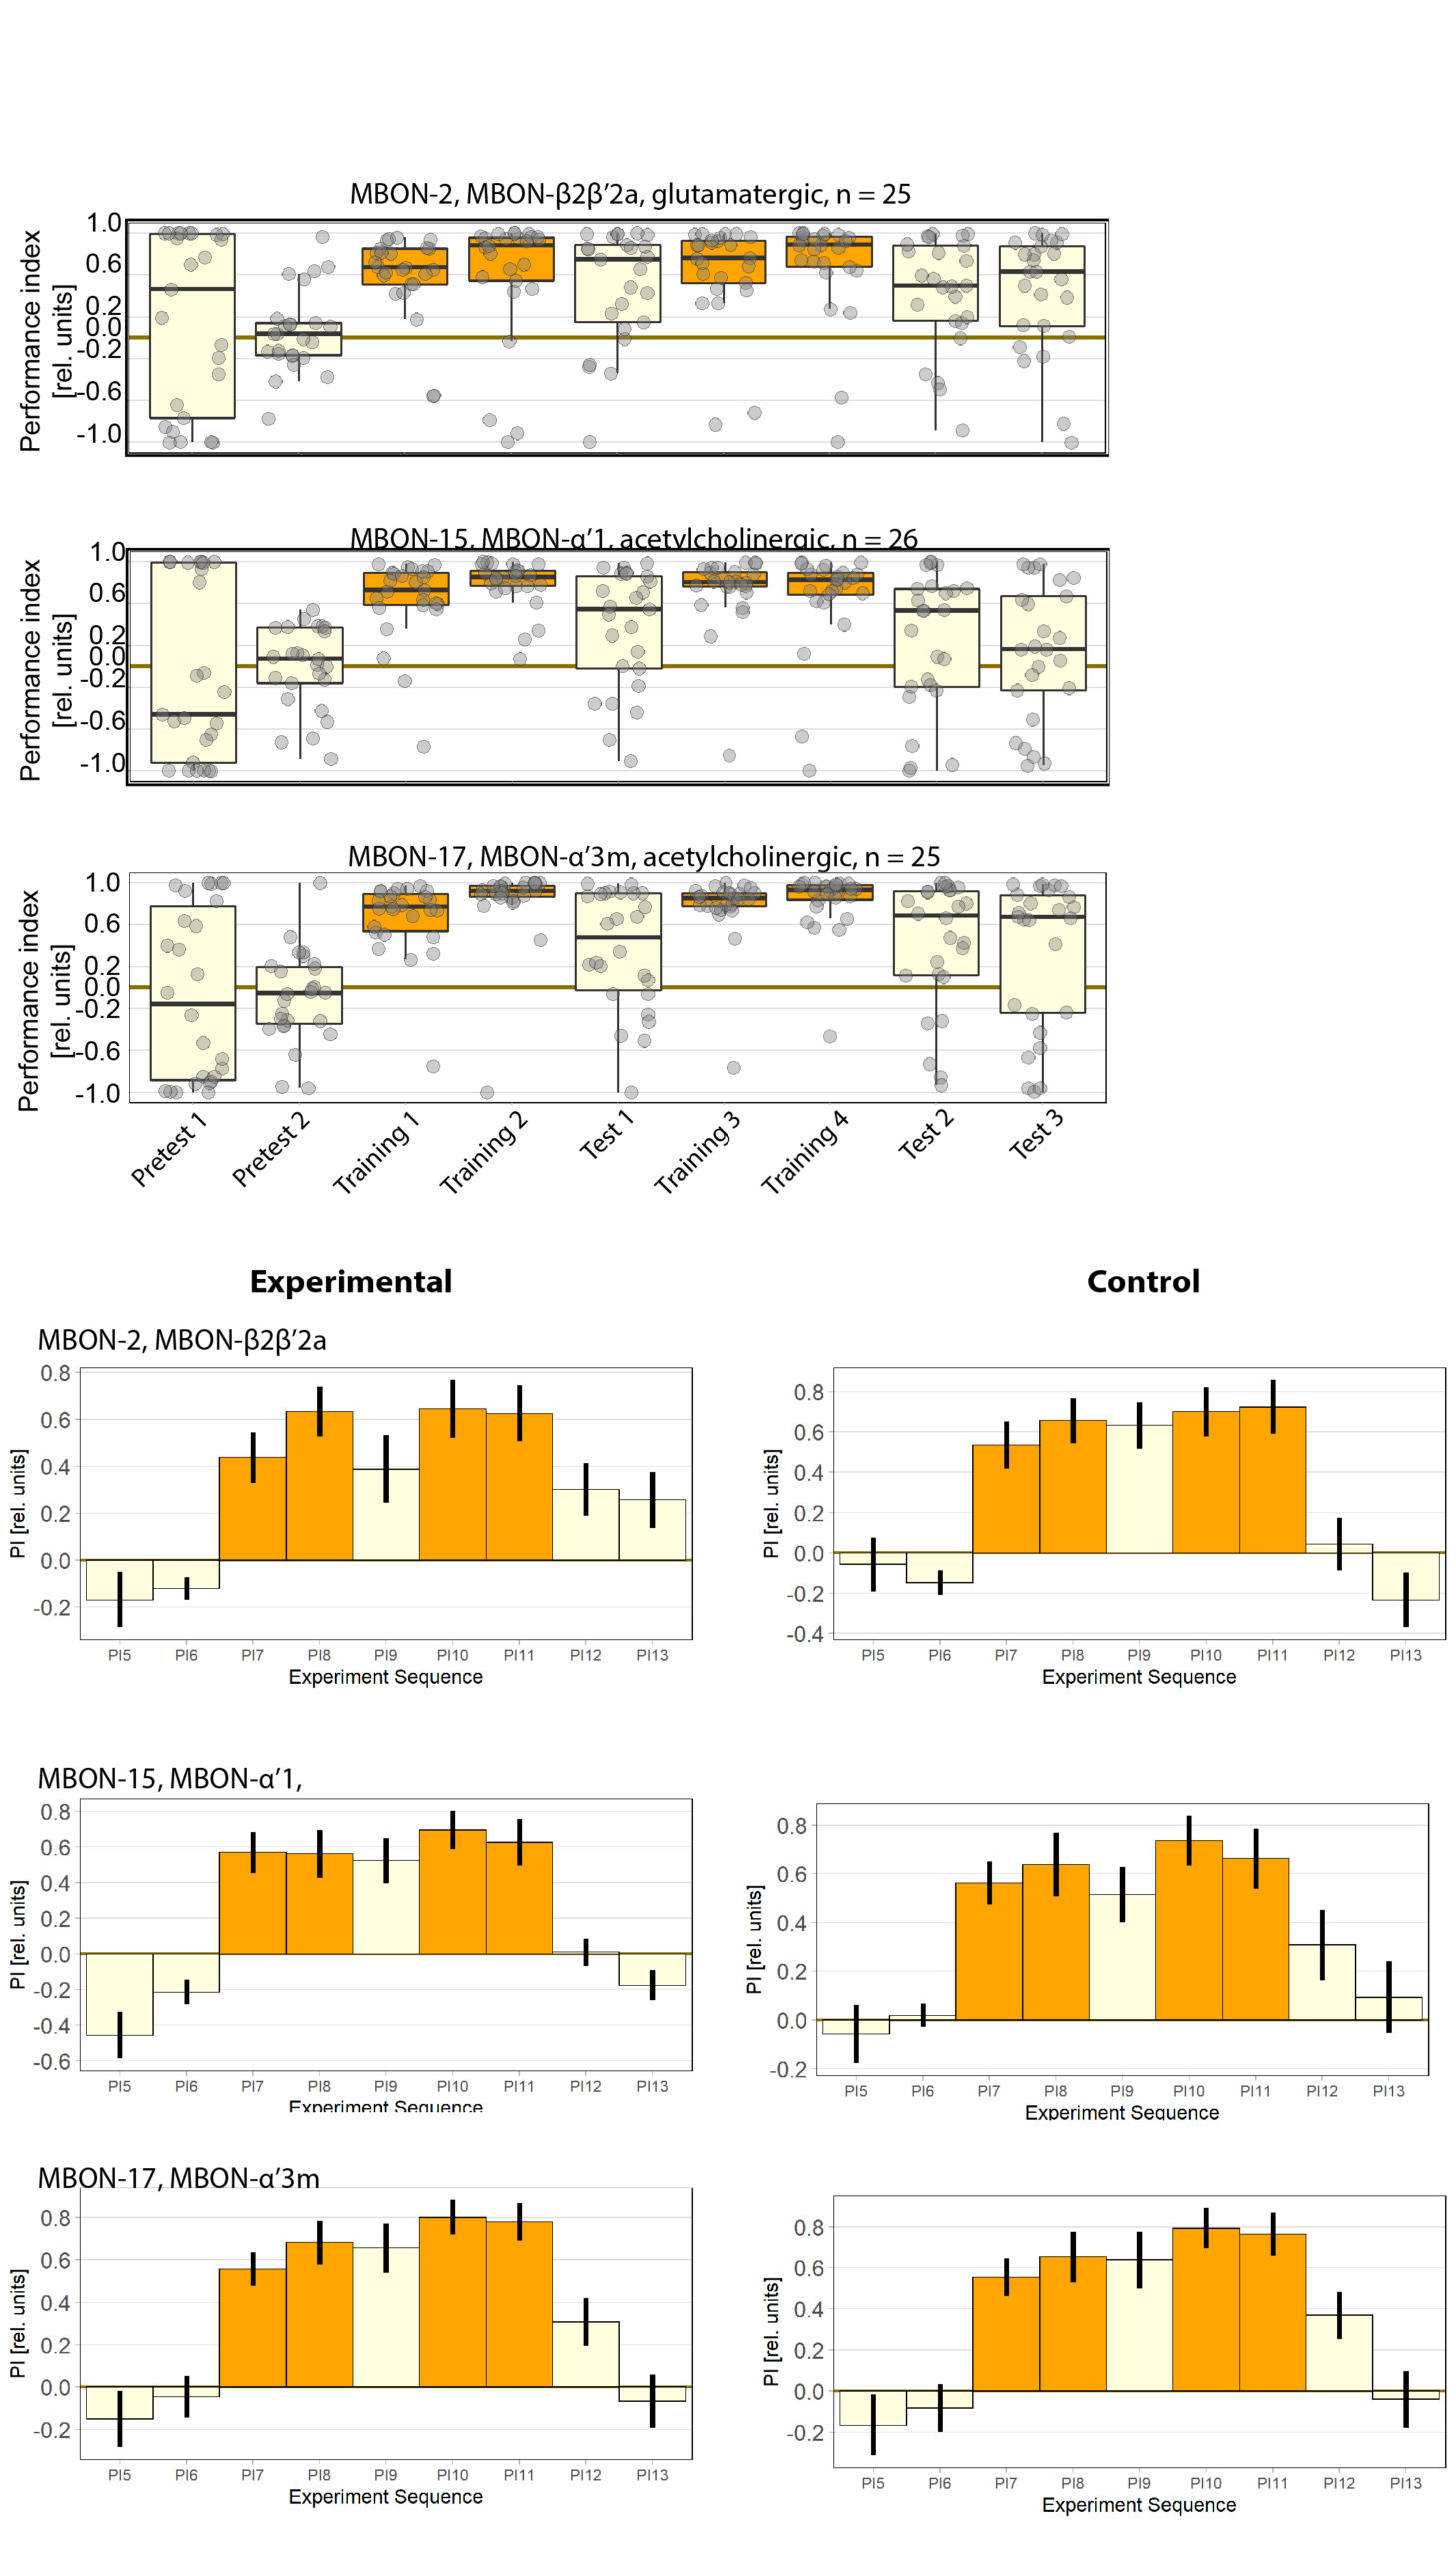
General behavior of the MBON-2
I wanted to expand and look into some general behavior of the mbon-2 flies. Mostly as a complement to the already existing data.
Progress Week 29
-Introduced Sayani to the wonderful world of Drosophila
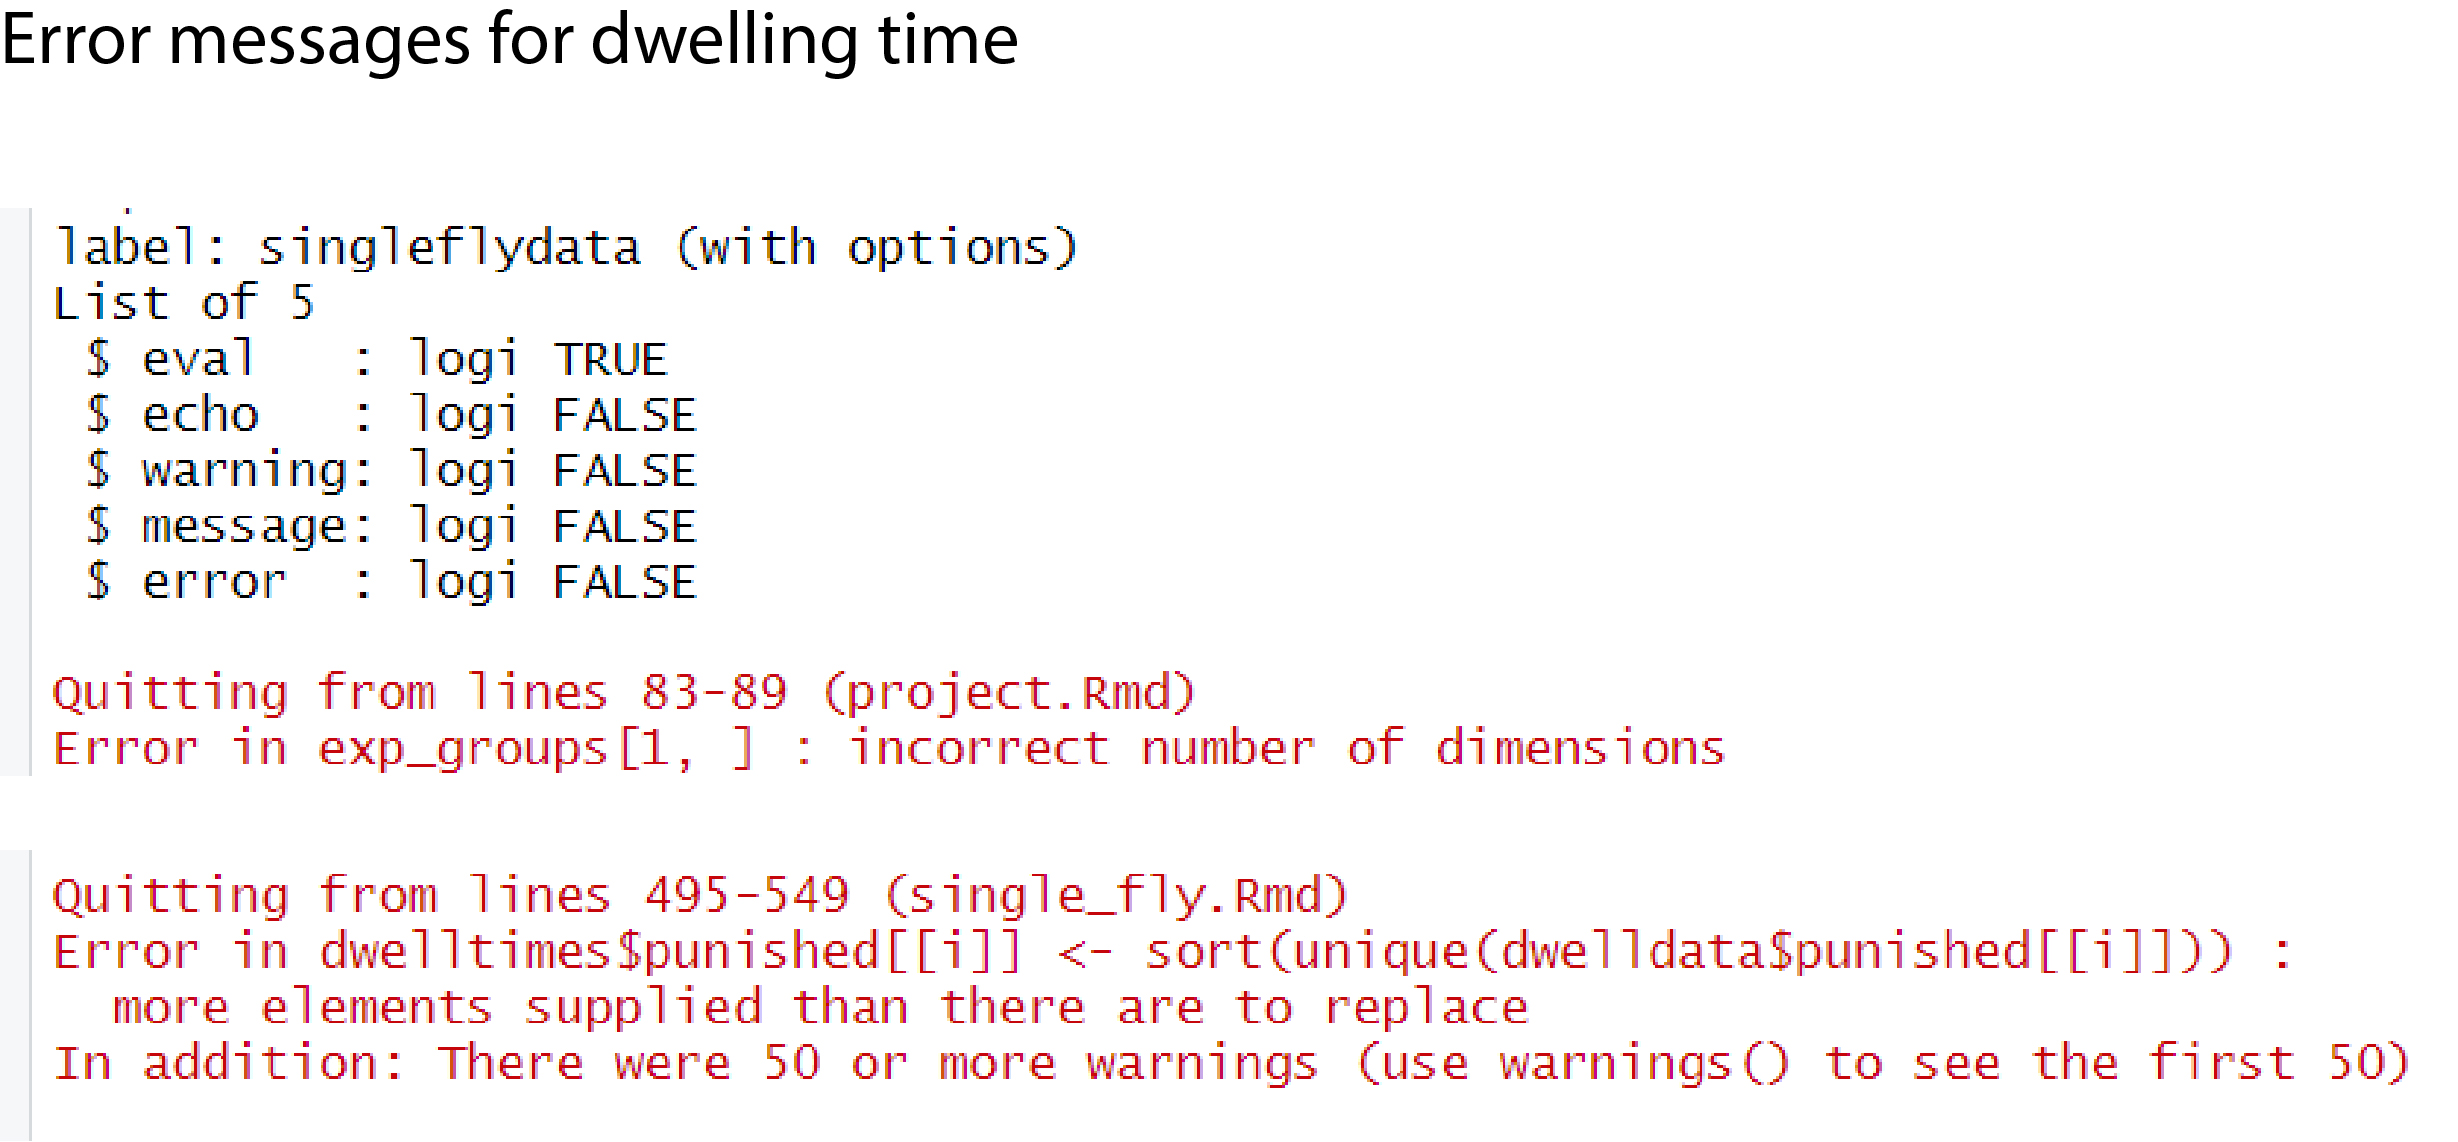
-Been doing some DTS coding
-Preparing flies to do optomotor response for Mathias Raß
Progress week 26-28
Updates in DTS code
Refreshing dissection skills
Progress for week 25:
DTS coding
-Added progressbar for data validation
-Updated the progress bar (see figure 1)
-Fixed bug with wrong sample size (see figure 2)
-Fixed bug with unorganized barplots (see figure 2)
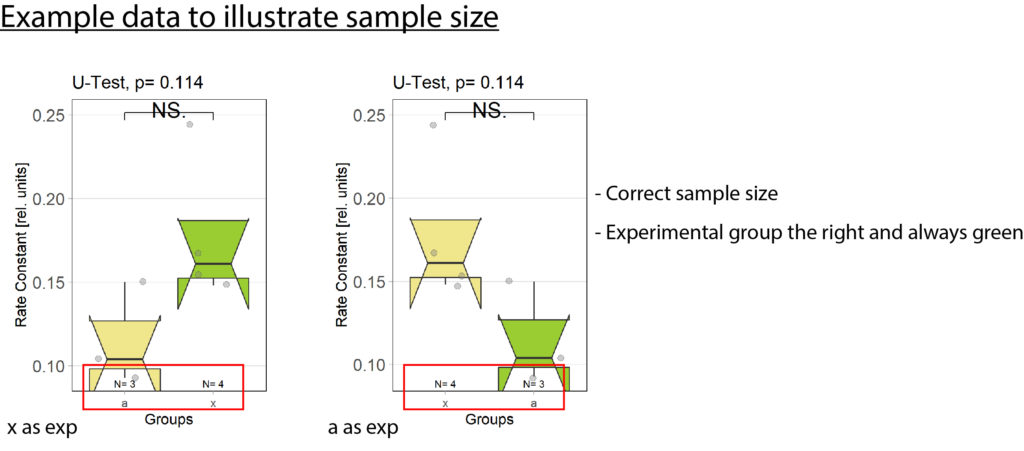
Exp always to the right: plotOMparams <- plotOMparams[order(plotOMparams$desc),]
plotOMparams$group <- factor(plotOMparams$group, levels=paste(unique(plotOMparams$group)))
Samplesize fix:samplesizes.annotate(boxes, as.numeric(table(plotOMparams$desc)))
Progressbar: progress <- c(round(l(100/(length(xml_list)))),round(flycount(100/(totalflies))))
Rescreening:
-Finished rescreening last Thursday. Started to evaluate the new data
Optomotor platform: Ran a few more tests to confirm that the machine was still working, it is. I also adjusted the 0 line so that it is at 0, by readjusting the “zero line” screw. Looks much better now but it is still not perfectly at 0. A difference 0.1 on the computer screen translates to 100 in the evaluation chart.
Optomotor platform:
Ran a few more tests to confirm that the 0 line is always at 0. Readjusted the “zero line” screw. Looks much better now. It is still not perfectly at 0 but a difference of 0.1 in the chart translates to 100 in the evaluation graph.
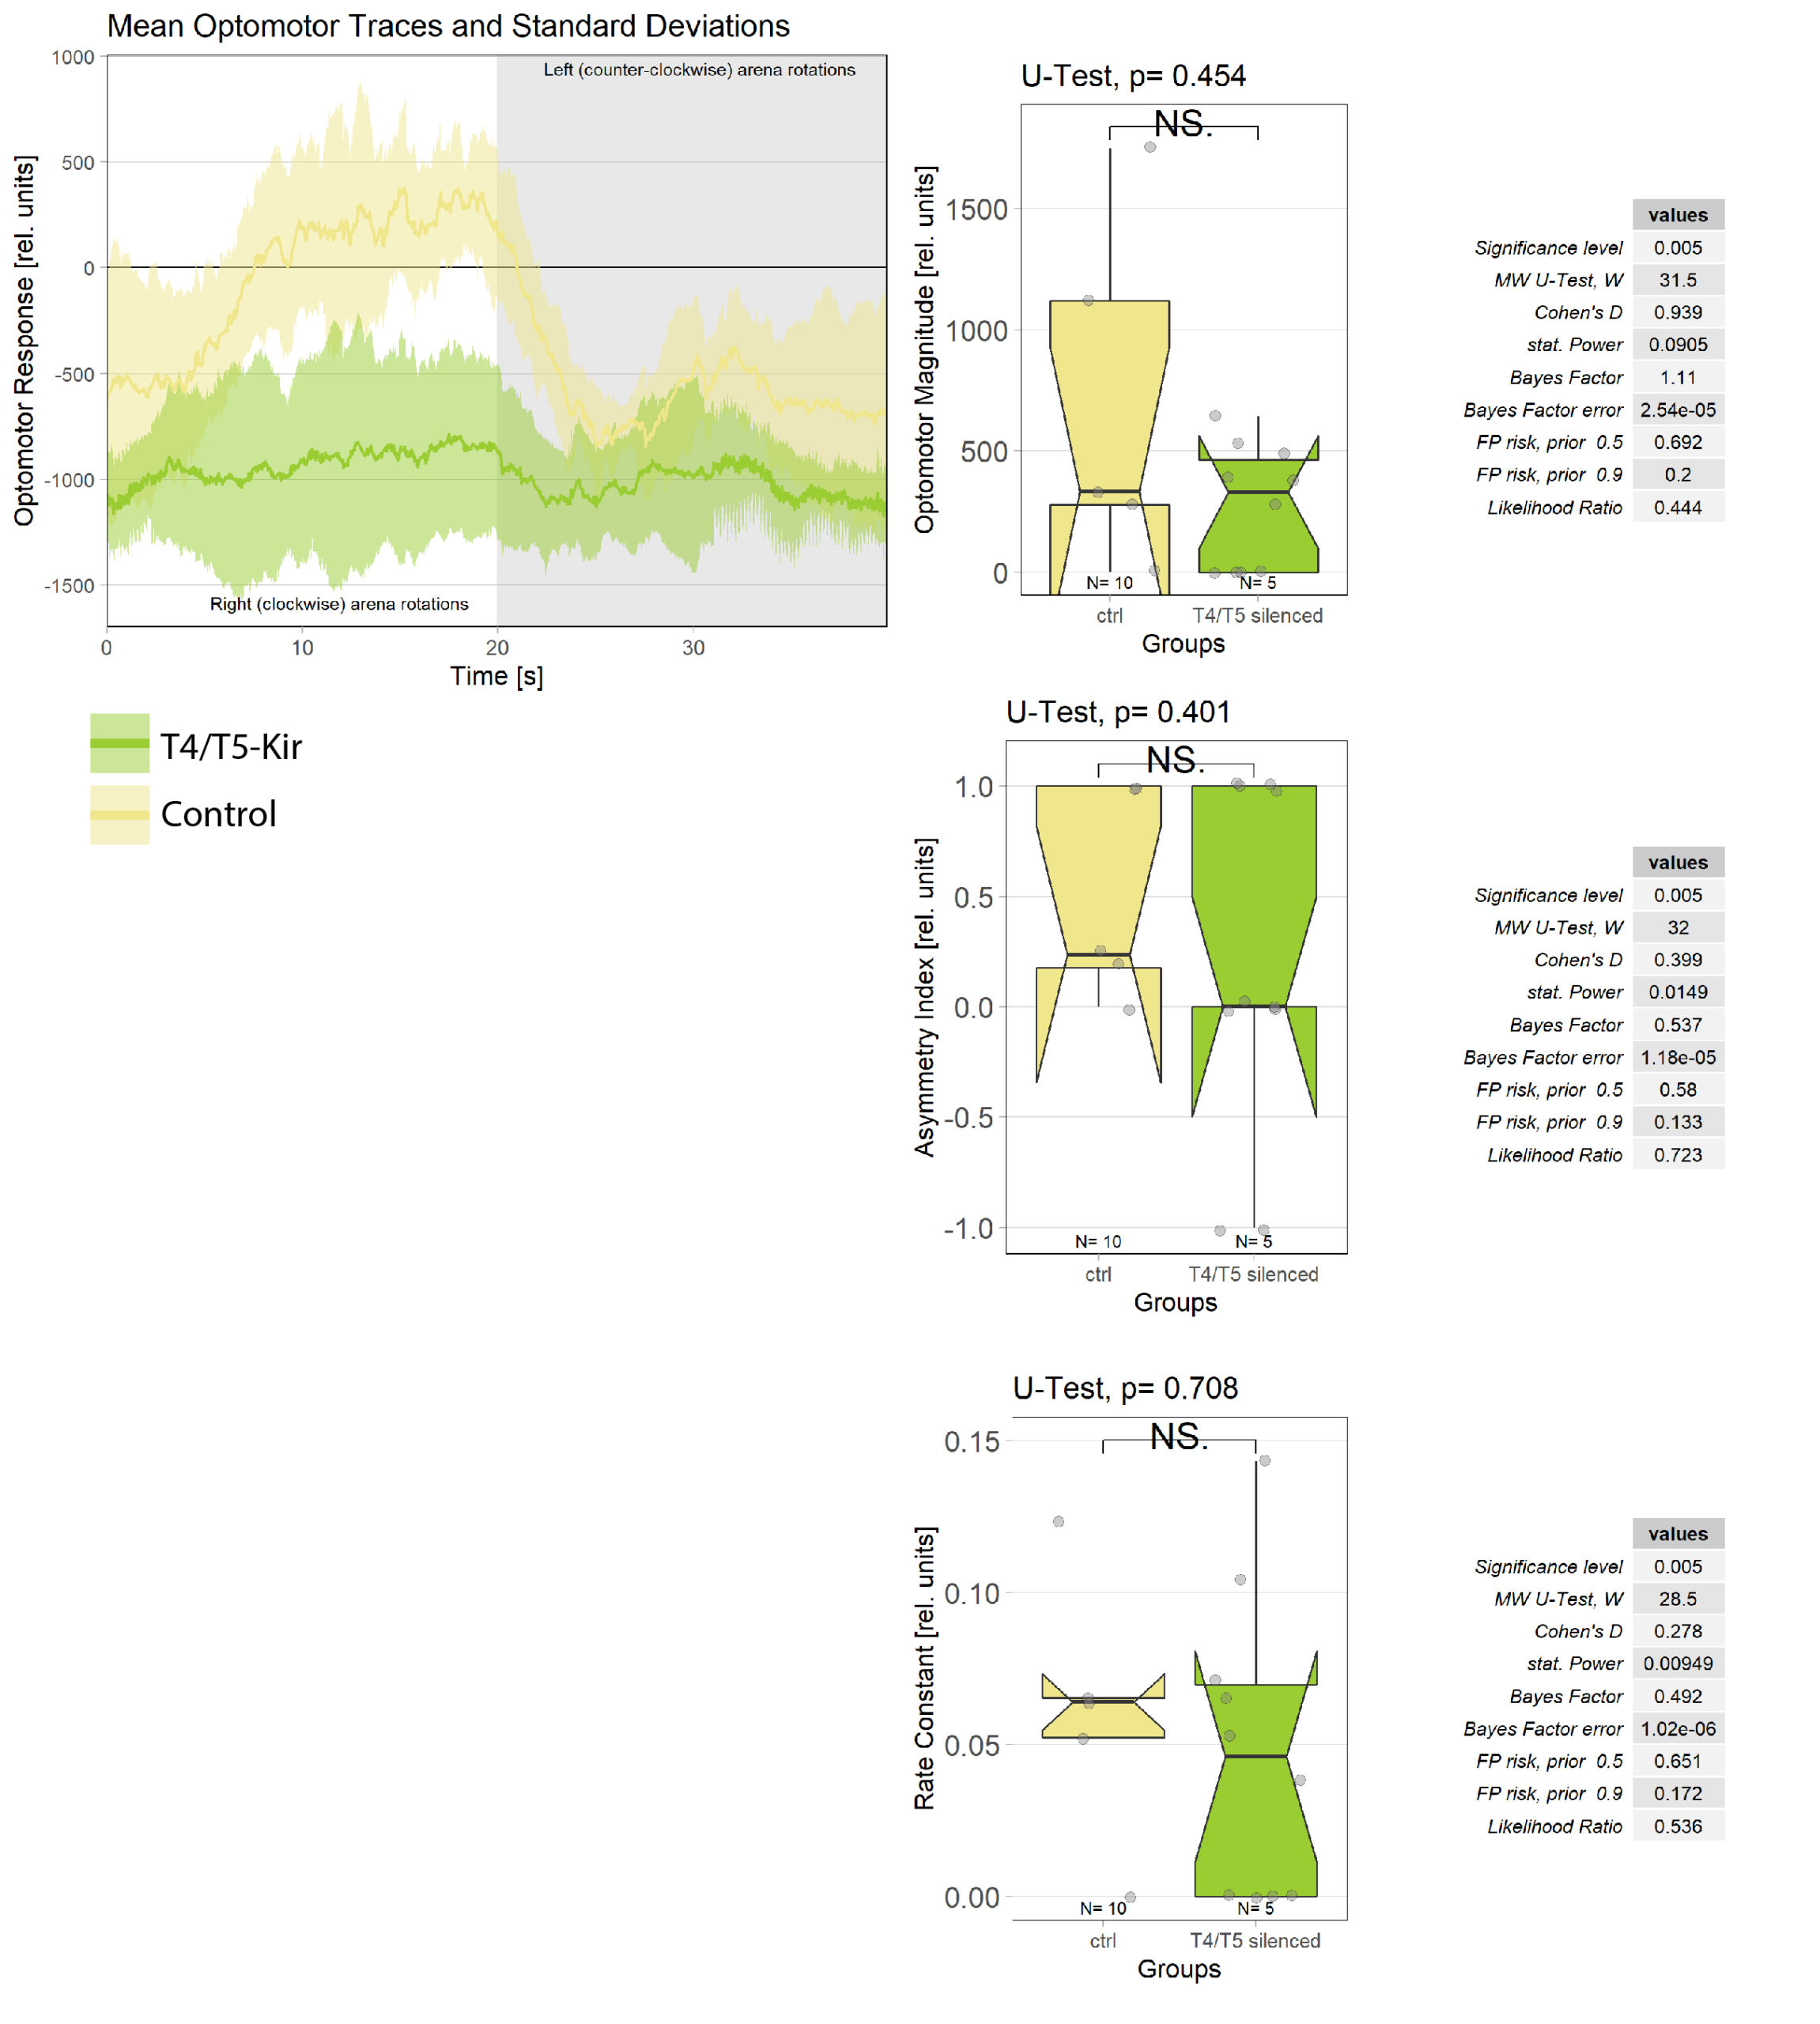
Statistical evaluation of OR
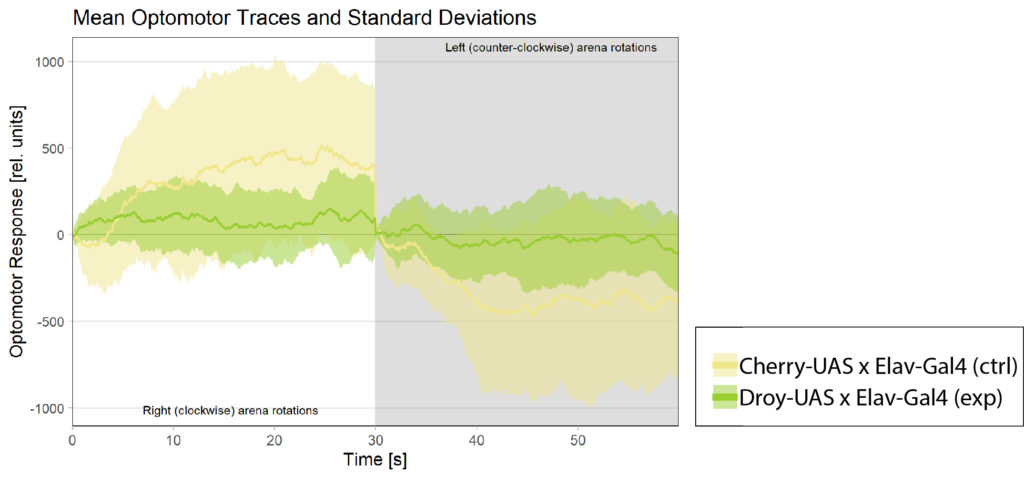
Recently I measured the optomotor response in T4/T5 flies. As expected, they did not respond to the optomotor stimulus as seen in the left chart below. However, statistical evaluation struggles to quantify this difference. It might be that this is because of the low sample size, or that we are using the wrong statistical analysis?
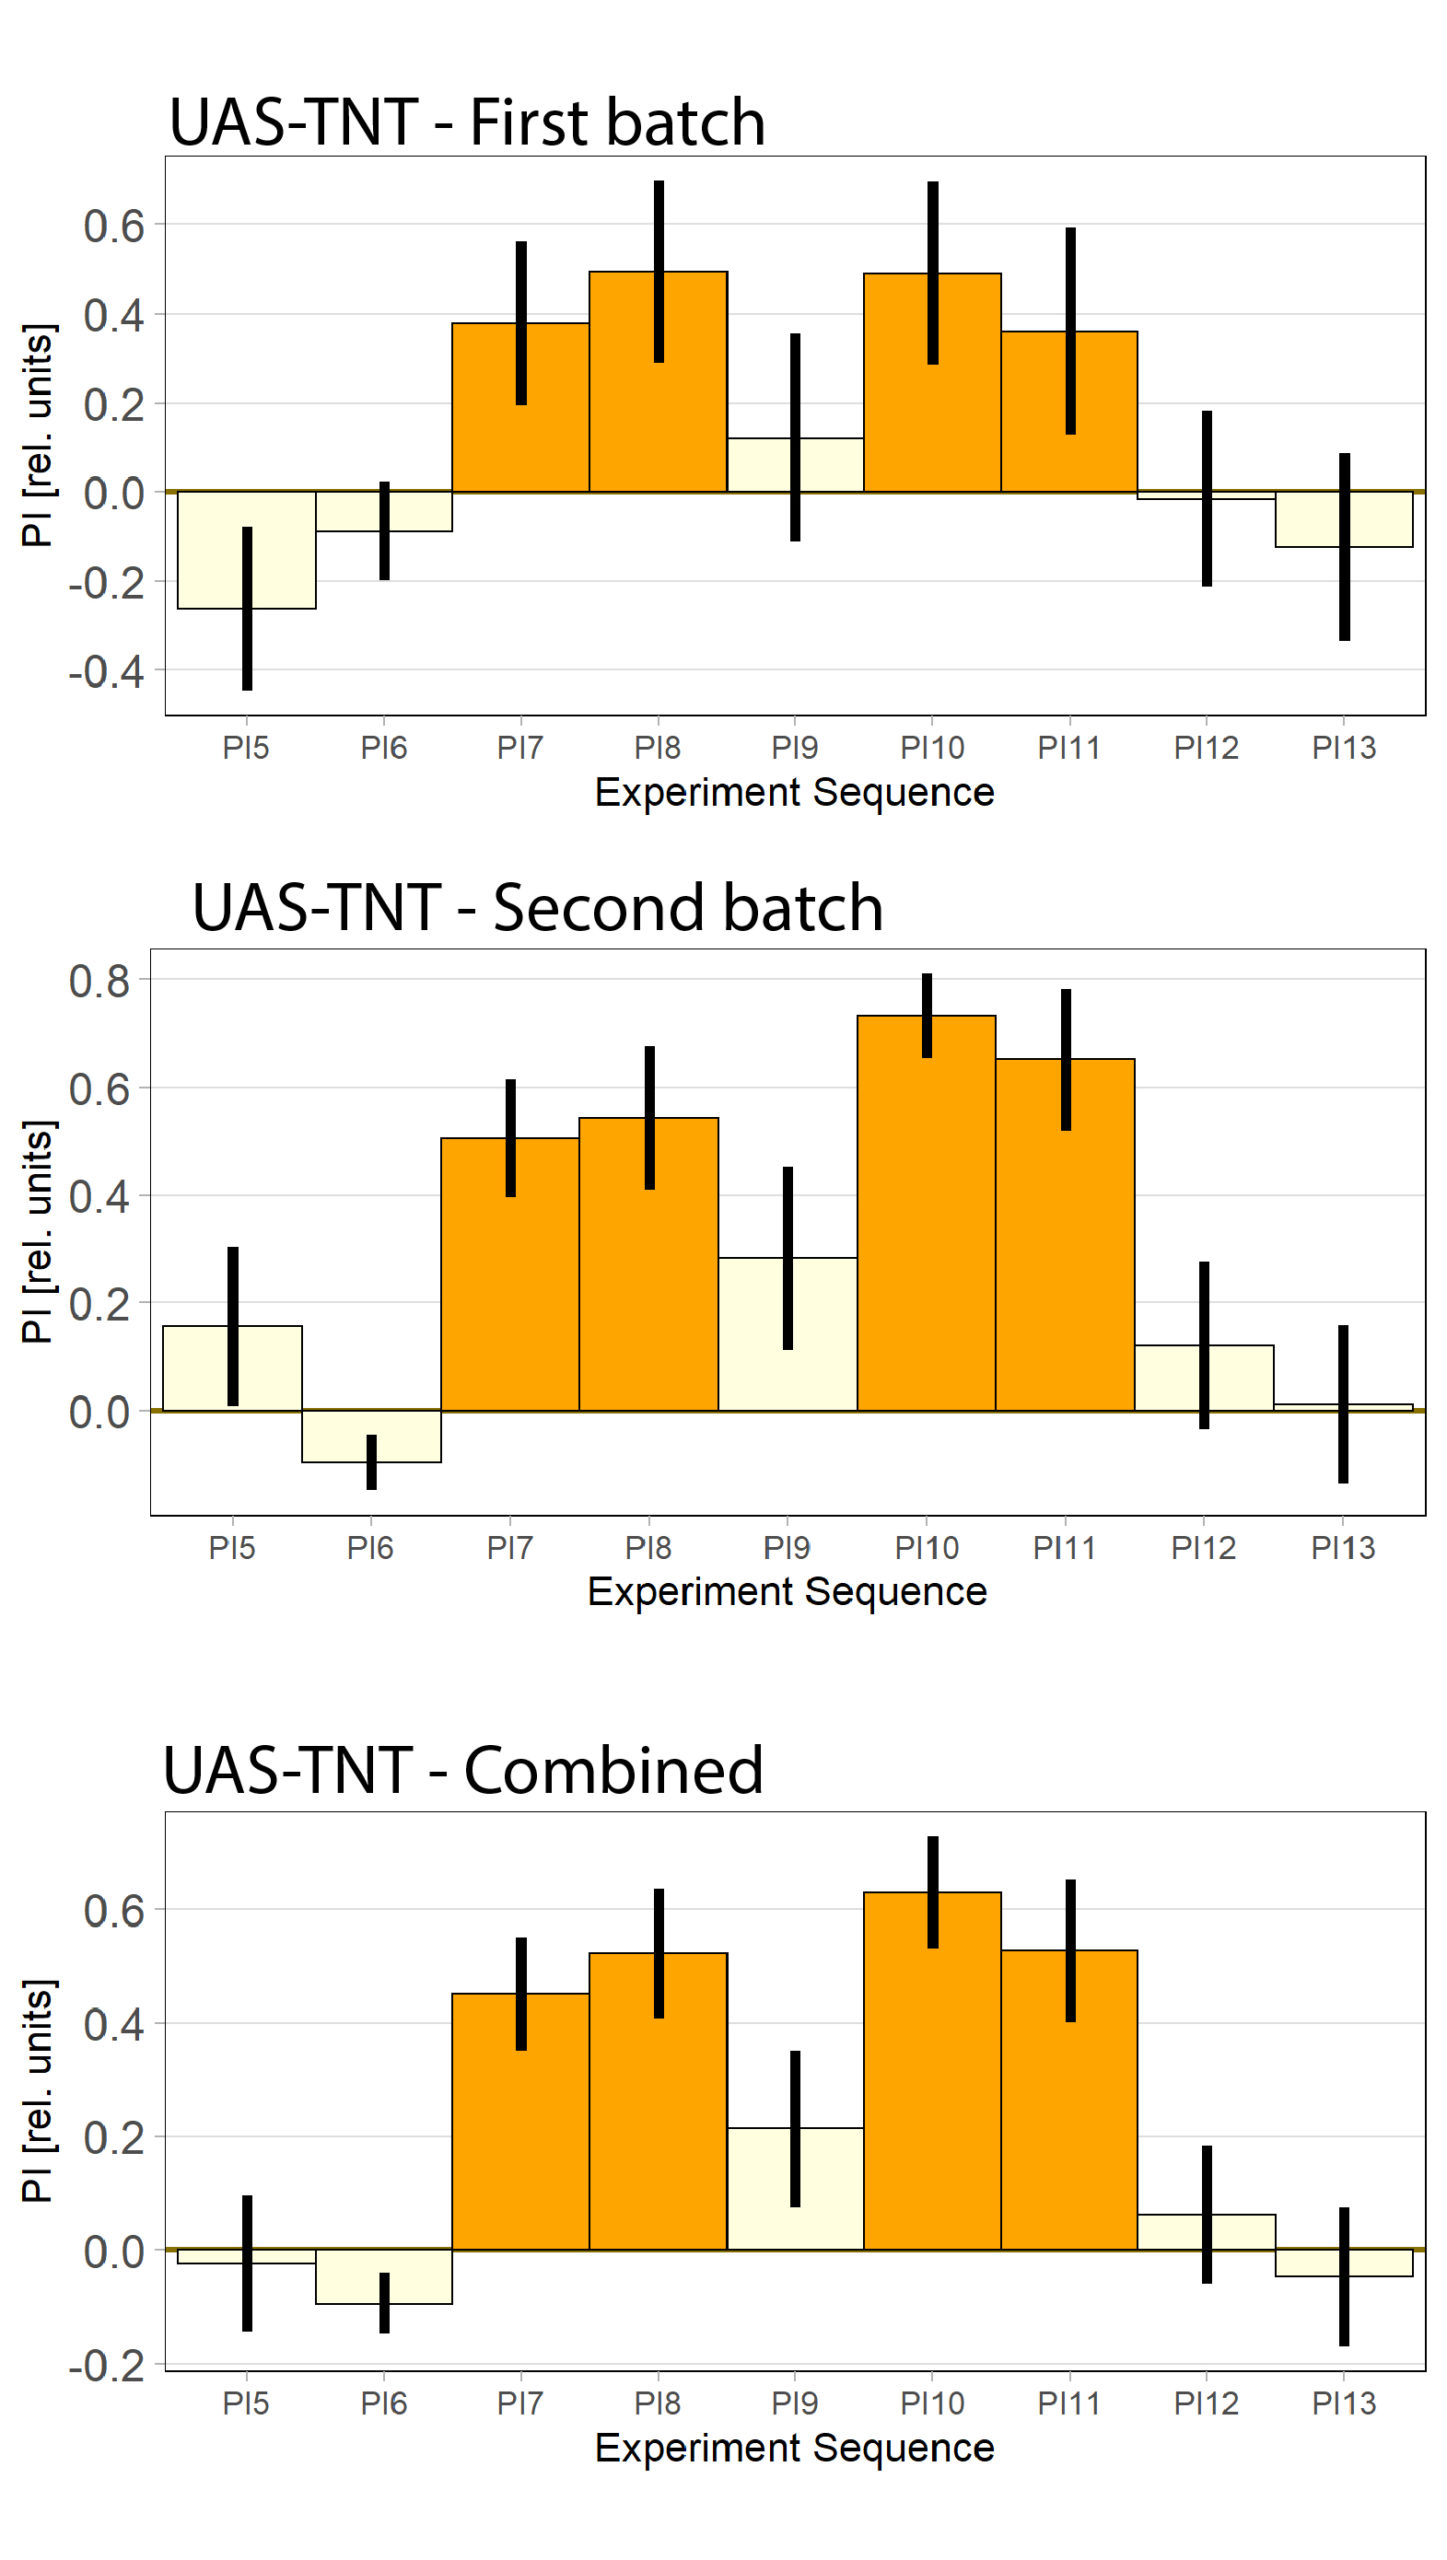
Some issues with UAS-TNT control
I experienced some issues with the first batch of the UAS-TNT control flies, theyh ad a very low learning curve. The second batched looked fine but the still have a slightly lower learning PI during Test1 than I want.