Fussl shows numerical difference in operant self learning
on Tuesday, August 7th, 2018 2:49 | by Anders Eriksson
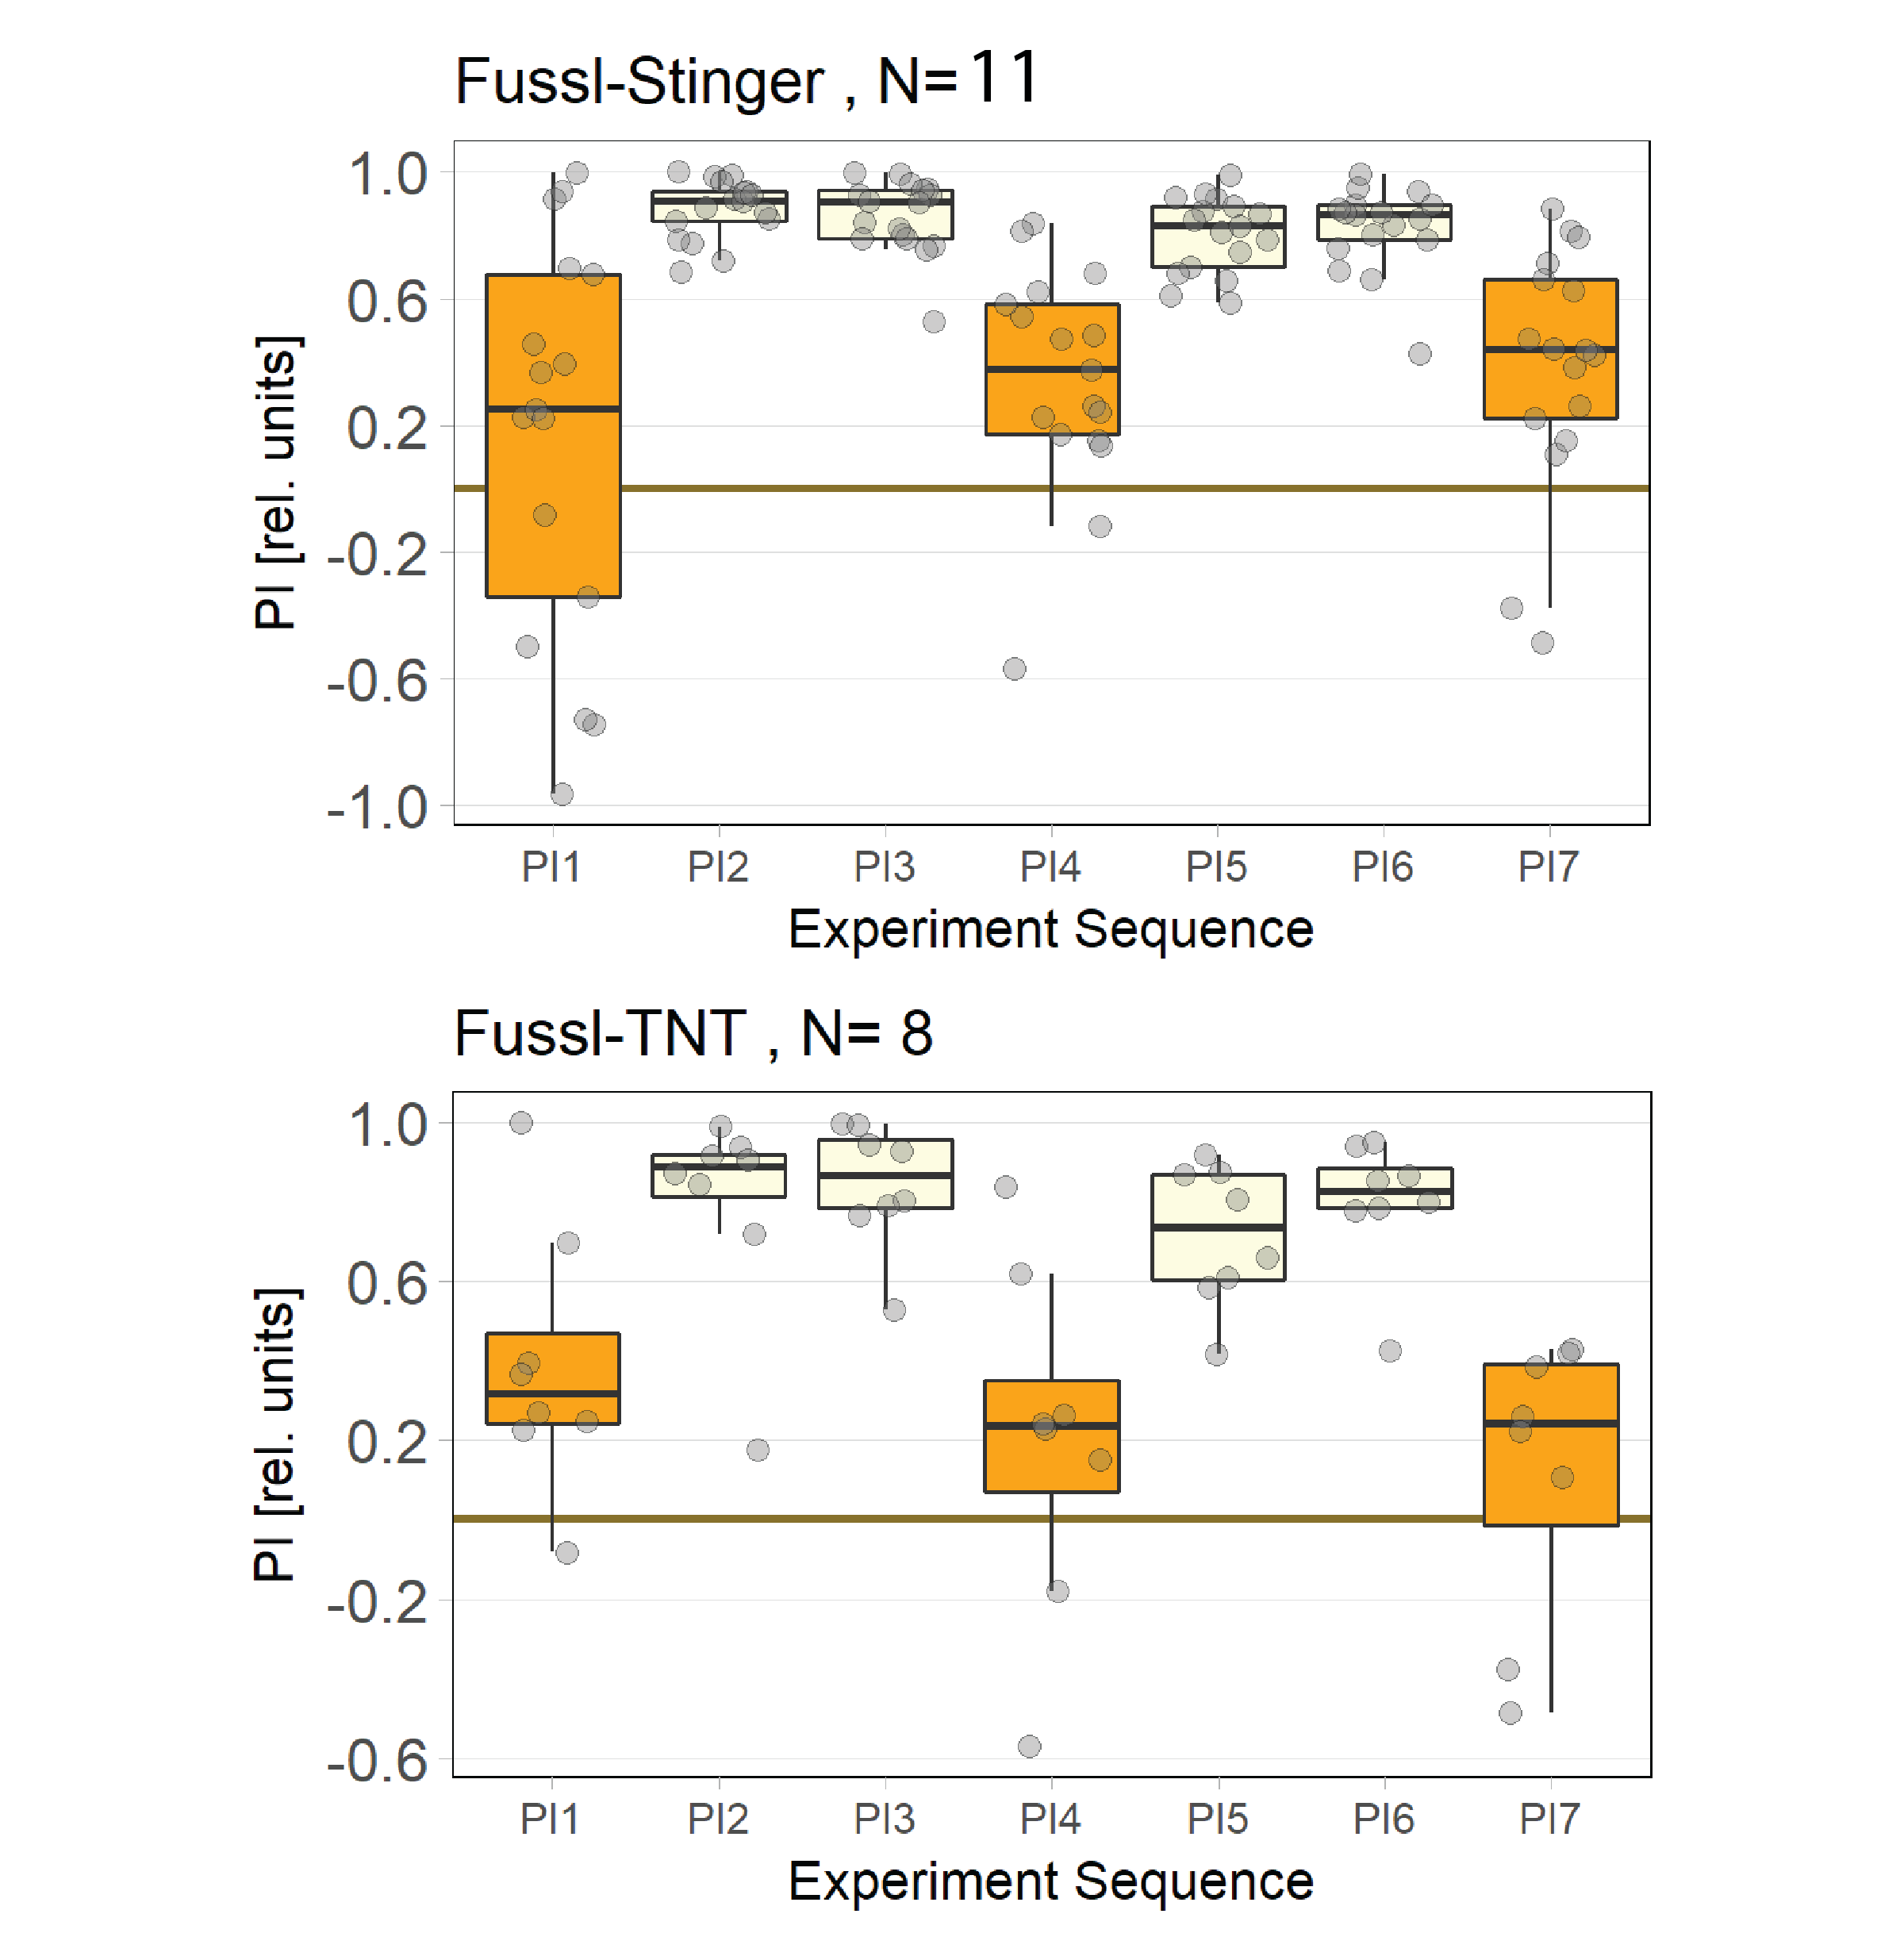
Fussl was crossed with either Stinger (ctrl) or a UAS-TNT line to block the synaptric transmission of the Fussl positive neurons. A third construct was used but did not yield any data due to difficulties with their flight performance. The Fussl-Stinger along with Fussl-TNT flies do also show difficulties in flying. These differences will be assessed.
The experiment was done as a pilot experiment before doing a larger scale.
The data is a bit inconsistent but shows a positive and reassuring numerical difference. The control is a bit lower than expected, compared to WTB flies (showing usually a PI 0f 0.6). The flies have a slightly different background than wtb flies and have pale orange eyes (still no apparent impairments in vision). Further experiments will be conducted before proceeding with a larger sample size of the flies.

Category: crosses, flight, genetics, Lab, Memory, operant self-learning | No Comments
Joystick Update
on Monday, July 30th, 2018 2:08 | by Amanda Torres
Category: Lab, Operant learning, Operant reinforcment, operant self-learning, Optogenetics | No Comments
Assessing the difficulties in self-learning for FoxP flies
on Monday, July 30th, 2018 1:52 | by Anders Eriksson
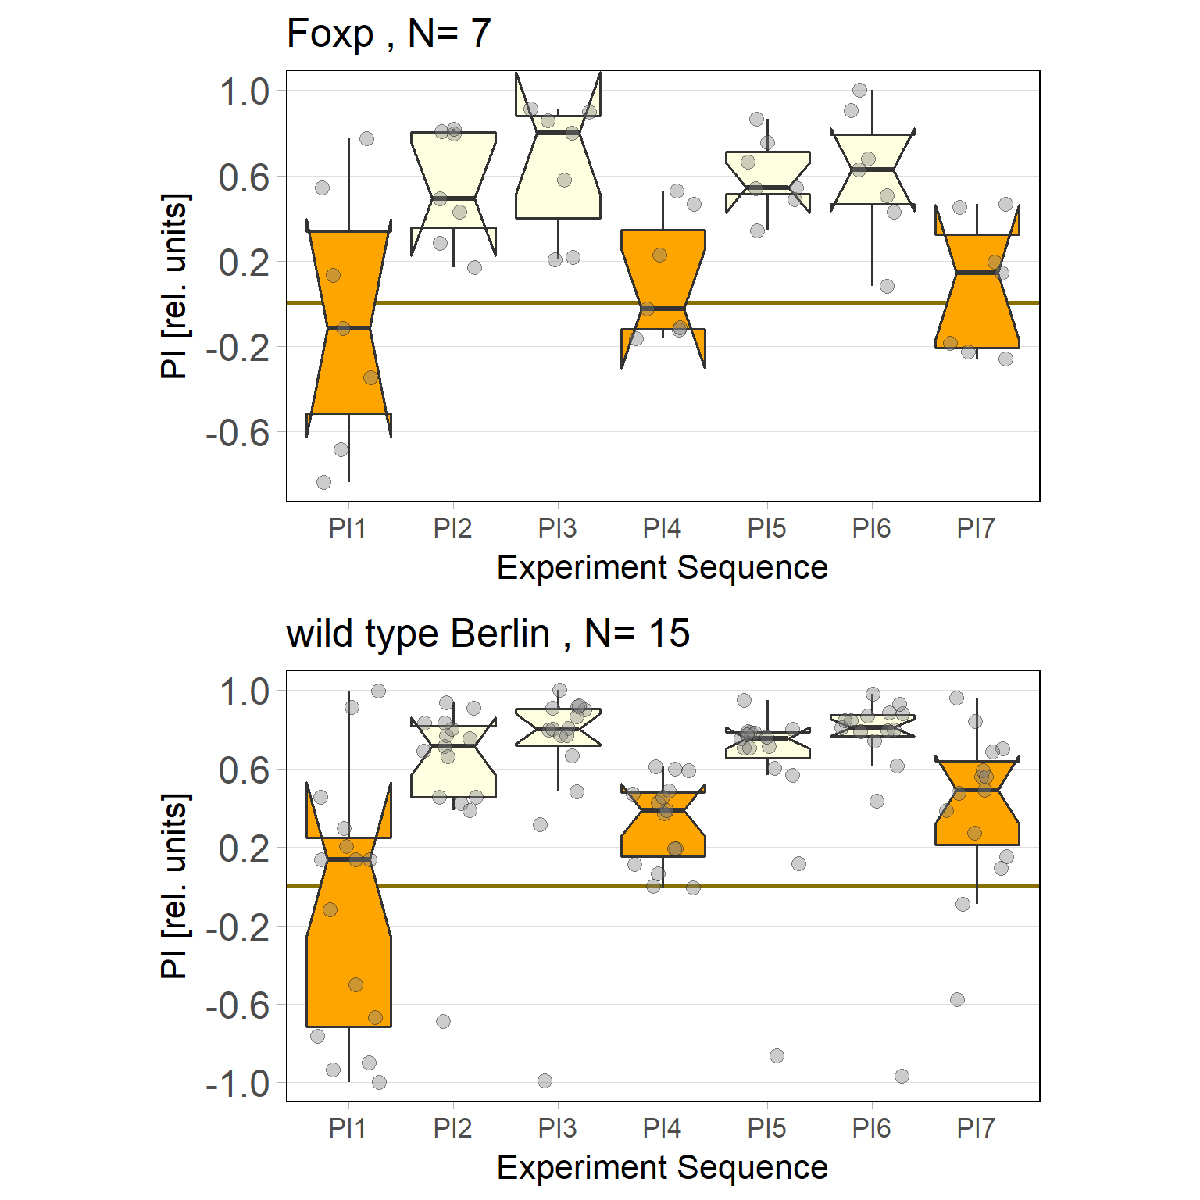
FoxP3955 flies were raised and compared to normal WTB flies. Reportedly, the Foxp mutants have a reduced flight performance as their total flight duration is decreased. This was also something I experienced. The problem seemed to be greater due to the heat in the flight simulator room, initial temperature was 27°C but increased to close to 30°C. I had troubles getting a large sample size enough (same number of Foxp and wtb were loaded into the flight simulator), heat-shock proteins and other stress-related behavior might be an issue. The genotype of the flies were known during the hooking of the flies but was later on concelead and flies were randomly distributed. 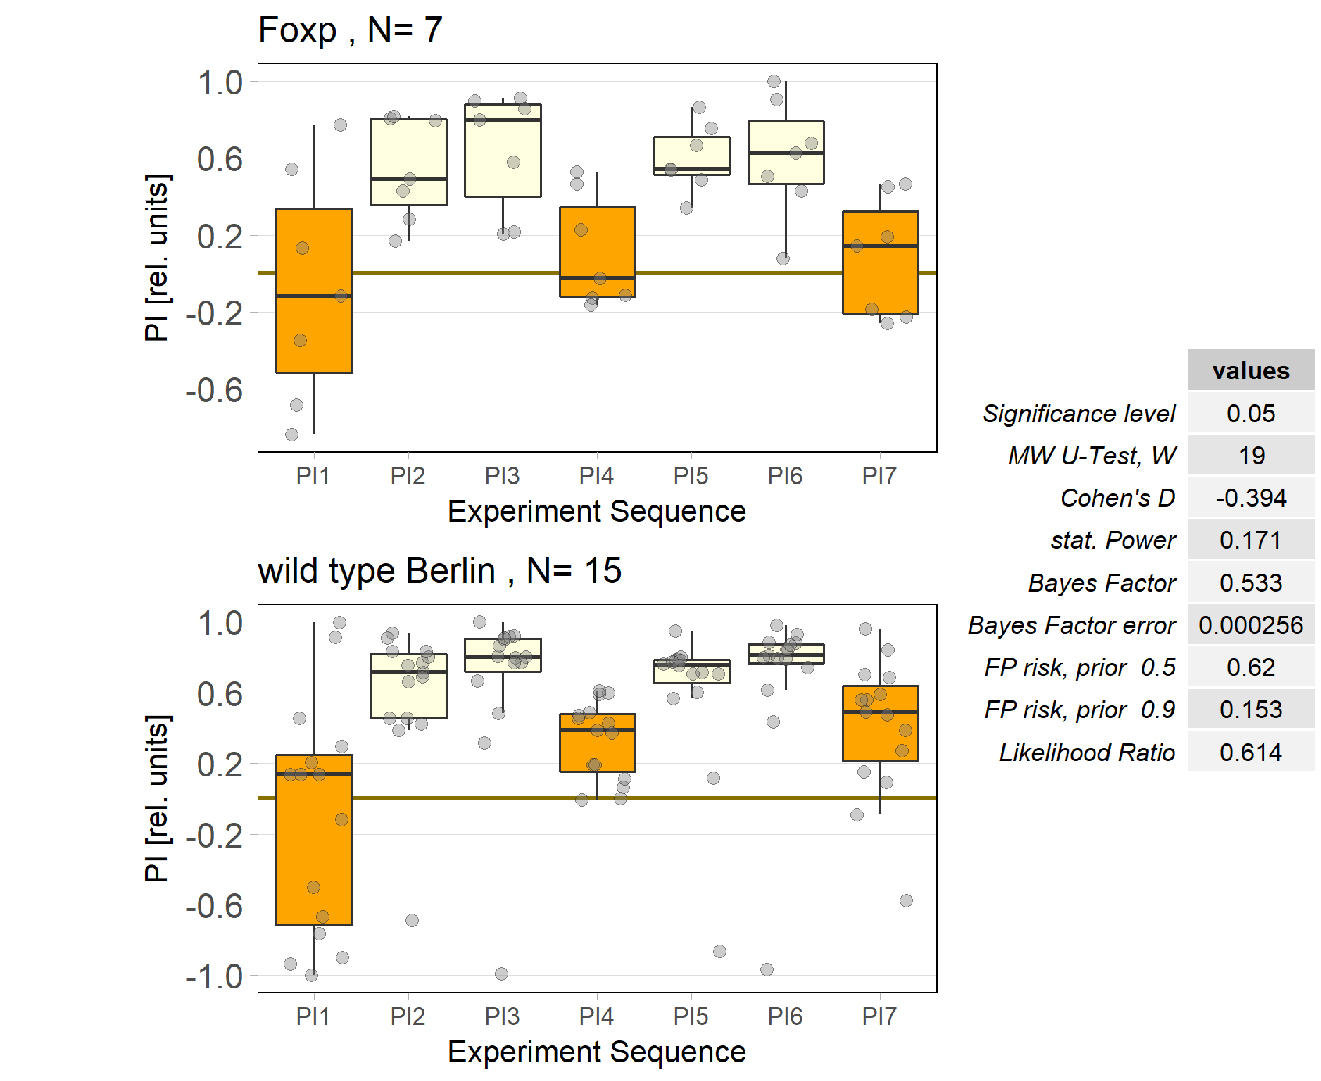
Category: flight, Foxp, Memory, operant self-learning | No Comments
Role of dopaminergic neurons in operant behaviour
on Friday, July 27th, 2018 3:54 | by Gaia Bianchini
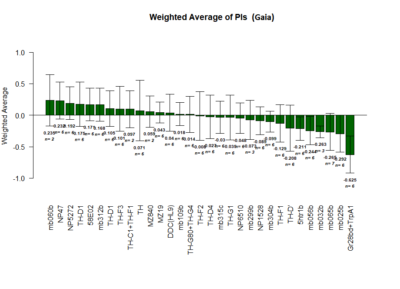
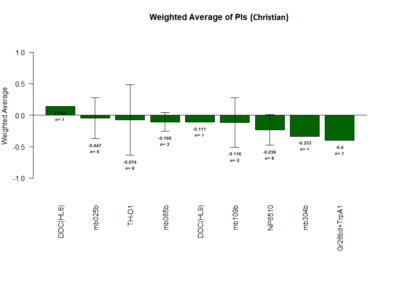
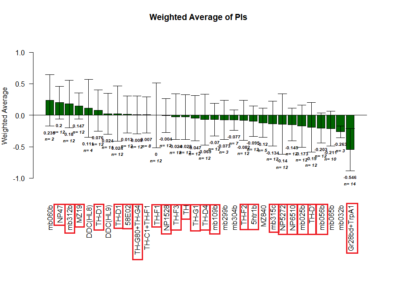
Positive Control: Gr28bd-G4, TrpA1-G4
Parameters: Light: intensity (500 Lux side, 1000 Lux bottom); frequency = 20Hz; Delay = 1 ms; Duration = 9.9 ms; volts = 6.4
Red lines: completed
mb025b: not selected against tubby
Mean trace of all flies and how degrees of freedom vary over learning
on Monday, July 23rd, 2018 6:40 | by Christian Rohrsen
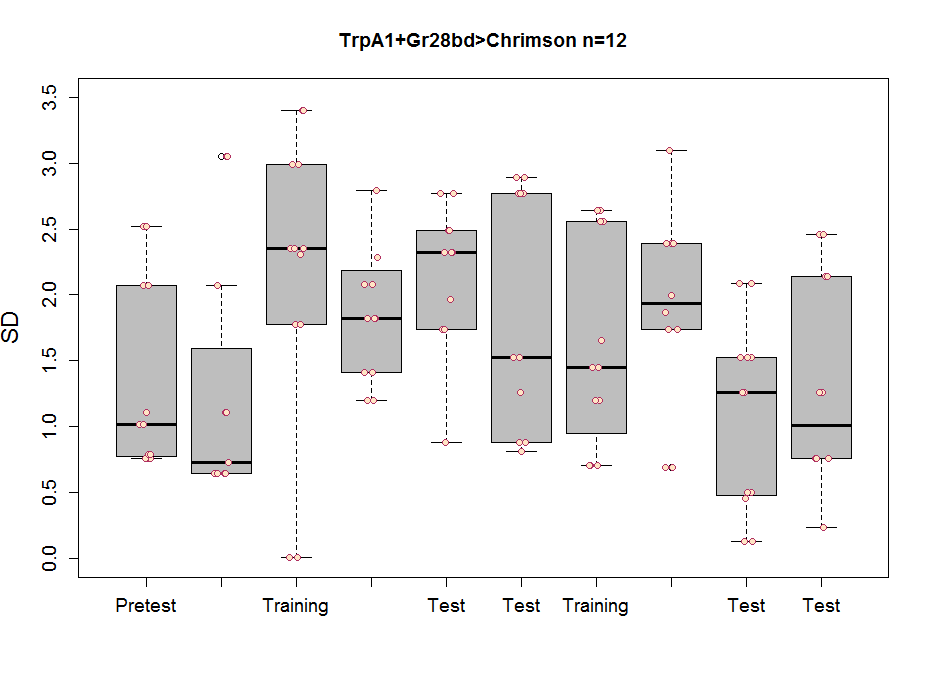
Mean trace of the positive control in the Joystick to get to see what are the overall dynamics and maybe to get an idea what might be the best score to pick.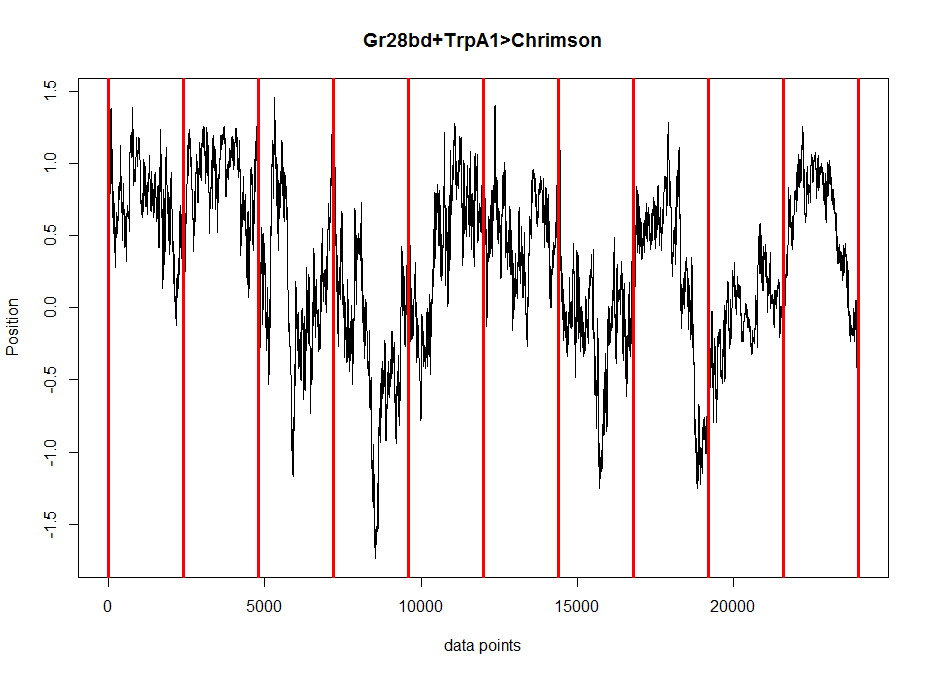 Here the standard deviation of the flies along the time axis. This is just to see if all the flies have more similar phenotypes with each other or not at each time.
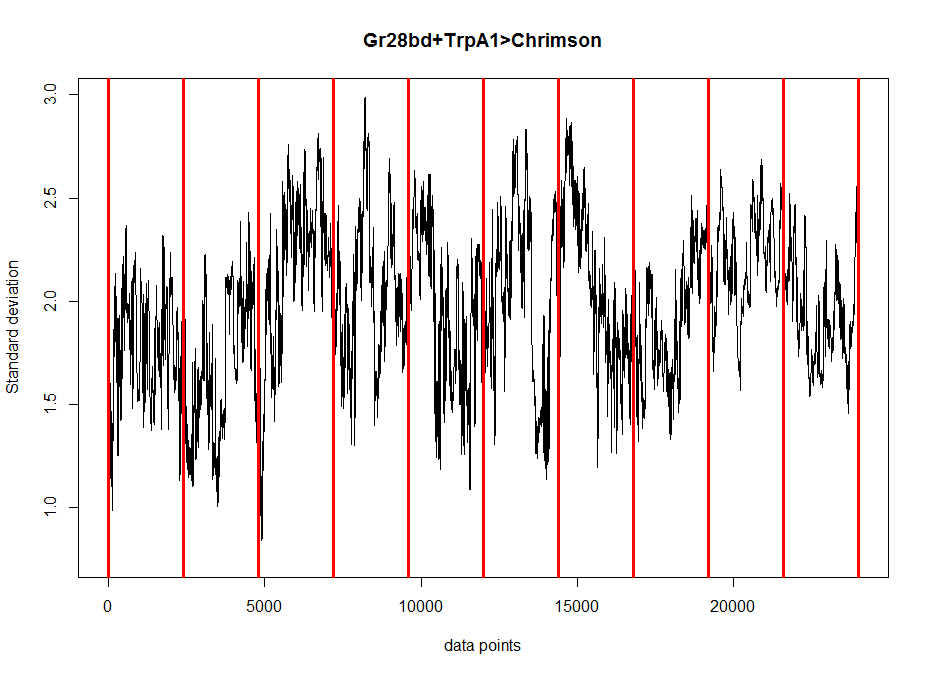
This is to see if the flies have less degrees of freedom at any segment by measuring the standard deviation at each segment. There does not seem to be any effect. Although this might be mixed with the wiggle scores. I think measuring entropy is a better measure.
All the same plots as above but for TH-D’, the interesting line from the screen.
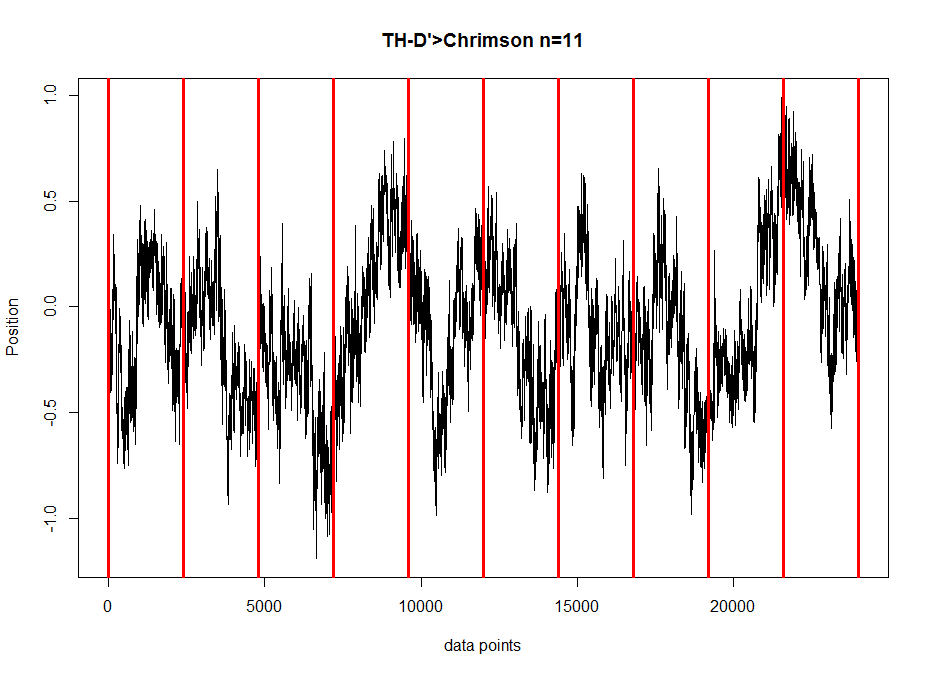
Standard deviation across flies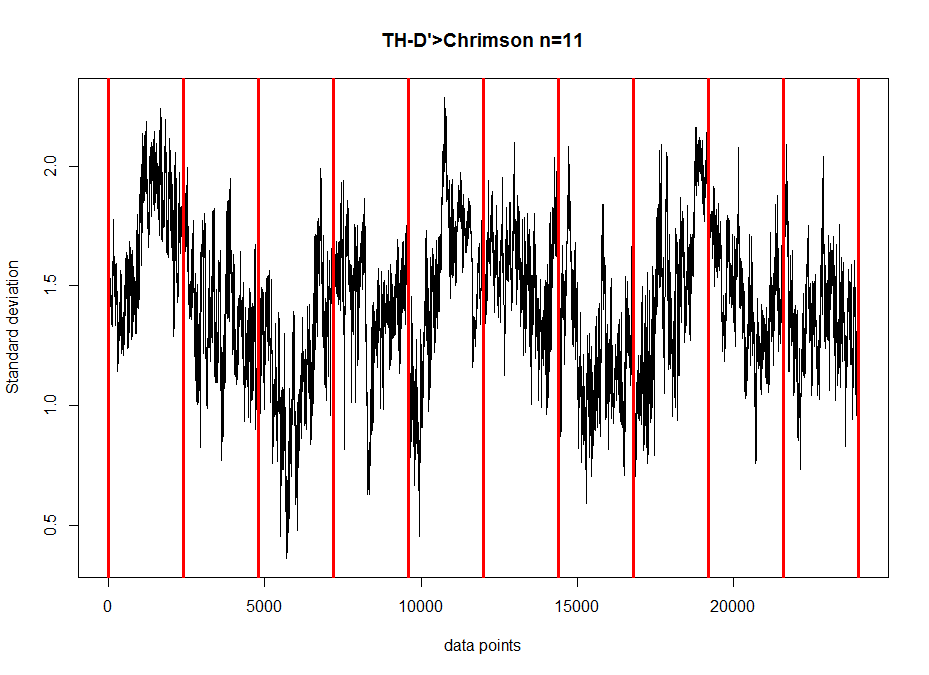
Standard deviation across segments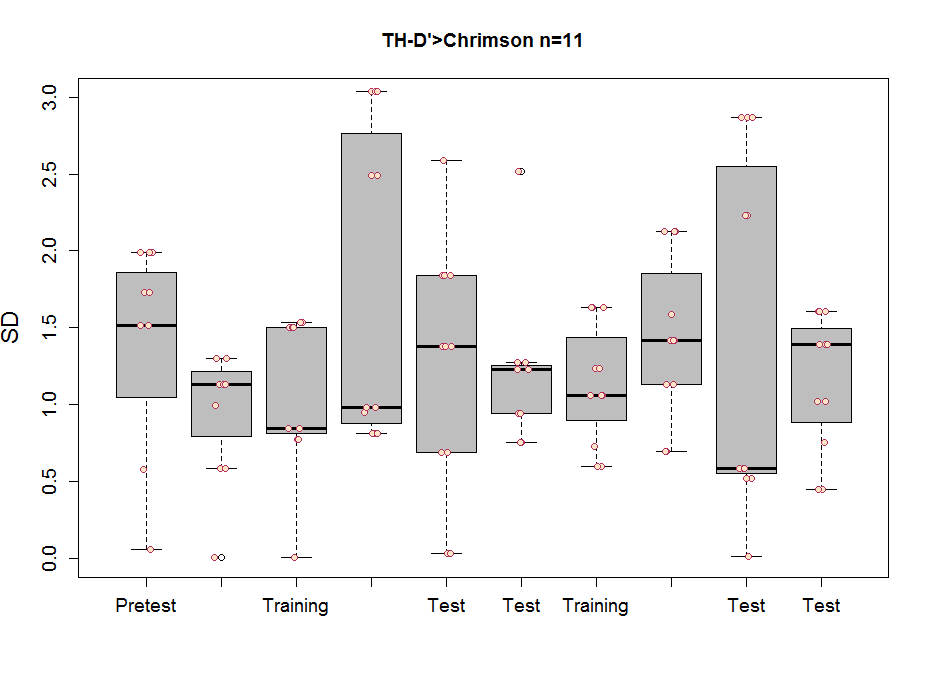
Performance index for modelling for data in the Y-mazes
on Monday, July 23rd, 2018 5:30 | by Christian Rohrsen
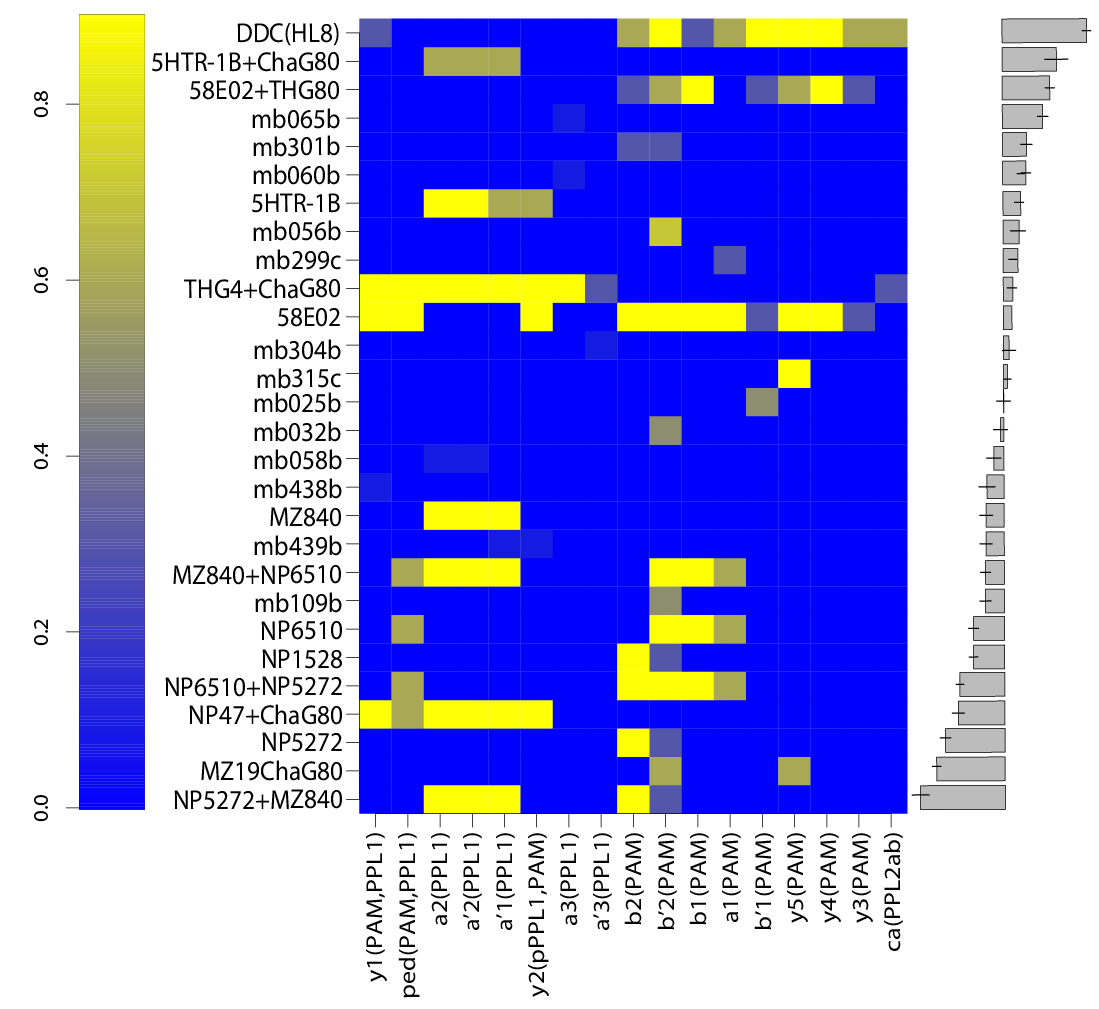
This are the performance indices for the different models performed to estimate the valence of the dopaminergic clusters. AIC: Akaike Information Criteria; BIC: Bayesian information Criteria; LogLikelihood: log Likelihood estimation
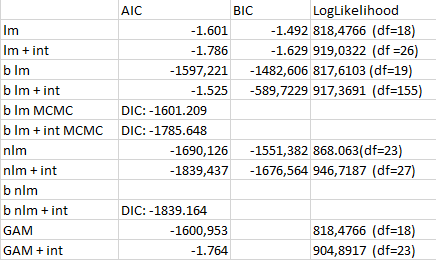
lm: linear model
+ int: taking double interaccions into consideration
b lm: bayesian linear model with bayesglm function
b lm MCMC: bayesian linear model with MCMCglm function
nlm: nonlinear model with lm function with splines fitted
b nlm: splines fitted to each cluster and MCMCglm function
GAM: general additive model with gam function
Adding double interactions seems to produce better models, nonlinearities also make models better and frequentist also. To me it seems like this data might be noise and therefore adding interactions, nonlinearities and frequentist methods is just fitting the noise better (overfitting) and that is why I get better scores with them. In addition, care needs to be taken since I use different functions that calculate the model performance scores differently (although the formulas are theoretically the same for all!)
Finding the interesting lines
on Friday, July 20th, 2018 3:46 | by Christian Rohrsen
This is the correlation from the T-maze experiments from Gaia and Naman. Neither ranked nor regular correlation show any significant effect. This means that these effects seem to be random, at least for most of them, is this an overfitting result?
I would say blue 1 is a line that was negative for all the tests I have so far seen. So this might be an interesting line. What to do next?
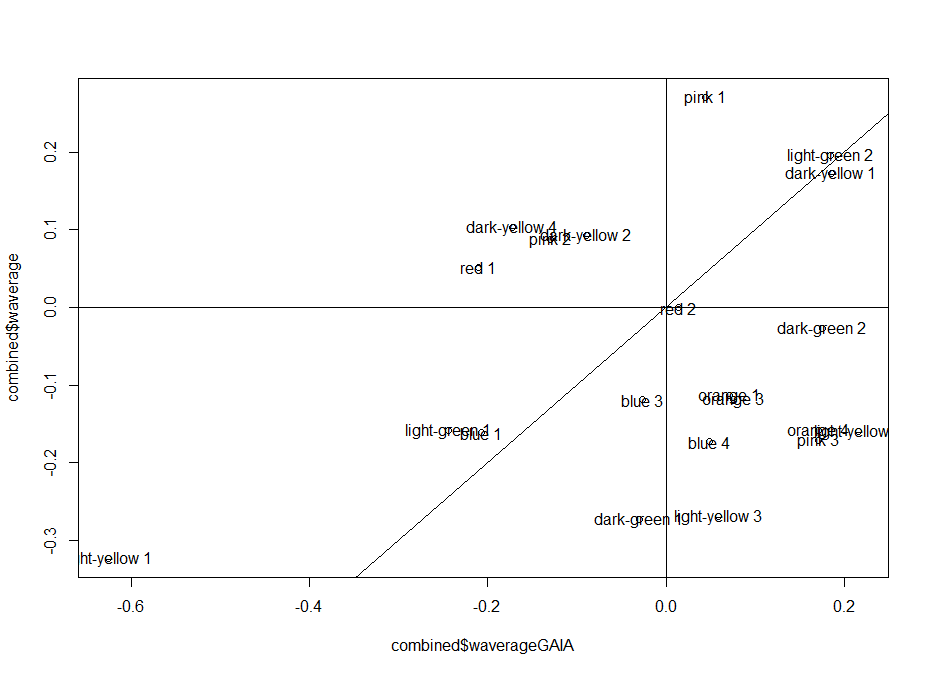
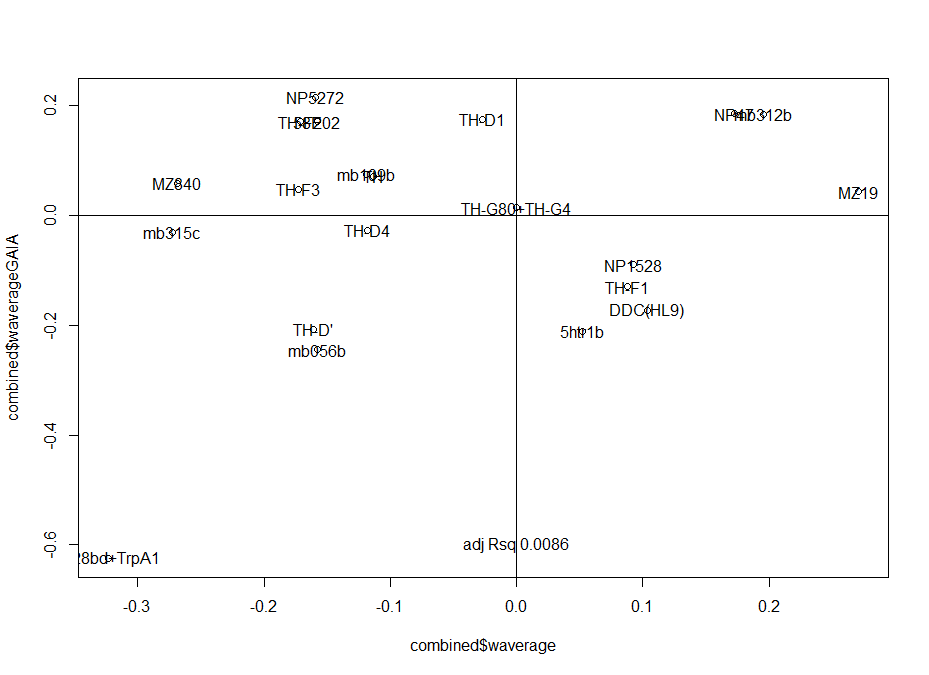
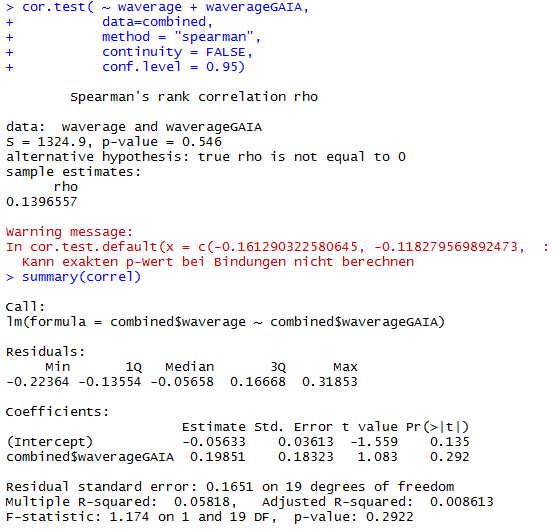
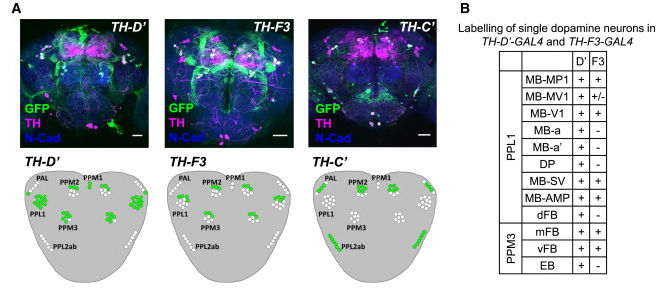
I would unblind the blue1, which is TH-D’. It was shown to be required for classical conditionning in shock and temperature learning (Galili et al. 2014). Another interesting observation is that th-g4+th-g80 seems to have like zero PI scores in all of the experiments (Naman and Gaia in the Tmaze, Joystick and Y-mazes). So could it be that all of these neurons have indeed a meaning, but is depending every time in the context?? Maybe Vanessa Ruta´s work might be interesting for that.
T-Maze experiments : screen results as on 16-07-2018
on Monday, July 16th, 2018 1:32 | by Gaia Bianchini
Results of the T-maze screen analysis, both individual and combined.
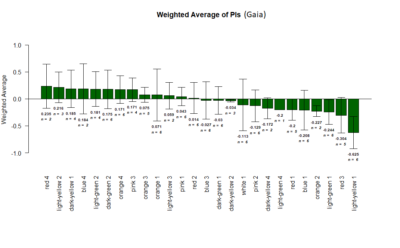
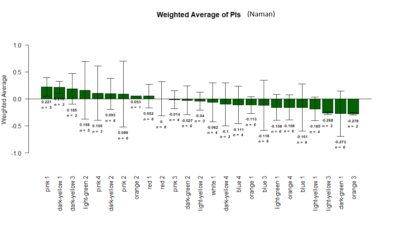
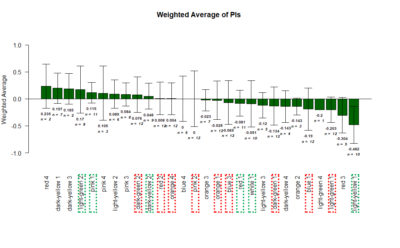
Yellow 1 (Positive Control): Gr28bd-G4, TrpA1-G4
Parameters: Light: intensity (500 Lux side, 1000 Lux bottom); frequency = 20Hz; Delay = 1 ms; Duration = 9.9 ms; volts = 6.4
The T-Maze experiments : Middle analysis and Correlation plot
on Saturday, July 14th, 2018 12:06 | by Naman Agrawal
The mean ratio of the flies that stay in the middle during the experiments.
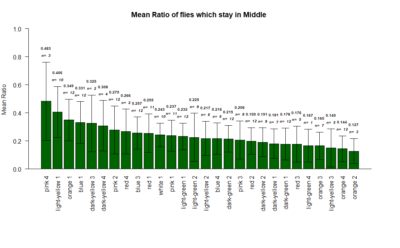
Correlation plot between the mean ratio of the flies that stay in the middle versus the Weighted PIs
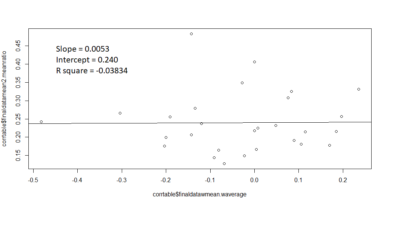
Slope = 0.0053
Intercept = 0.240
R square value = -0.03834
contrary to the expectations, there seems to be no correlation .
Category: lab.brembs.net, neuronal activation, operant self-learning, Optogenetics, R code | No Comments
T-Maze experiments : screen results as on 02-07-2018
on Monday, July 2nd, 2018 2:09 | by Gaia Bianchini

Yellow 1 (Positive Control): Gr28bd-G4, TrpA1-G4
Parameters:
Light: intensity (500 Lux side, 1000 Lux bottom)
frequency = 20Hz
Delay = 1 ms
Duration = 9.9 ms
volts = 6.4