T-maze (dark-light condition) test results
on Monday, December 11th, 2023 2:40 | by Devashree Joglekar
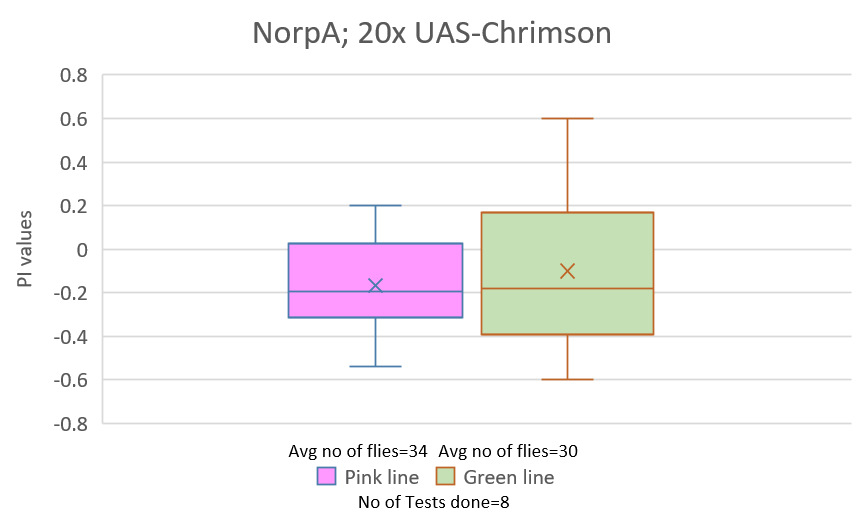
The flies without curly (straight wings) for the line NorpA;20xUAS-Chrimson were tested in T-maze in dark-light conditions. The tests were conducted on 23 November, 27th November, and 29th November 2023. 8 tests were done for each pink and green line; hence a total of 16 tests were conducted. A total of 273 flies and 233 flies were tested for pink line and green line respectively.
Category: temperature_phototaxis | No Comments
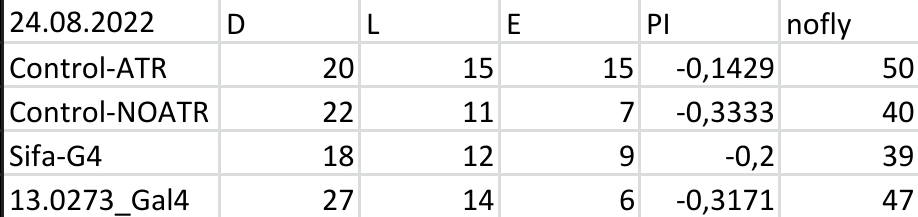
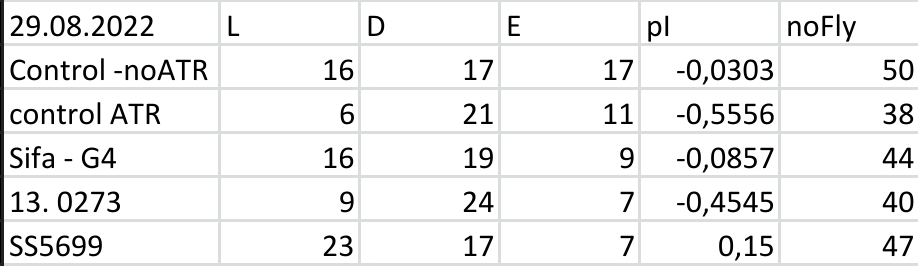
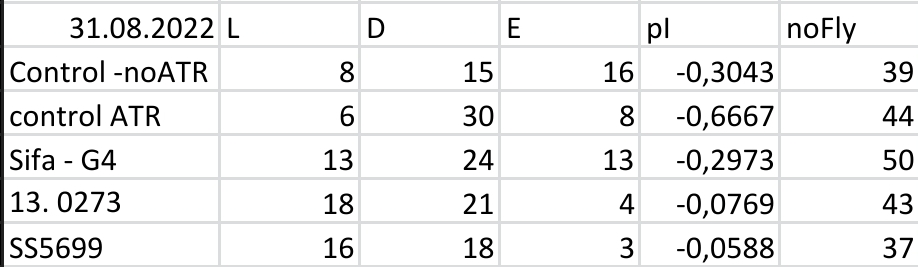
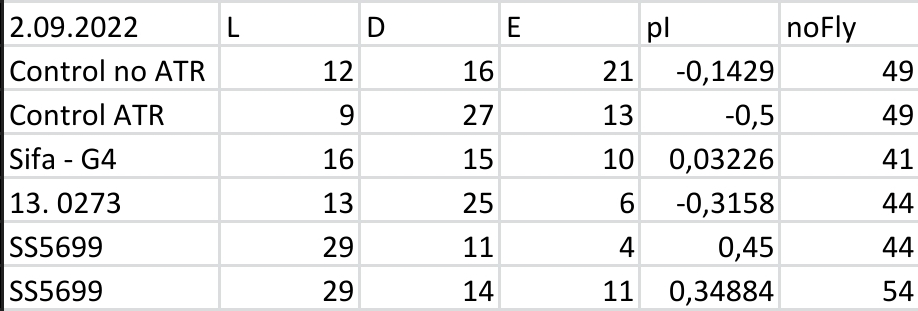
Aslıhan Enes Red Light T-Maze Results
on Monday, September 5th, 2022 10:15 | by Aslihan Dilara Gülay
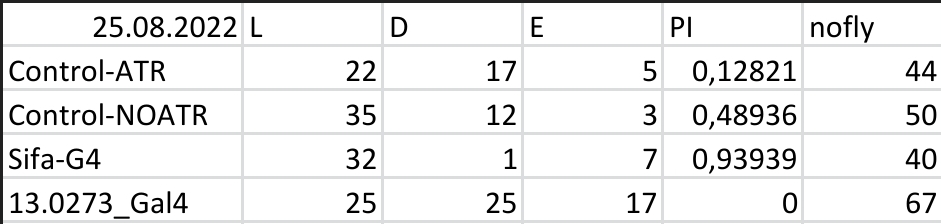
Results for Red Light T-Maze experiments.
Category: Optogenetics | 1 Comment
Aslıhan Enes Yellow Light T-Maze Results
on Monday, September 5th, 2022 10:12 | by Aslihan Dilara Gülay
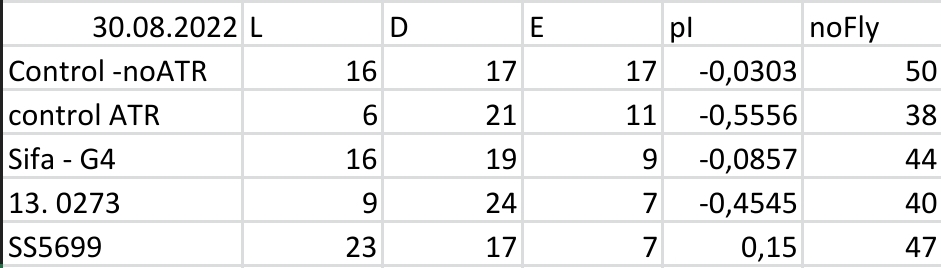
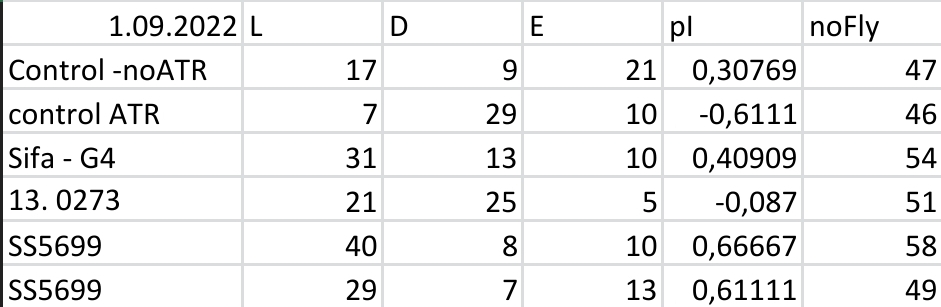
Results for Yellow Light T-Maze experiments.
Category: Optogenetics | No Comments
T-maze with yellow and red lights
on Wednesday, August 11th, 2021 10:02 | by Parva Nasimi
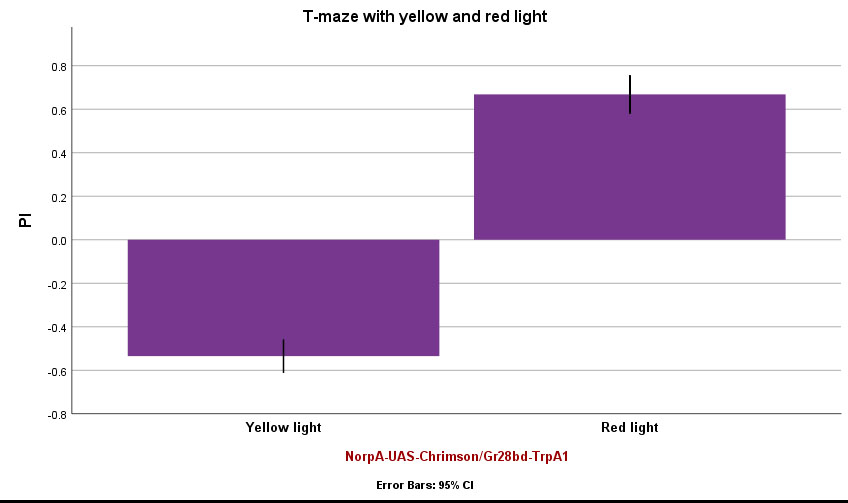
T-maze experiment with yellow and red lights. Graph shows “Mean Performance Index” for NorpA-UAS-Chrimson/Gr28bd-TrpA1 Flies. Comparison between yellow and red lights. Flies were given ATR-treated foods for 2day (n=10).
Category: Uncategorized | No Comments
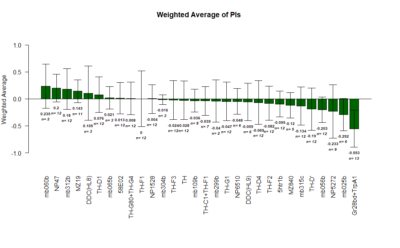
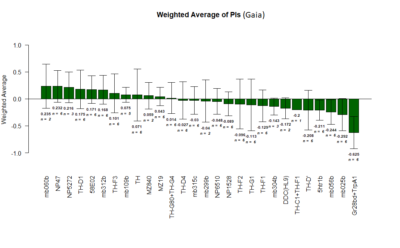
Role of dopaminergic neurons in operant behaviour
on Friday, July 27th, 2018 3:54 | by Gaia Bianchini
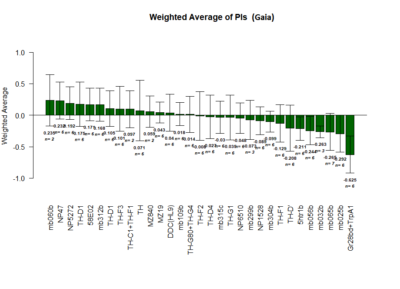
Positive Control: Gr28bd-G4, TrpA1-G4
Parameters: Light: intensity (500 Lux side, 1000 Lux bottom); frequency = 20Hz; Delay = 1 ms; Duration = 9.9 ms; volts = 6.4
Red lines: completed
mb025b: not selected against tubby
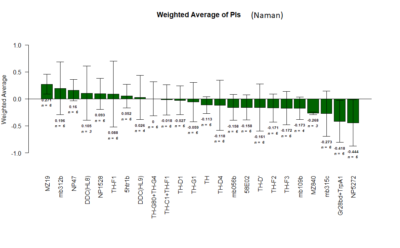
The Tmaze Experiments : Screen results as on 22-7-18
on Sunday, July 22nd, 2018 6:41 | by Naman Agrawal
Yellow 1 (Positive Control): Gr28bd-G4, TrpA1-G4
Parameters: Light: intensity (500 Lux side, 1000 Lux bottom); frequency = 20Hz; Delay = 1 ms; Duration = 9.9 ms; volts = 6.4
Category: neuronal activation, open science, Operant learning, Optogenetics | No Comments
The T-Maze experiments : Middle analysis and Correlation plot
on Saturday, July 14th, 2018 12:06 | by Naman Agrawal
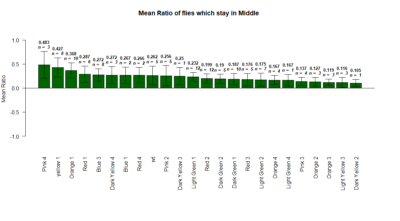
The mean ratio of the flies that stay in the middle during the experiments.
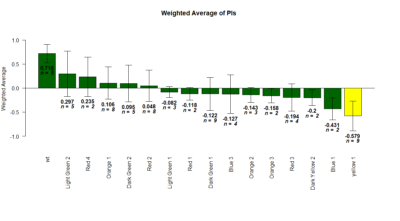
Correlation plot between the mean ratio of the flies that stay in the middle versus the Weighted PIs
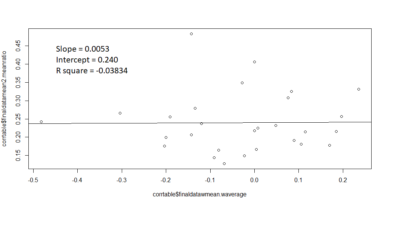
Slope = 0.0053
Intercept = 0.240
R square value = -0.03834
contrary to the expectations, there seems to be no correlation .
Category: lab.brembs.net, neuronal activation, operant self-learning, Optogenetics, R code | No Comments
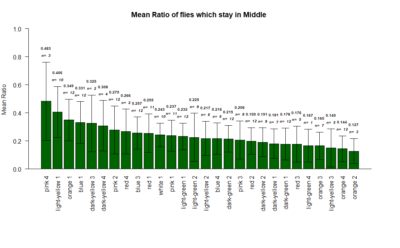
Tmaze Exploratory analysis : Middle Flies
on Monday, July 2nd, 2018 2:08 | by Naman Agrawal
plotting the mean ratio of flies which stay in the middle during experiment.
Yellow 1 (Positive Control): Gr28bd-G4, TrpA1-G4
Parameters:
Light: intensity (500 Lux side, 1000 Lux bottom)
frequency = 20Hz
Delay = 1 ms
Duration = 9.9 ms
volts = 6.4
Category: genetics, neuronal activation, open science, Optogenetics | No Comments
T-Maze experiments : screen results as on 25-06-2018
on Monday, June 25th, 2018 1:13 | by Naman Agrawal
Yellow 1 (Positive Control): Gr28bd-G4, TrpA1-G4
Parameters:
Light: intensity (500 Lux side, 1000 Lux bottom)
frequency = 20Hz
Delay = 1 ms
Duration = 9.9 ms
volts = 6.4
Category: genetics, lab.brembs.net, neuronal activation, open science, Operant learning, Optogenetics | No Comments
Initial screen results
on Monday, June 18th, 2018 1:15 | by Gaia Bianchini
Yellow 1 (Positive Control): Gr28bd-G4, TrpA1-G4
Light: intensity (500 Lux side, 1000 Lux bottom), frequency (20Hz)
Category: crosses, genetics, lab.brembs.net, neuronal activation, open science, Operant learning, Optogenetics | No Comments