T-maze with yellow and red lights
on Wednesday, August 11th, 2021 10:02 | by Parva Nasimi
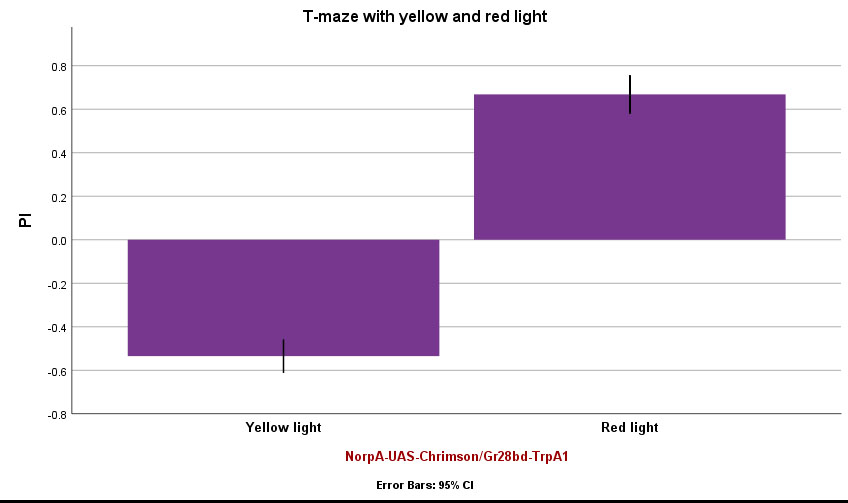
T-maze experiment with yellow and red lights. Graph shows “Mean Performance Index” for NorpA-UAS-Chrimson/Gr28bd-TrpA1 Flies. Comparison between yellow and red lights. Flies were given ATR-treated foods for 2day (n=10).

Category: Uncategorized
Leave a Reply