wiggle difference
on Monday, July 16th, 2018 3:26 | by Saurabh Bedi
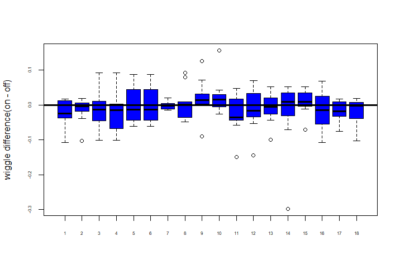
Below is a plot of all the flies of 18 genotypes for the wiggle difference. This is calculated by taking the sum of the difference of the tracepoint for each step. Thus, wiggle = sum(difference in tracepoint at each step). This is done for the entire 20 minutes time.
NOTE: The flies have not yet been separated into 2 categories based on pretest values.
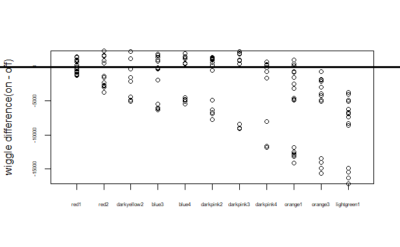
Now we wanted to measure the difference in on wiggle and off wiggle. On wiggle is the wiggle for when the fly was in the part which is supposed to have light on and similarly off wiggle is the wiggle when light is supposed to be off(that is in the portion in which we want to train it to be in). So below is the difference of on wiggle and off wiggle i.e – on wiggle – off wiggle:-
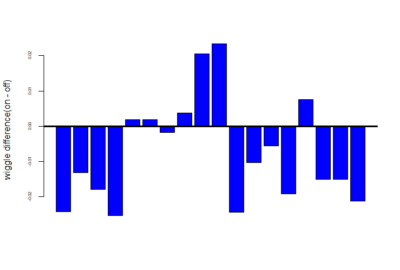
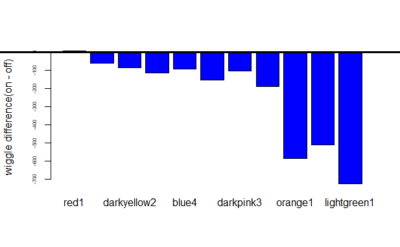
mean of this wiggle difference :-

Category: Operant learning, Optogenetics, Uncategorized | No Comments
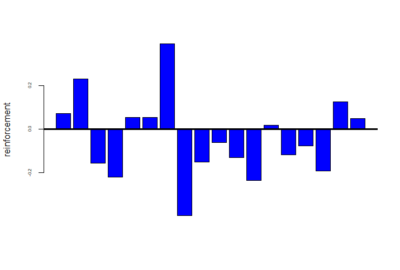
reinforcement(without subtracting pretest)
on Monday, July 16th, 2018 3:22 | by Saurabh Bedi
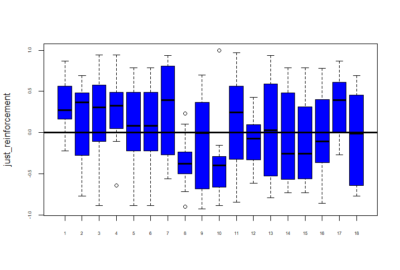
Below is given the plot of effect-sizes of reinforcement of 18 genotypes. On the y-axis are the PI values for learning effect sizes and this is without subtracting the pretest (without normalizing). These scores are calculated by taking the average of PI values of training periods. We are just comparing reinforcement without normalizing with the previous post showing graphs after subtraction of pretest PI’s.
Reinforcement(without normalizing) = mean of training PI values.
Category: Operant learning, Optogenetics, Uncategorized | No Comments
reinforcement(after subtracting pretest)
on Monday, July 16th, 2018 3:18 | by Saurabh Bedi
Below is given the plot of effect-sizes of reinforcement of 18 genotypes. On the y-axis are the PI values for learning effect sizes. These scores are calculated by taking the average of PI values of training periods and then subtracting pretest PI values from it.
Reinforcement scores = mean of training score – pretest PI score
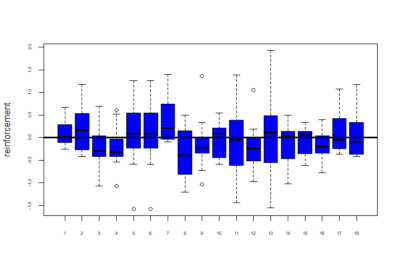
Now below are the mean values of the reinforcements calculated for these 18 genotypes
Category: Operant learning, Optogenetics | No Comments
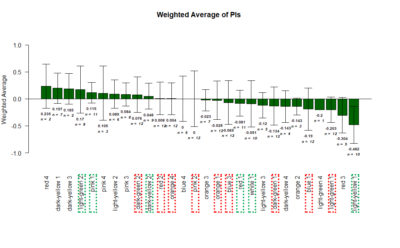
T-Maze experiments : screen results as on 16-07-2018
on Monday, July 16th, 2018 1:32 | by Gaia Bianchini
Results of the T-maze screen analysis, both individual and combined.
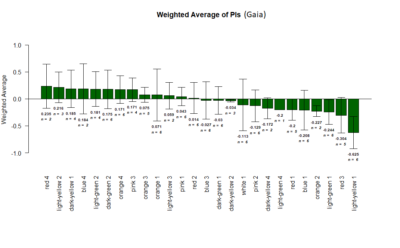
Yellow 1 (Positive Control): Gr28bd-G4, TrpA1-G4
Parameters: Light: intensity (500 Lux side, 1000 Lux bottom); frequency = 20Hz; Delay = 1 ms; Duration = 9.9 ms; volts = 6.4
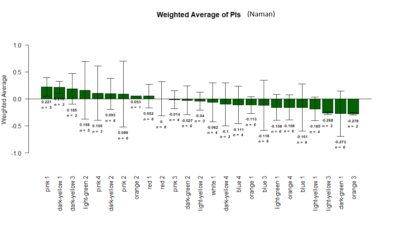
The T-Maze experiments : Middle analysis and Correlation plot
on Saturday, July 14th, 2018 12:06 | by Naman Agrawal
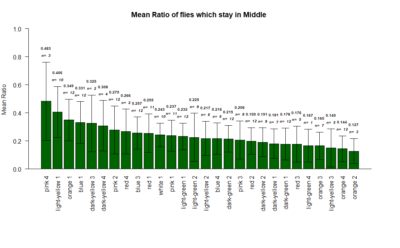
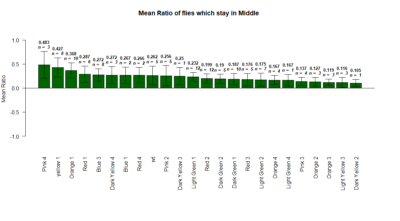
The mean ratio of the flies that stay in the middle during the experiments.
Correlation plot between the mean ratio of the flies that stay in the middle versus the Weighted PIs
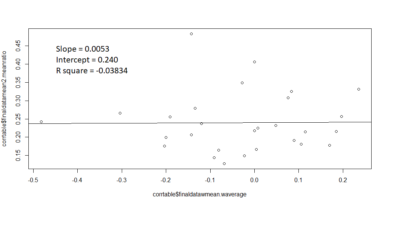
Slope = 0.0053
Intercept = 0.240
R square value = -0.03834
contrary to the expectations, there seems to be no correlation .
Category: lab.brembs.net, neuronal activation, operant self-learning, Optogenetics, R code | No Comments
wiggle
on Monday, July 2nd, 2018 2:46 | by Saurabh Bedi
Below is a plot of all the flies of 11 genotypes for the wiggle difference. This is calculated by taking the sum of the difference of the tracepoint for each step. Thus, wiggle = sum(difference in tracepoint at each step). This is done for the entire 20 minutes time.
Now we wanted to measure the difference in on wiggle and off wiggle. On wiggle is the wiggle for when the fly was in the part which is supposed to have light on and similarly off wiggle is the wiggle when light is supposed to be off(that is in the portion in which we want to train it to be in). So below is the difference of on wiggle and off wiggle i.e – on wiggle – off wiggle:-
Now means of the difference in wiggle:-
Category: Operant learning, Optogenetics | No Comments
reinforcement(plot)
on Monday, July 2nd, 2018 2:36 | by Saurabh Bedi
Below is given the plot of effect-sizes of reinforcement of 11 genotypes. On the y-axis are the PI values for learning effect sizes. These scores are calculated by taking the average of PI values of training periods and then subtracting pretest PI value from it. 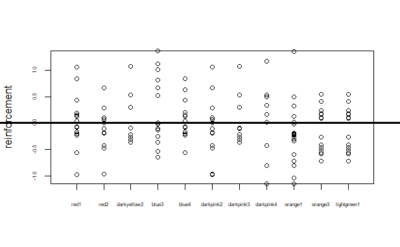
Category: Operant learning, Optogenetics | No Comments
T-Maze experiments : screen results as on 02-07-2018
on Monday, July 2nd, 2018 2:09 | by Gaia Bianchini

Yellow 1 (Positive Control): Gr28bd-G4, TrpA1-G4
Parameters:
Light: intensity (500 Lux side, 1000 Lux bottom)
frequency = 20Hz
Delay = 1 ms
Duration = 9.9 ms
volts = 6.4
Tmaze Exploratory analysis : Middle Flies
on Monday, July 2nd, 2018 2:08 | by Naman Agrawal
plotting the mean ratio of flies which stay in the middle during experiment.
Yellow 1 (Positive Control): Gr28bd-G4, TrpA1-G4
Parameters:
Light: intensity (500 Lux side, 1000 Lux bottom)
frequency = 20Hz
Delay = 1 ms
Duration = 9.9 ms
volts = 6.4
Category: genetics, neuronal activation, open science, Optogenetics | No Comments
More on valence inference
on Monday, July 2nd, 2018 2:00 | by Christian Rohrsen
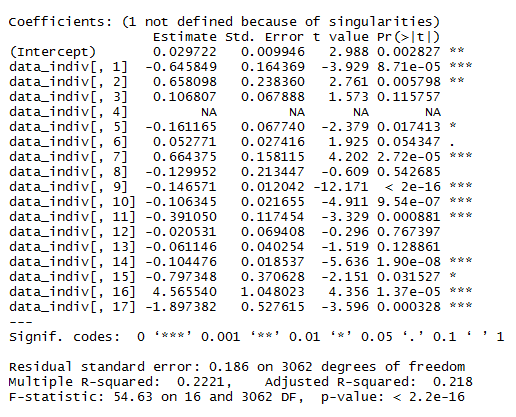
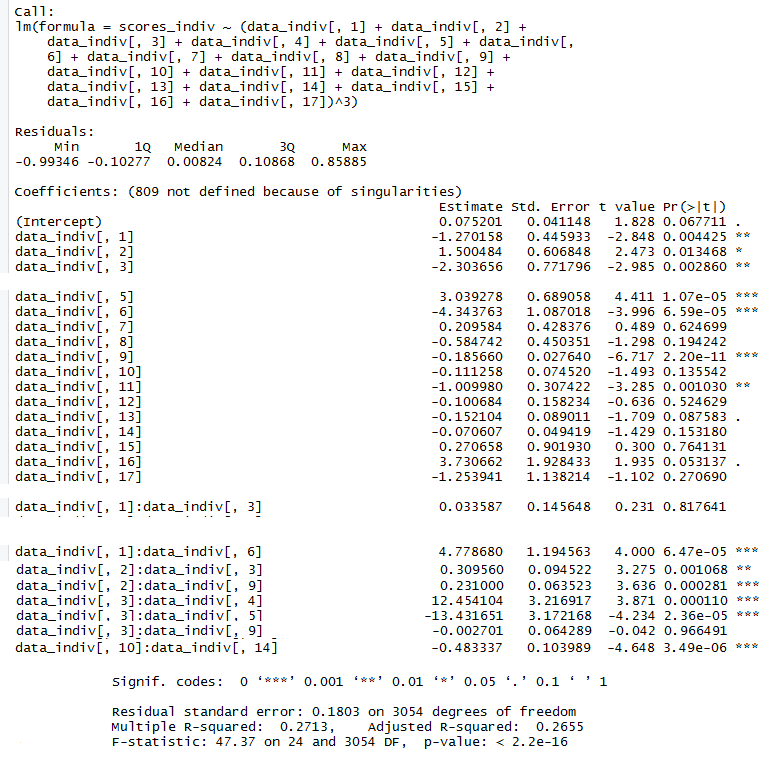
This is the linear model with its statistics
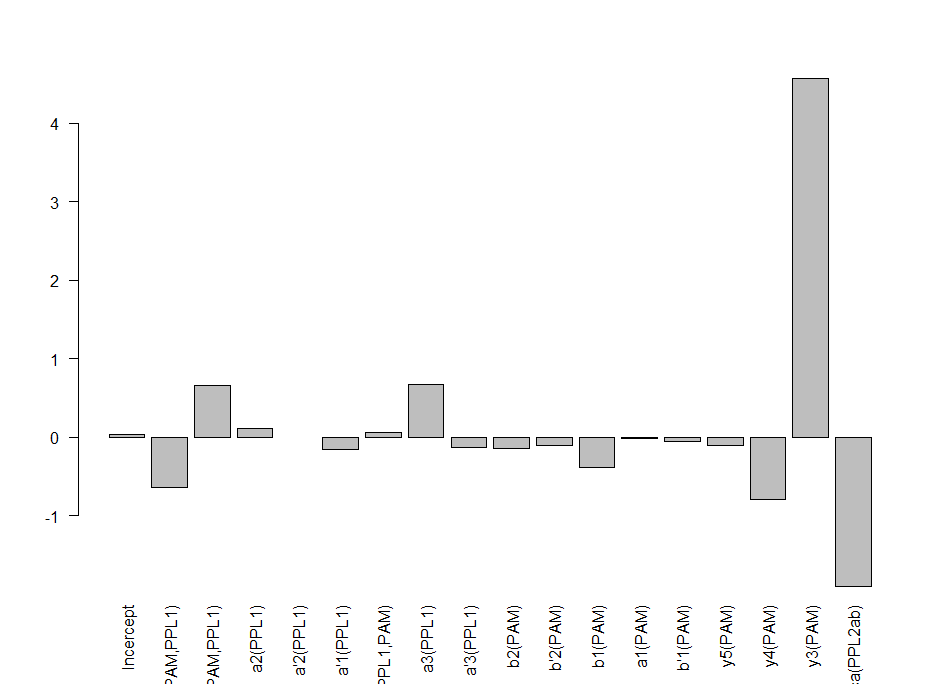
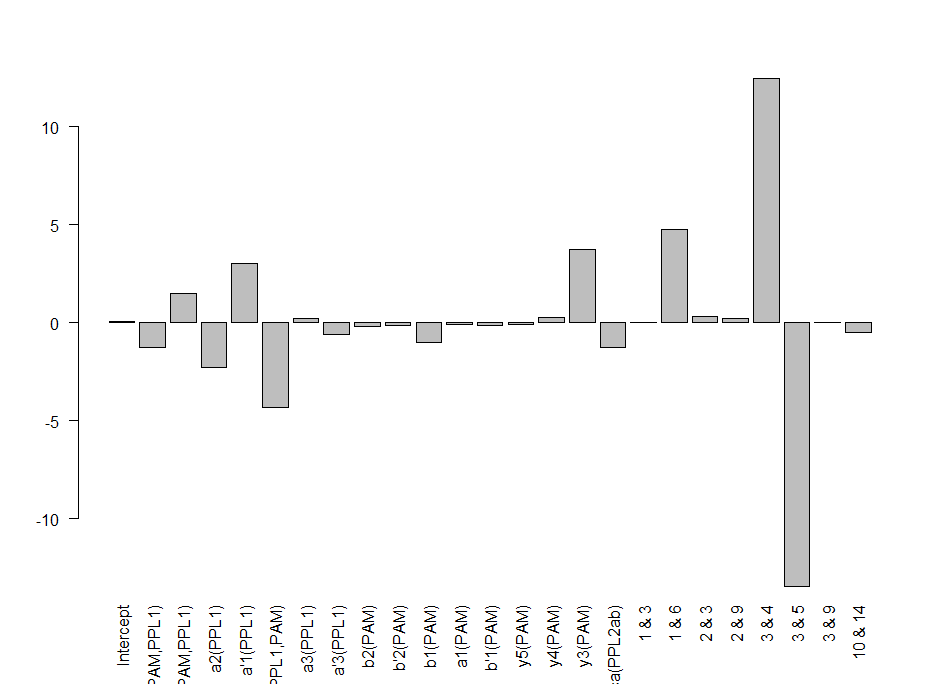
This is the linear model adding interactions. It is perfectly possible to have interactions between neurons, kind of what occurs with olfactory processing where ORNs activated alone or in different combinations have completely different meanings
I uploaded in slack the bayesian linear model with interactions. For any reason, it does not let me upload it now to the website

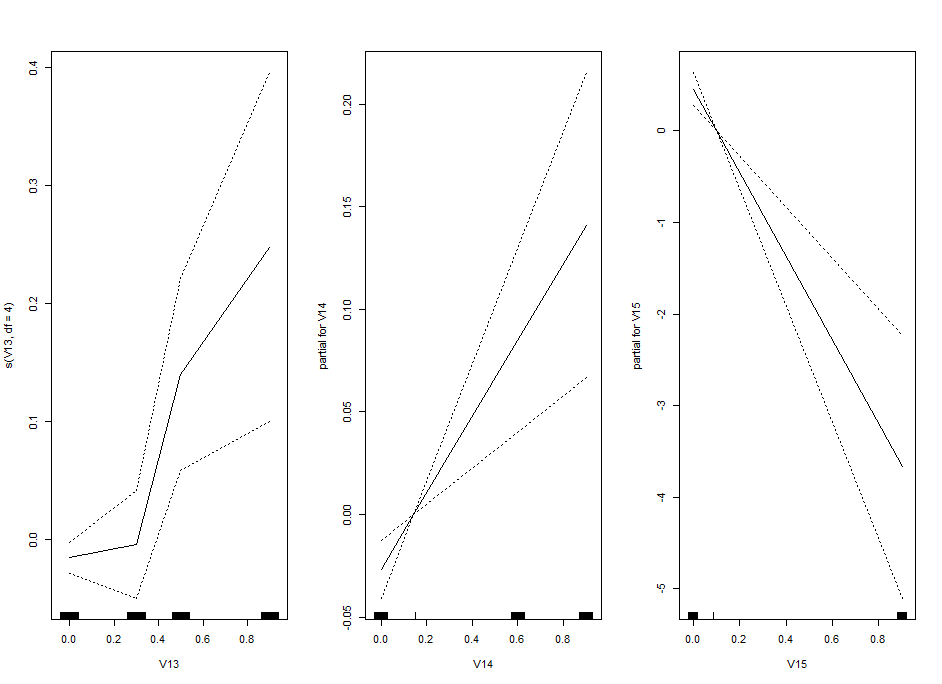
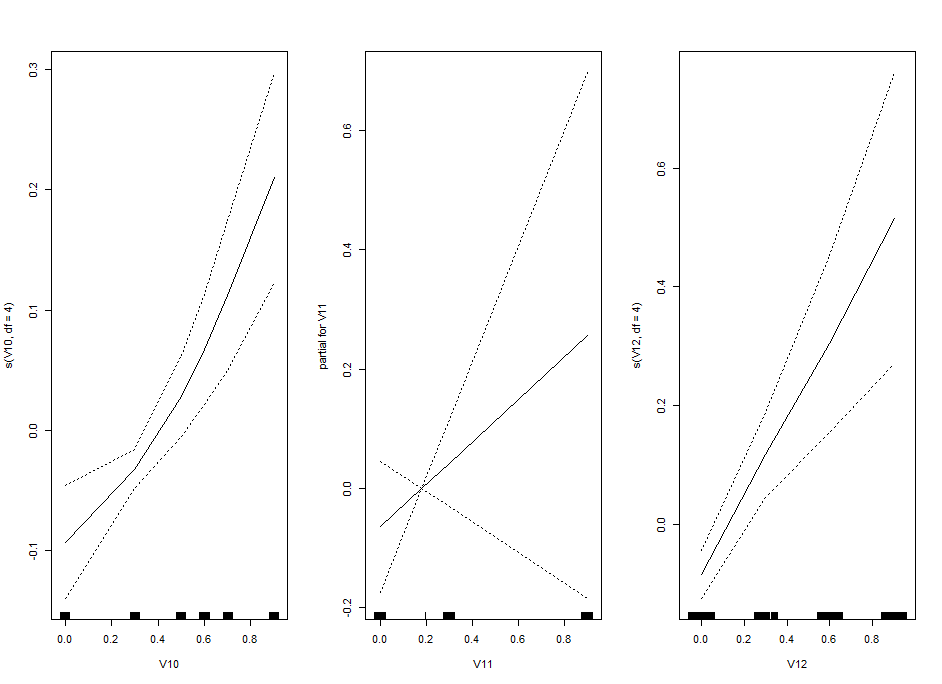
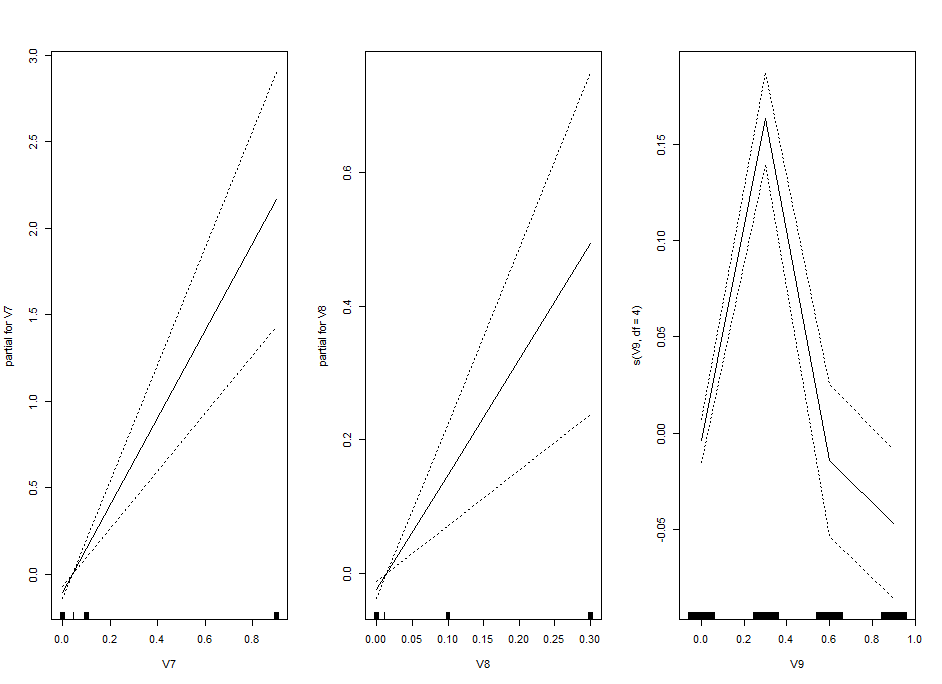
I am trying one of the ways of nonlinear models: GAM (Generalized additive models). Here one fit splines to the effects to certain degrees of freedom.
This is the kind of bar graphs I thought I could use for all the plots.

Category: neuronal activation, Operant reinforcment, Optogenetics | No Comments