reinforcement(without subtracting pretest)
on Monday, July 16th, 2018 3:22 | by Saurabh Bedi
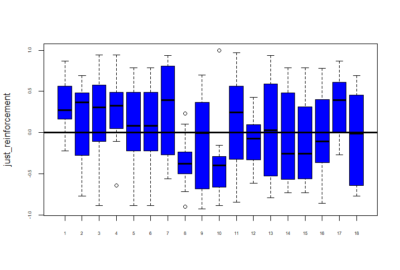
Below is given the plot of effect-sizes of reinforcement of 18 genotypes. On the y-axis are the PI values for learning effect sizes and this is without subtracting the pretest (without normalizing). These scores are calculated by taking the average of PI values of training periods. We are just comparing reinforcement without normalizing with the previous post showing graphs after subtraction of pretest PI’s.
Reinforcement(without normalizing) = mean of training PI values.

Category: Operant learning, Optogenetics, Uncategorized | No Comments
reinforcement(after subtracting pretest)
on Monday, July 16th, 2018 3:18 | by Saurabh Bedi
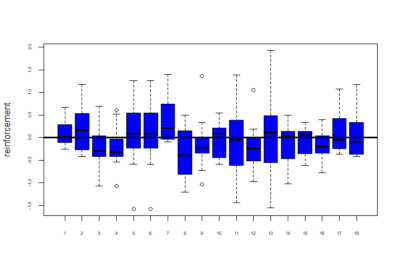
Below is given the plot of effect-sizes of reinforcement of 18 genotypes. On the y-axis are the PI values for learning effect sizes. These scores are calculated by taking the average of PI values of training periods and then subtracting pretest PI values from it.
Reinforcement scores = mean of training score – pretest PI score
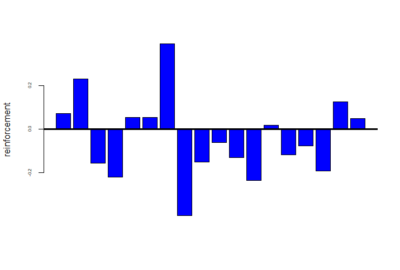
Now below are the mean values of the reinforcements calculated for these 18 genotypes
Category: Operant learning, Optogenetics | No Comments
T-Maze experiments : screen results as on 16-07-2018
on Monday, July 16th, 2018 1:32 | by Gaia Bianchini
Results of the T-maze screen analysis, both individual and combined.
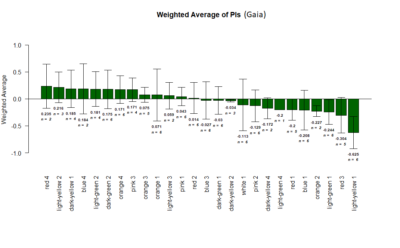
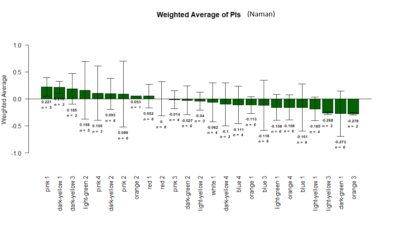
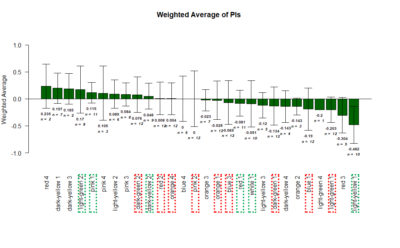
Yellow 1 (Positive Control): Gr28bd-G4, TrpA1-G4
Parameters: Light: intensity (500 Lux side, 1000 Lux bottom); frequency = 20Hz; Delay = 1 ms; Duration = 9.9 ms; volts = 6.4
wiggle
on Monday, July 2nd, 2018 2:46 | by Saurabh Bedi
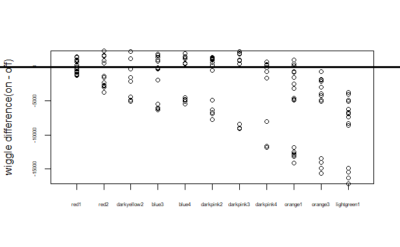
Below is a plot of all the flies of 11 genotypes for the wiggle difference. This is calculated by taking the sum of the difference of the tracepoint for each step. Thus, wiggle = sum(difference in tracepoint at each step). This is done for the entire 20 minutes time.
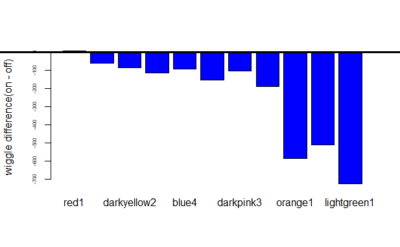
Now we wanted to measure the difference in on wiggle and off wiggle. On wiggle is the wiggle for when the fly was in the part which is supposed to have light on and similarly off wiggle is the wiggle when light is supposed to be off(that is in the portion in which we want to train it to be in). So below is the difference of on wiggle and off wiggle i.e – on wiggle – off wiggle:-
Now means of the difference in wiggle:-
Category: Operant learning, Optogenetics | No Comments
reinforcement(plot)
on Monday, July 2nd, 2018 2:36 | by Saurabh Bedi
Below is given the plot of effect-sizes of reinforcement of 11 genotypes. On the y-axis are the PI values for learning effect sizes. These scores are calculated by taking the average of PI values of training periods and then subtracting pretest PI value from it. 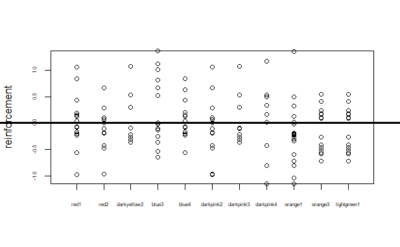
Category: Operant learning, Optogenetics | No Comments
T-Maze experiments : screen results as on 02-07-2018
on Monday, July 2nd, 2018 2:09 | by Gaia Bianchini

Yellow 1 (Positive Control): Gr28bd-G4, TrpA1-G4
Parameters:
Light: intensity (500 Lux side, 1000 Lux bottom)
frequency = 20Hz
Delay = 1 ms
Duration = 9.9 ms
volts = 6.4
Reinforcement scores for 8 genotypes
on Monday, June 25th, 2018 2:08 | by Saurabh Bedi
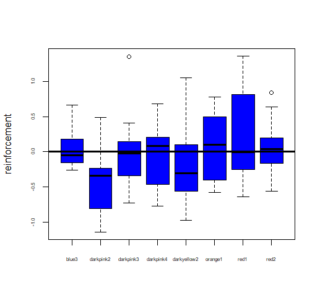
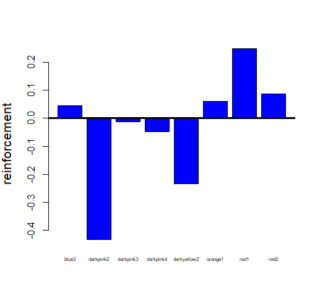
We wanted to measure learning and reinforcement in the flies for eight genotypes that we have tested as of now. For calculating the reinforcement scores we took the average of the two training periods combined PI scores and then subtract the PI value of the pretest period.
Reinforcement = average (combined training PI) – (combined pretest PI)
Below is the boxplot of the effect size for each fly for all these genotypes:-
We then calculated the mean of these reinforcement values for each of the screens and below is a bargraph for these means:-
Category: Operant learning, Optogenetics | No Comments
orange1(genotype)-PI Barplot
on Monday, June 25th, 2018 1:54 | by Saurabh Bedi
Our experiments are performed after blinding ie we do not know the genotype of the flies tested. Code for this line is Orange1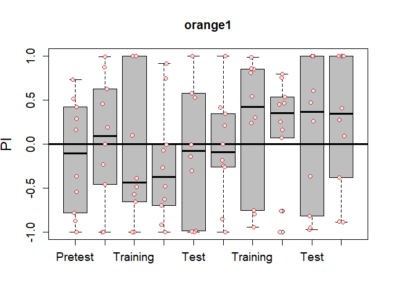 . Intensity was approximately 400 Lux. The frequency of yellow light was 20Hz with 50:50 duty cycle.
Category: Operant learning, Optogenetics | No Comments
Graph for Darkpink4
on Monday, June 25th, 2018 1:37 | by Avani Koparkar
Our experiments are performed after blinding ie we do not know the genotype of the flies tested. Code for this line is Darkpink4. Intensity was approximately 400 Lux. The frequency of yellow light was 20Hz with 50:50 duty cycle.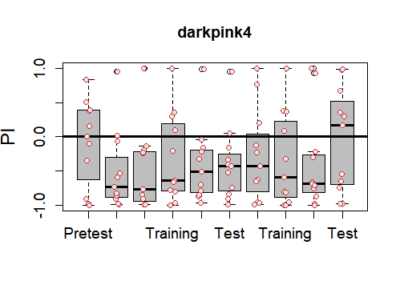
Category: Operant learning, Optogenetics | No Comments
Graph for Darkpink3
on Monday, June 25th, 2018 1:35 | by Avani Koparkar
Our experiments are performed after blinding ie we do not know the genotype of the flies tested. Code for this line is Darkpink3. Intensity was approximately 400 Lux. The frequency of yellow light was 20Hz with 50:50 duty cycle.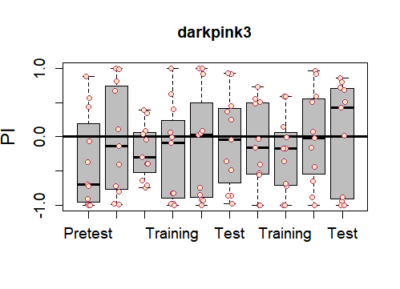
Category: Operant learning, Optogenetics | No Comments