Graph for Darkpink2
on Monday, June 25th, 2018 1:34 | by Avani Koparkar
Our experiments are performed after blinding ie we do not know the genotype of the flies tested. Code for this line is Darkpink2. Intensity was approximately 400 Lux. The frequency of yellow light was 20Hz with 50:50 duty cycle.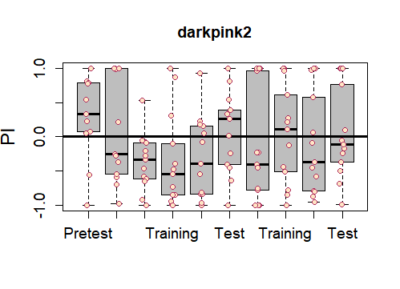

Category: Operant learning, Optogenetics | No Comments
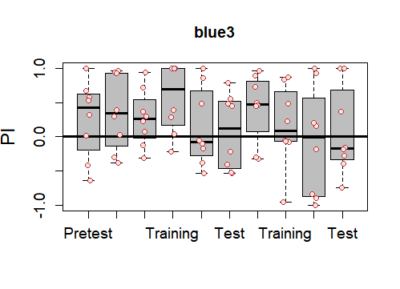
Graph for blue3
on Monday, June 25th, 2018 1:33 | by Avani Koparkar
Category: Operant learning, Optogenetics | No Comments
T-Maze experiments : screen results as on 25-06-2018
on Monday, June 25th, 2018 1:13 | by Naman Agrawal
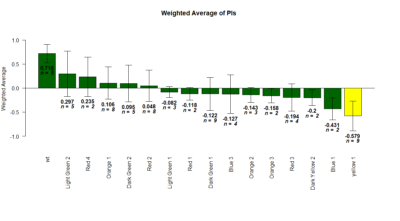
Yellow 1 (Positive Control): Gr28bd-G4, TrpA1-G4
Parameters:
Light: intensity (500 Lux side, 1000 Lux bottom)
frequency = 20Hz
Delay = 1 ms
Duration = 9.9 ms
volts = 6.4
Category: genetics, lab.brembs.net, neuronal activation, open science, Operant learning, Optogenetics | No Comments
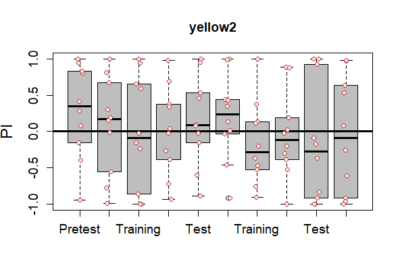
Graph for darkyellow2
on Monday, June 18th, 2018 1:47 | by Avani Koparkar
Our experiments are performed after blinding ie we do not know the genotype of the flies tested. Code for this line is Yellow2. Intensity was approximately 400 Lux. The frequency of yellow light was 20Hz with 50:50 duty cycle.
Category: Operant learning, Optogenetics | No Comments
Graph for Red2
on Monday, June 18th, 2018 1:44 | by Avani Koparkar
Our experiments are performed after blinding ie we do not know the genotype of the flies tested. Code for this line is Red2. Intensity was approximately 400 Lux. The frequency of yellow light was 20Hz with 50:50 duty cycle.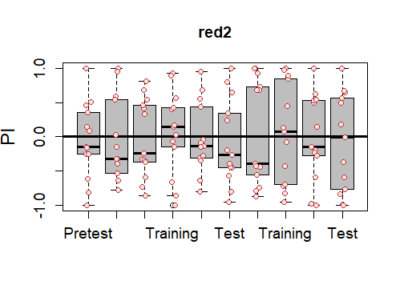
Category: Operant learning, Optogenetics | No Comments
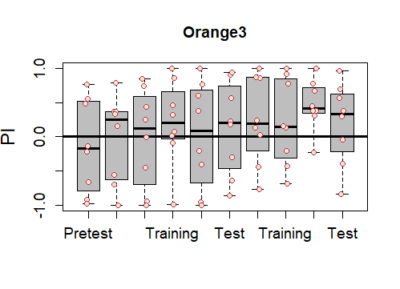
Graph for Orange3
on Monday, June 18th, 2018 1:42 | by Avani Koparkar
Our experiments are performed after blinding ie we do not know the genotype of the flies tested. Code for this line is Orange3. Intensity was approximately 400 Lux. The frequency of yellow light was 20Hz with 50:50 duty cycle.
Category: Operant learning, Optogenetics | No Comments
Initial screen results
on Monday, June 18th, 2018 1:15 | by Gaia Bianchini
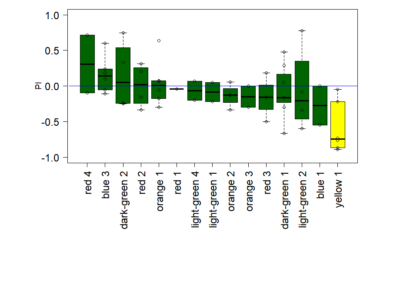
Yellow 1 (Positive Control): Gr28bd-G4, TrpA1-G4
Light: intensity (500 Lux side, 1000 Lux bottom), frequency (20Hz)
Category: crosses, genetics, lab.brembs.net, neuronal activation, open science, Operant learning, Optogenetics | No Comments
Red 1 Genotype
on Monday, June 18th, 2018 1:07 | by Saurabh Bedi
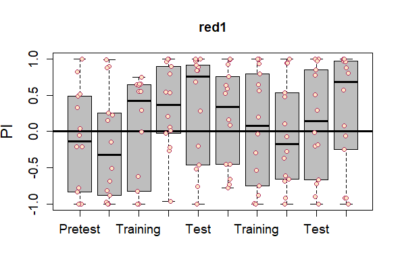
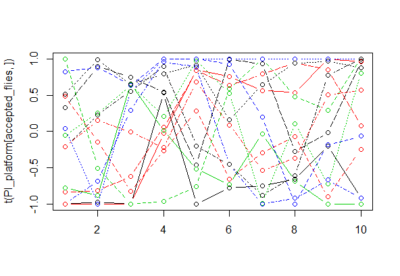
The platform experiment was done with us being blinded. We referred to the genotype as the Red1 Genotype. The light intensity was taken as approximately 400 lux as was decided by previous experiments. The duty cycle was 50:50 at a frequency of 20 Hz.
Category: Operant learning, Optogenetics | No Comments
blue1 combined data
on Monday, June 11th, 2018 1:51 | by Saurabh Bedi
Blue 1 combined PI value plot at 400 lux at 50 per cent duty cycle and 20 Hz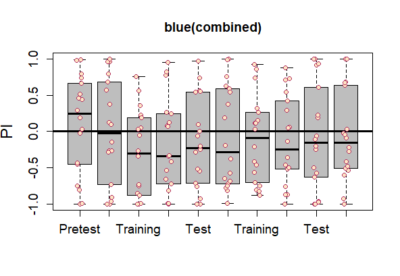
Trajectories of blue 1 flies on drosophila joystick apparatus shown:-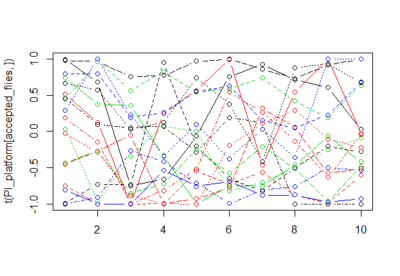
Category: Operant learning, Optogenetics | No Comments
newWTB vs oldWTB
on Monday, May 22nd, 2017 10:37 | by Weitian Sun
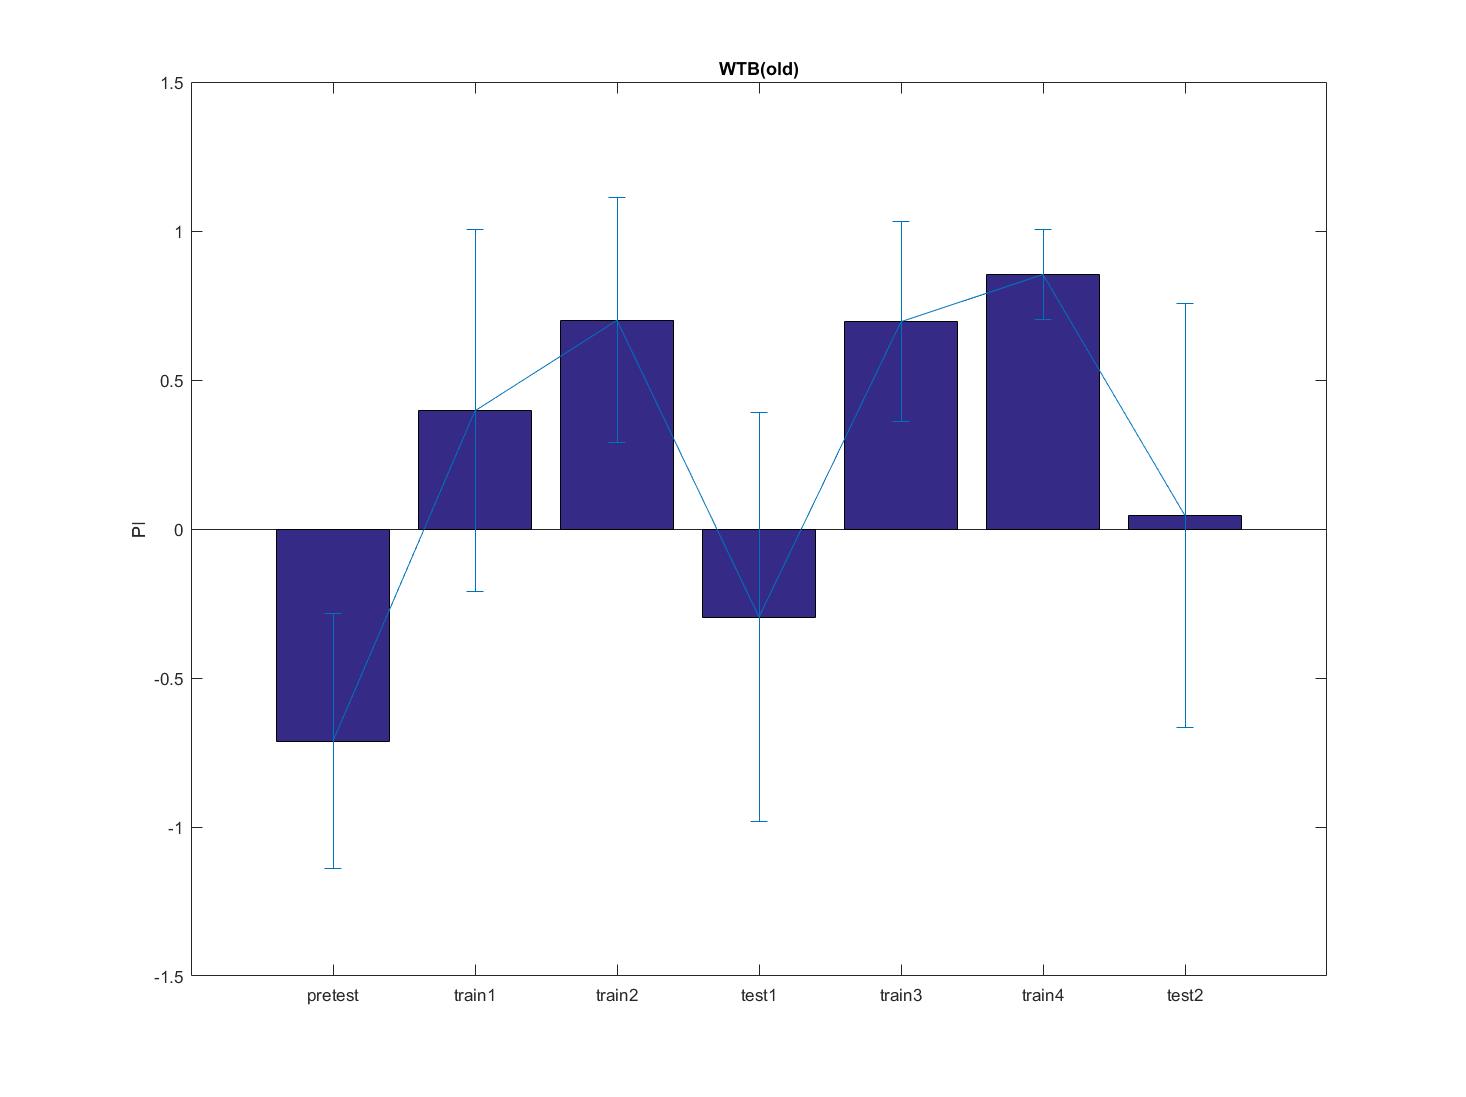
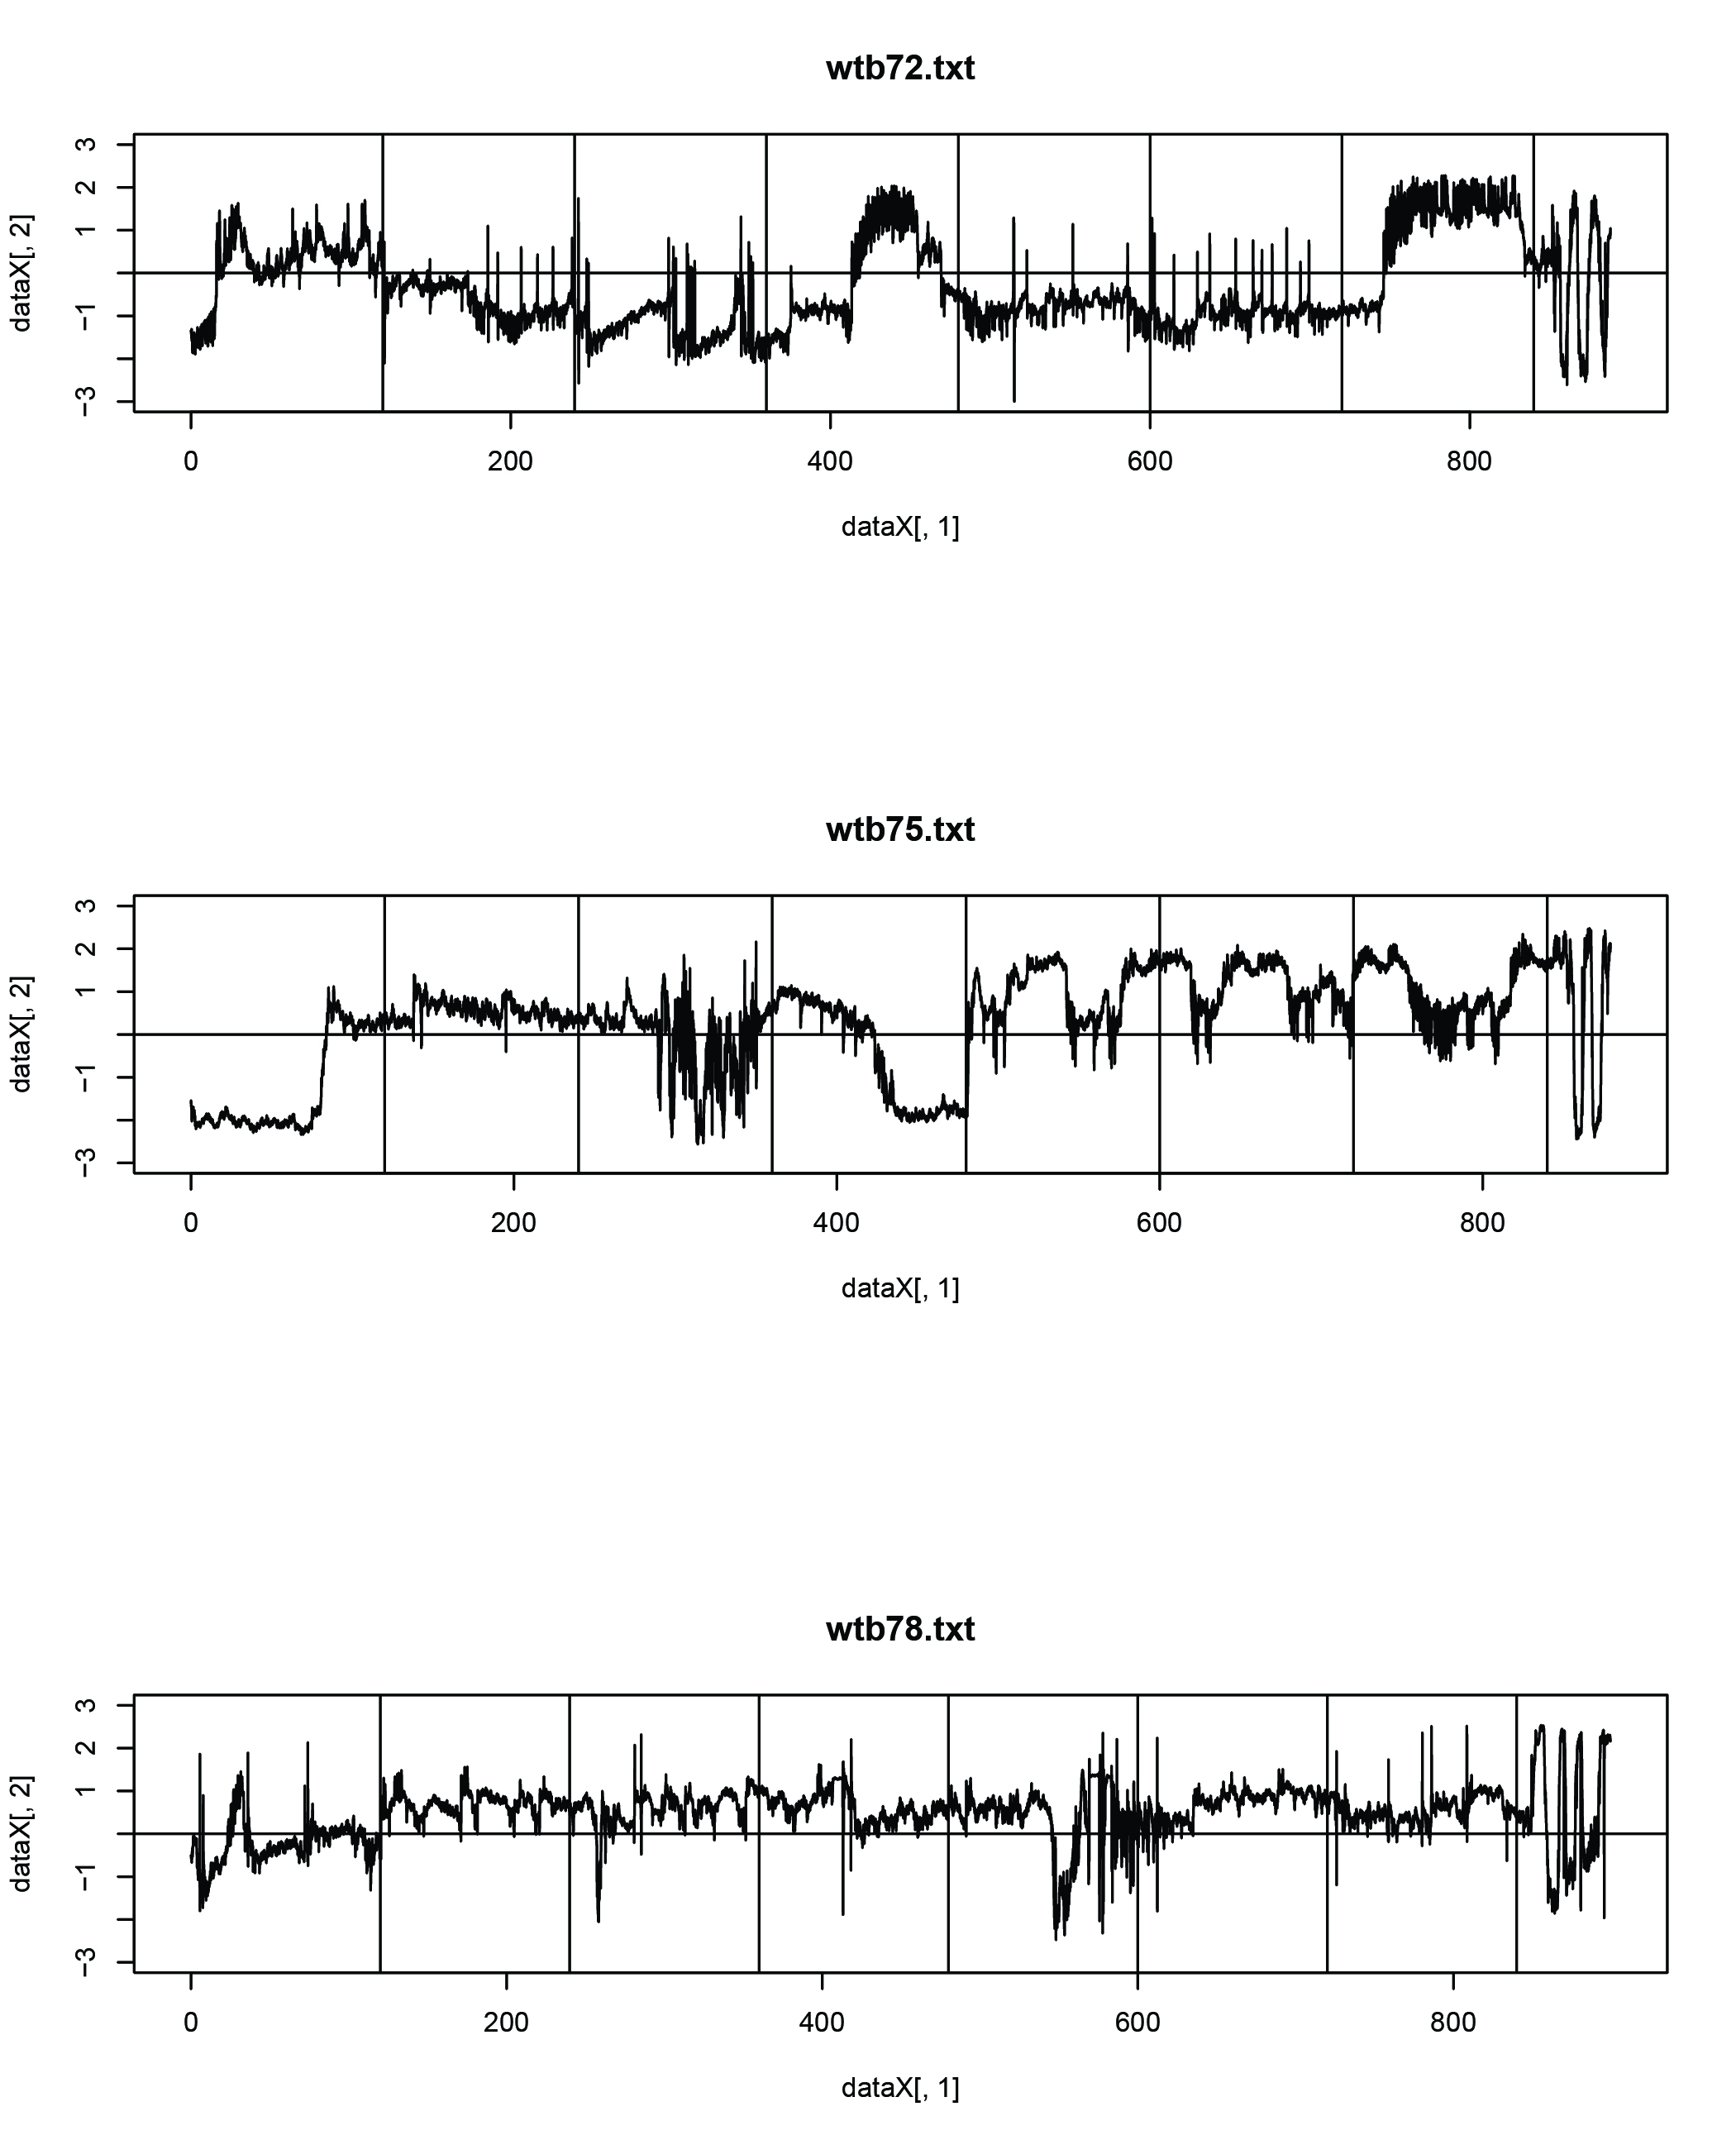
The behavior of new and old WTB seems different, but since only a few flies are tested, the results are not conclusive.
newWTB =3, PI= 0.35
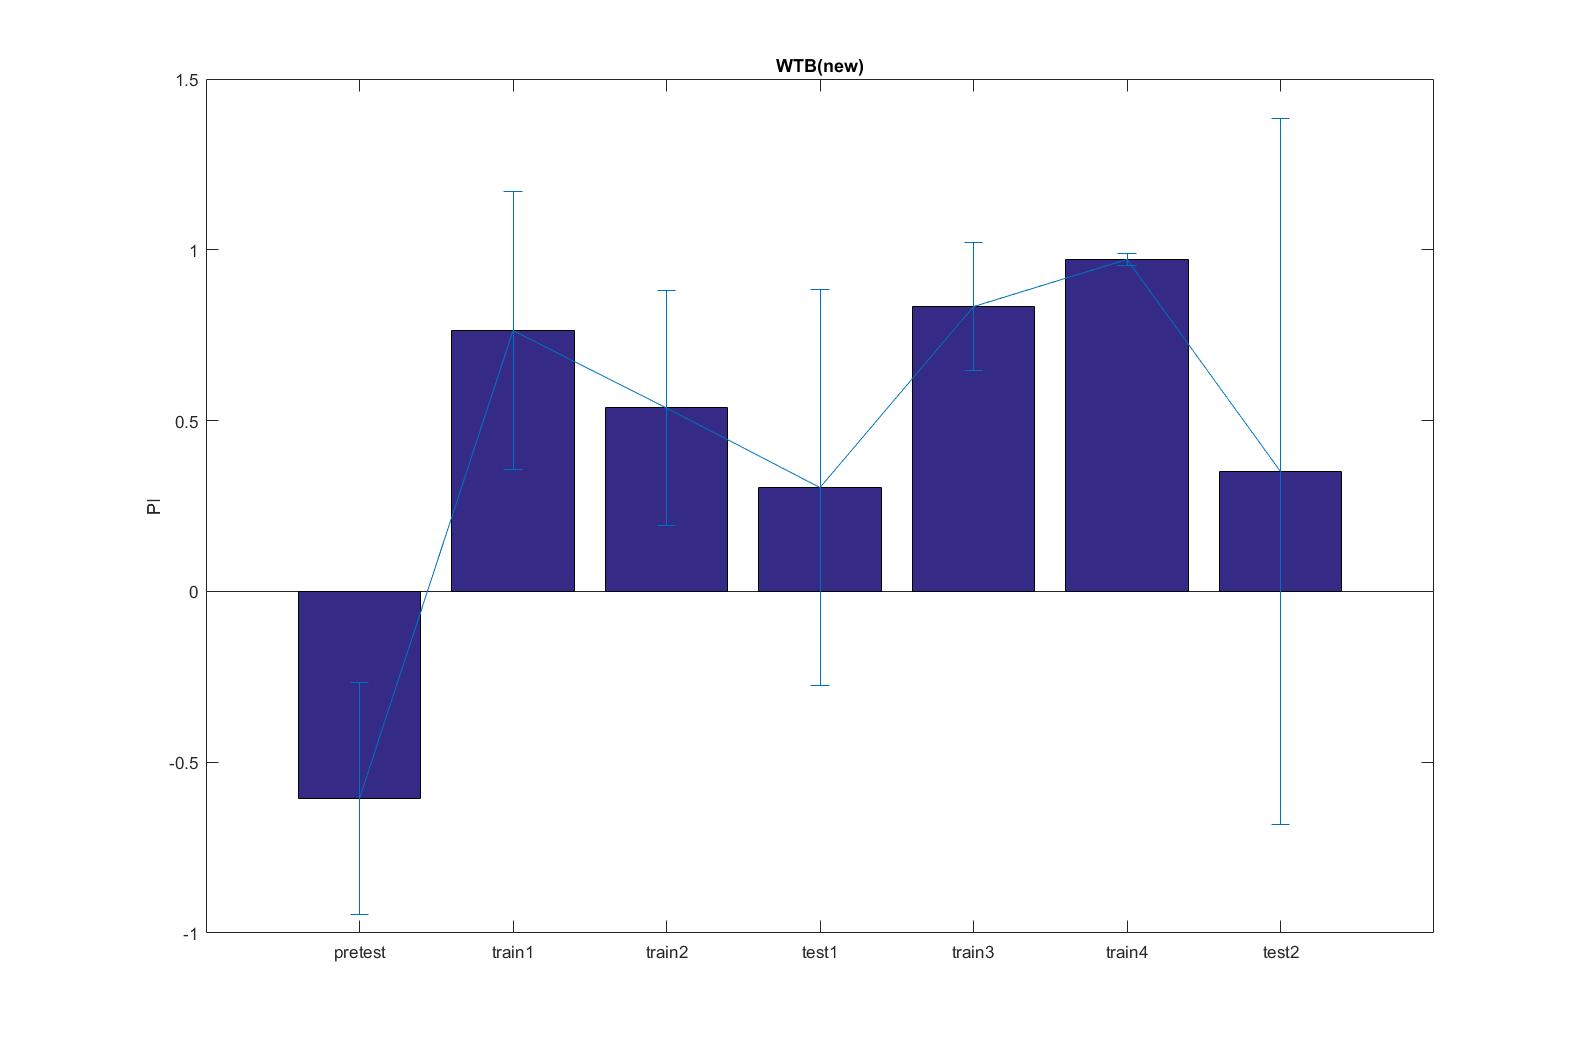
old WTB from last month = 7, PI=0.04
flying trace,
wtb72 (old, left punishment)
wtb 74,78 (new, right punishment)
Category: Operant learning | No Comments