T-Maze experiments : screen results as on 16-07-2018
on Monday, July 16th, 2018 1:32 | by Gaia Bianchini
Results of the T-maze screen analysis, both individual and combined.
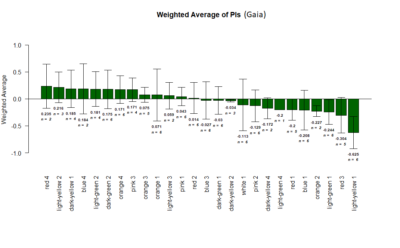
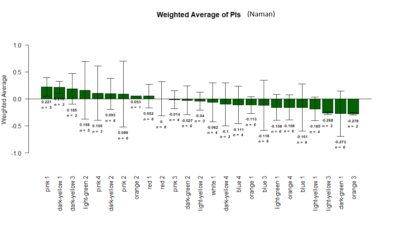
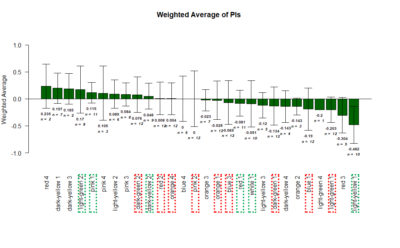
Yellow 1 (Positive Control): Gr28bd-G4, TrpA1-G4
Parameters: Light: intensity (500 Lux side, 1000 Lux bottom); frequency = 20Hz; Delay = 1 ms; Duration = 9.9 ms; volts = 6.4

The T-Maze experiments : Middle analysis and Correlation plot
on Saturday, July 14th, 2018 12:06 | by Naman Agrawal
The mean ratio of the flies that stay in the middle during the experiments.
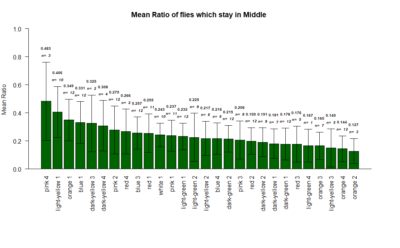
Correlation plot between the mean ratio of the flies that stay in the middle versus the Weighted PIs
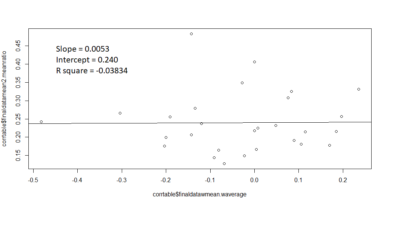
Slope = 0.0053
Intercept = 0.240
R square value = -0.03834
contrary to the expectations, there seems to be no correlation .
Category: lab.brembs.net, neuronal activation, operant self-learning, Optogenetics, R code | No Comments
T-Maze experiments : screen results as on 02-07-2018
on Monday, July 2nd, 2018 2:09 | by Gaia Bianchini

Yellow 1 (Positive Control): Gr28bd-G4, TrpA1-G4
Parameters:
Light: intensity (500 Lux side, 1000 Lux bottom)
frequency = 20Hz
Delay = 1 ms
Duration = 9.9 ms
volts = 6.4
Tmaze Exploratory analysis : Middle Flies
on Monday, July 2nd, 2018 2:08 | by Naman Agrawal
plotting the mean ratio of flies which stay in the middle during experiment.
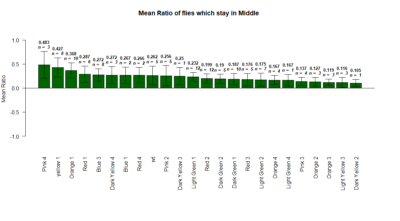
Yellow 1 (Positive Control): Gr28bd-G4, TrpA1-G4
Parameters:
Light: intensity (500 Lux side, 1000 Lux bottom)
frequency = 20Hz
Delay = 1 ms
Duration = 9.9 ms
volts = 6.4
Category: genetics, neuronal activation, open science, Optogenetics | No Comments
More on valence inference
on Monday, July 2nd, 2018 2:00 | by Christian Rohrsen
This is the linear model with its statistics
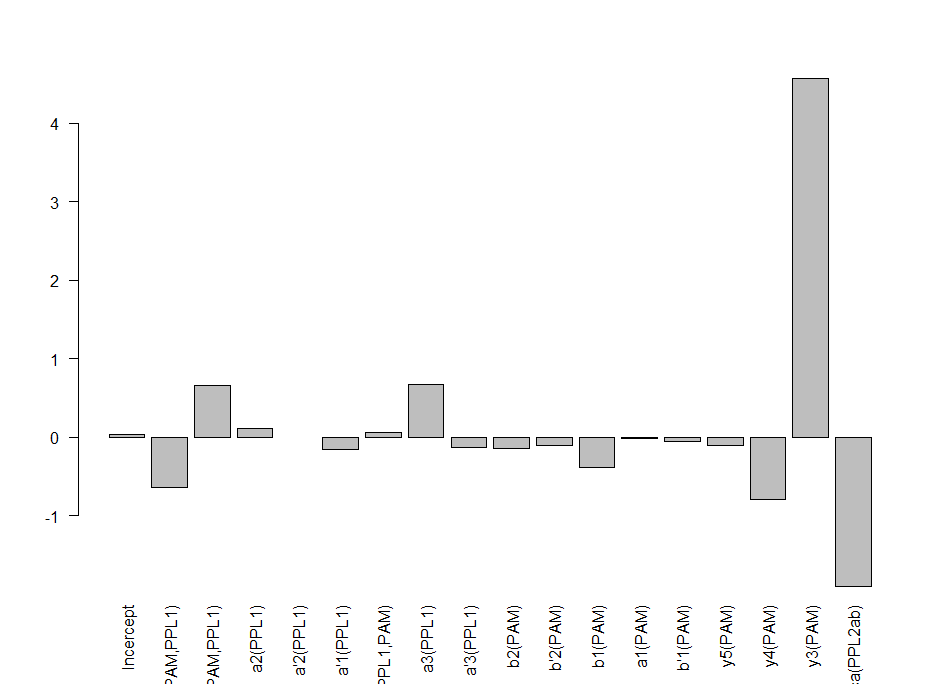
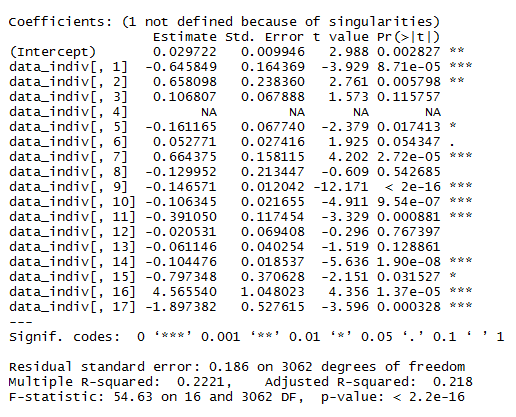
This is the linear model adding interactions. It is perfectly possible to have interactions between neurons, kind of what occurs with olfactory processing where ORNs activated alone or in different combinations have completely different meanings
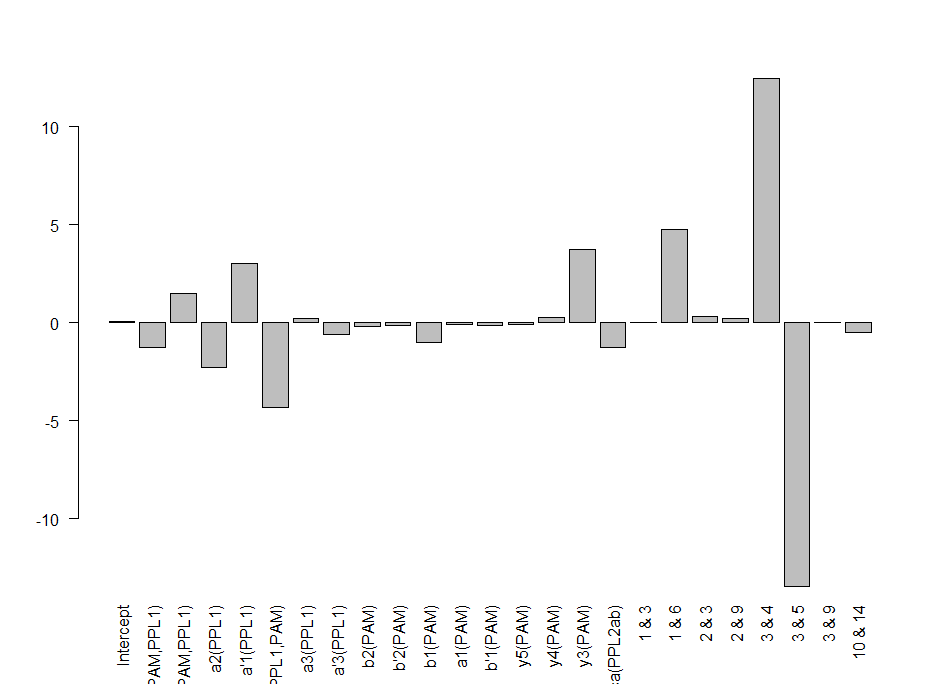
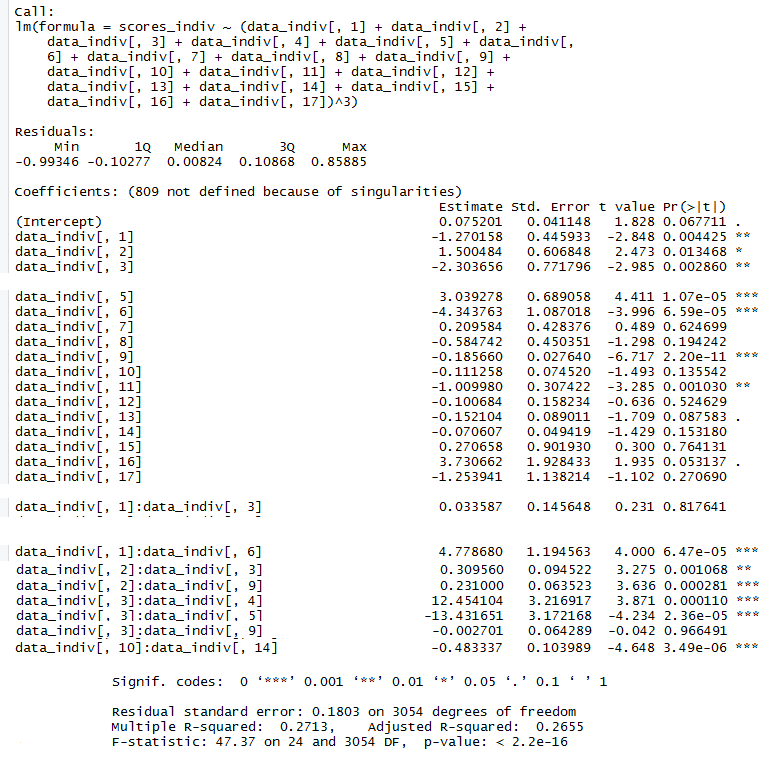
I uploaded in slack the bayesian linear model with interactions. For any reason, it does not let me upload it now to the website

I am trying one of the ways of nonlinear models: GAM (Generalized additive models). Here one fit splines to the effects to certain degrees of freedom.
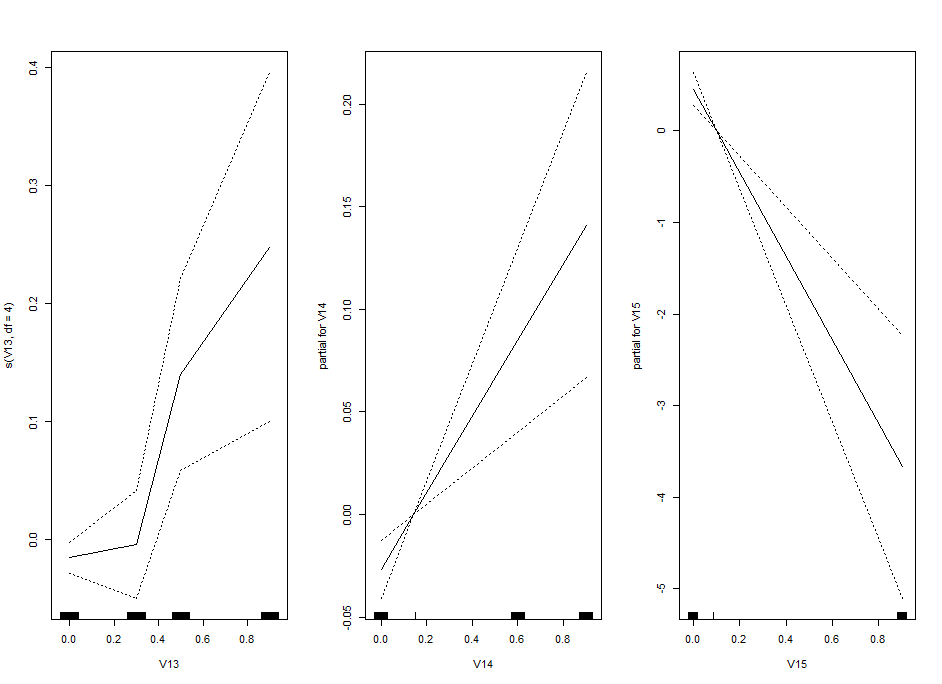
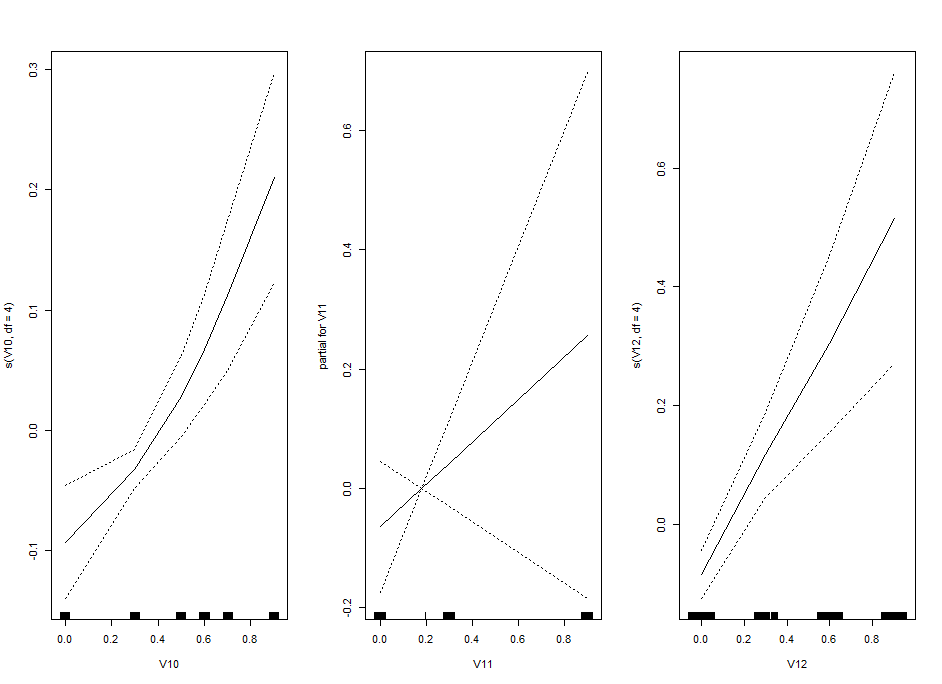
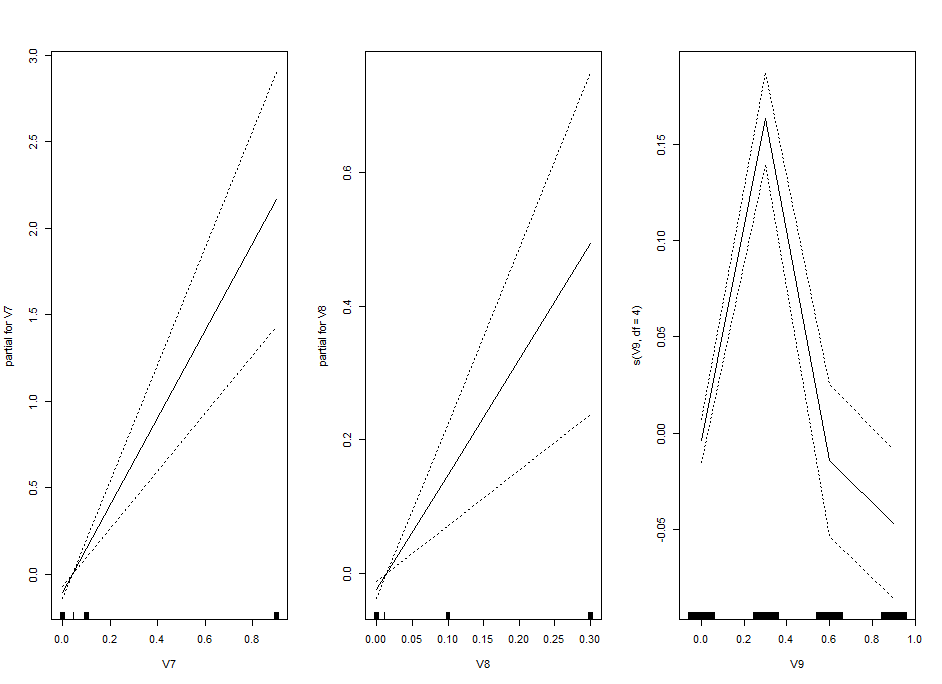
This is the kind of bar graphs I thought I could use for all the plots.

Category: neuronal activation, Operant reinforcment, Optogenetics | No Comments
Modelling the valence of dopaminergic clusters from the Y-mazes
on Monday, June 25th, 2018 1:52 | by Christian Rohrsen
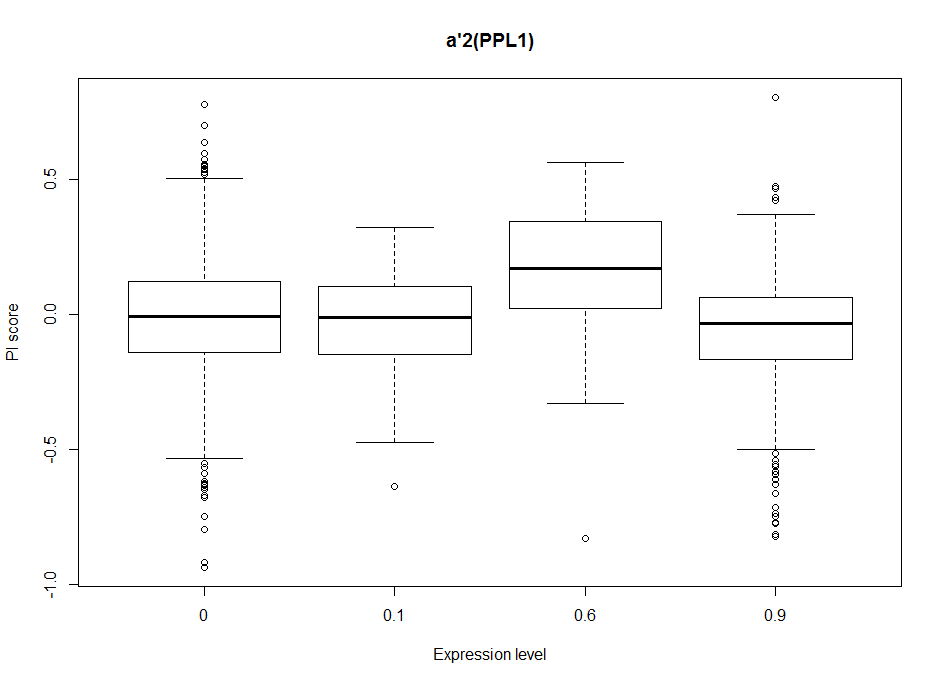
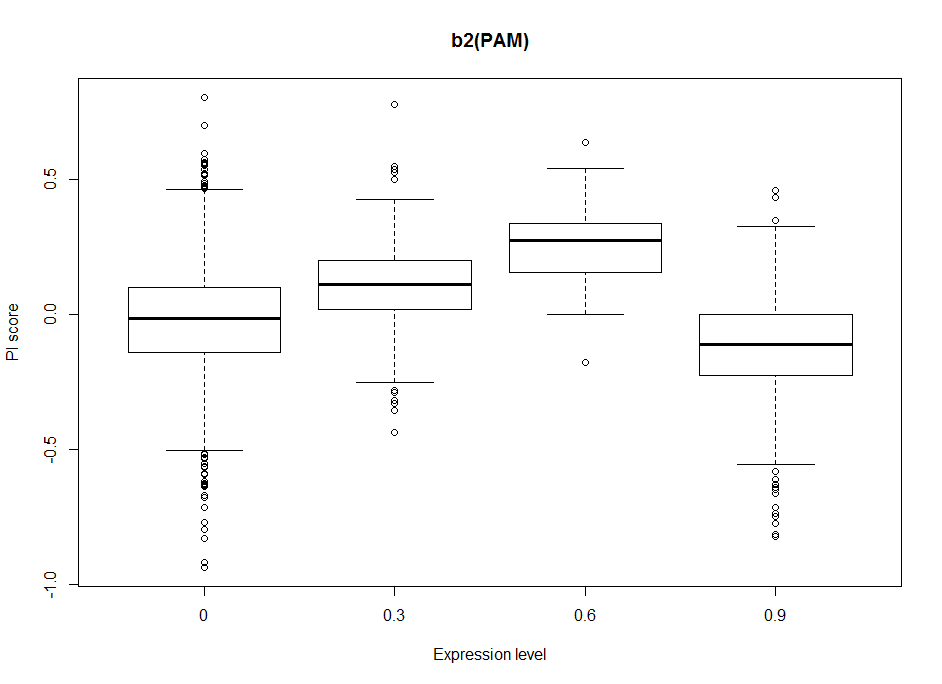
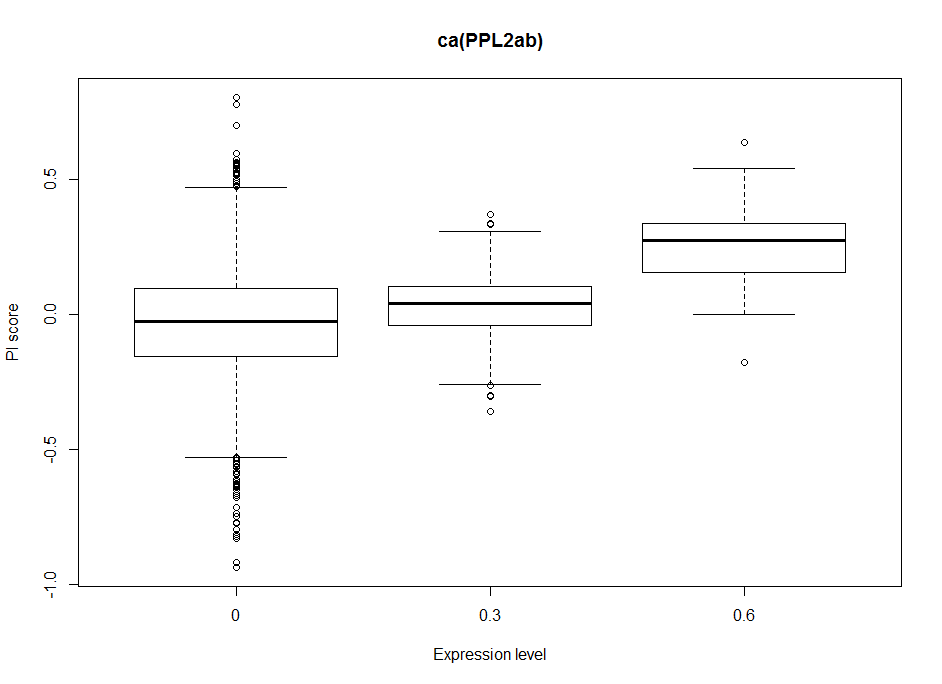
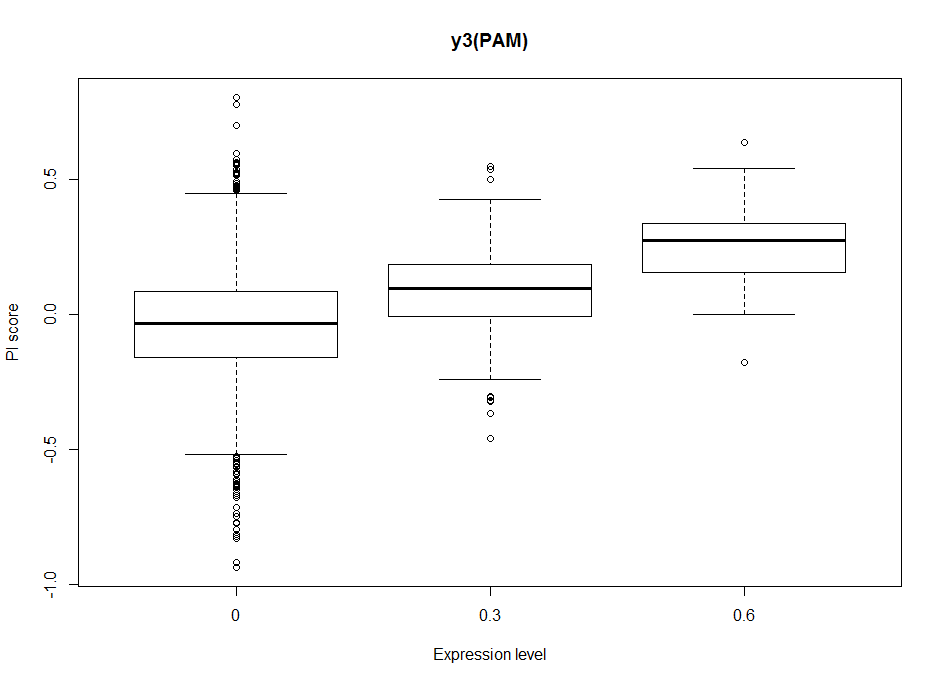
Dopaminergic clusters are differently targeted by the different Gal4s. Some of the express faintly, others stronger. Here I try to see if the dose-response curve (or expression-PI curve) seems to be linear or not. Here I put two examples from the 17 clusters, where the first two seem to have nonlinear curves, with and optimal expression level, and the last two seem to have a linear response curve.
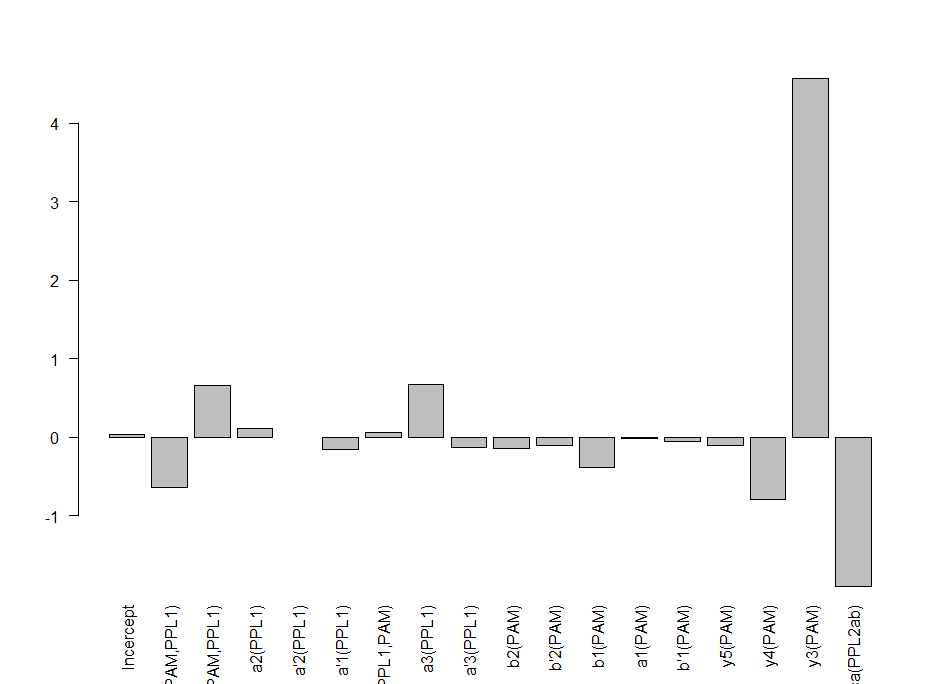
This will be important for the modelling in order to decide to make a linear/nonlinear model. Down below I show the results from a linear model and it´s statistics. From Aso et al. 2012, one could see that activating the lines with TrpA1 shows a linear response curve. But in this case it does not necessarily seem to be the case. Therefore, light intensities might have an effect, as well as the expression level, and conclusion needs to be taken carefully.
In addition it is difficult to calculate this for all the clusters with just one single light intensity test, because not all clusters are expressed in several Gal4s to different level, so that we can estimate from there. So for the interesting lines we might need to make several experiments at different intensities, and see the dose response curve.
The G4s I have used for the modelling are the ones shown here.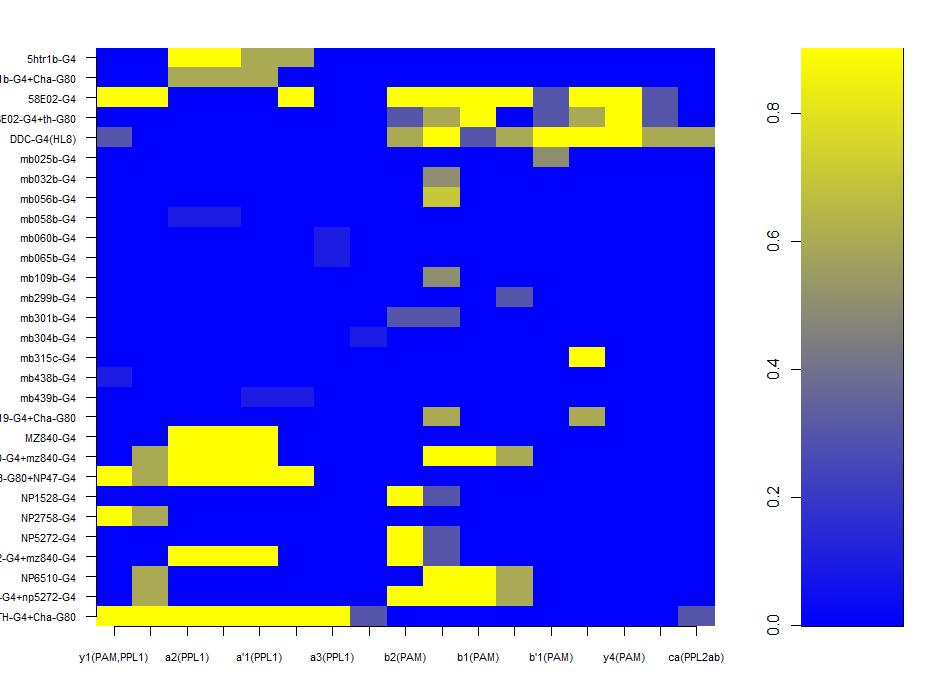
T-Maze experiments : screen results as on 25-06-2018
on Monday, June 25th, 2018 1:13 | by Naman Agrawal
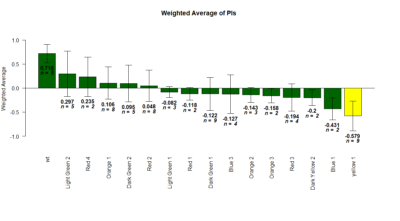
Yellow 1 (Positive Control): Gr28bd-G4, TrpA1-G4
Parameters:
Light: intensity (500 Lux side, 1000 Lux bottom)
frequency = 20Hz
Delay = 1 ms
Duration = 9.9 ms
volts = 6.4
Category: genetics, lab.brembs.net, neuronal activation, open science, Operant learning, Optogenetics | No Comments
Making new ratios for Y-maze
on Monday, June 18th, 2018 1:55 | by Christian Rohrsen
This is just to show that I am trying to find a new ratio so that all graphs have from -1 to +1 ranges. That is why now the difference in occupancy time is divided by the total time. The same with the speed. Because speed differences are so subtle, the Y axis scale has to be lower
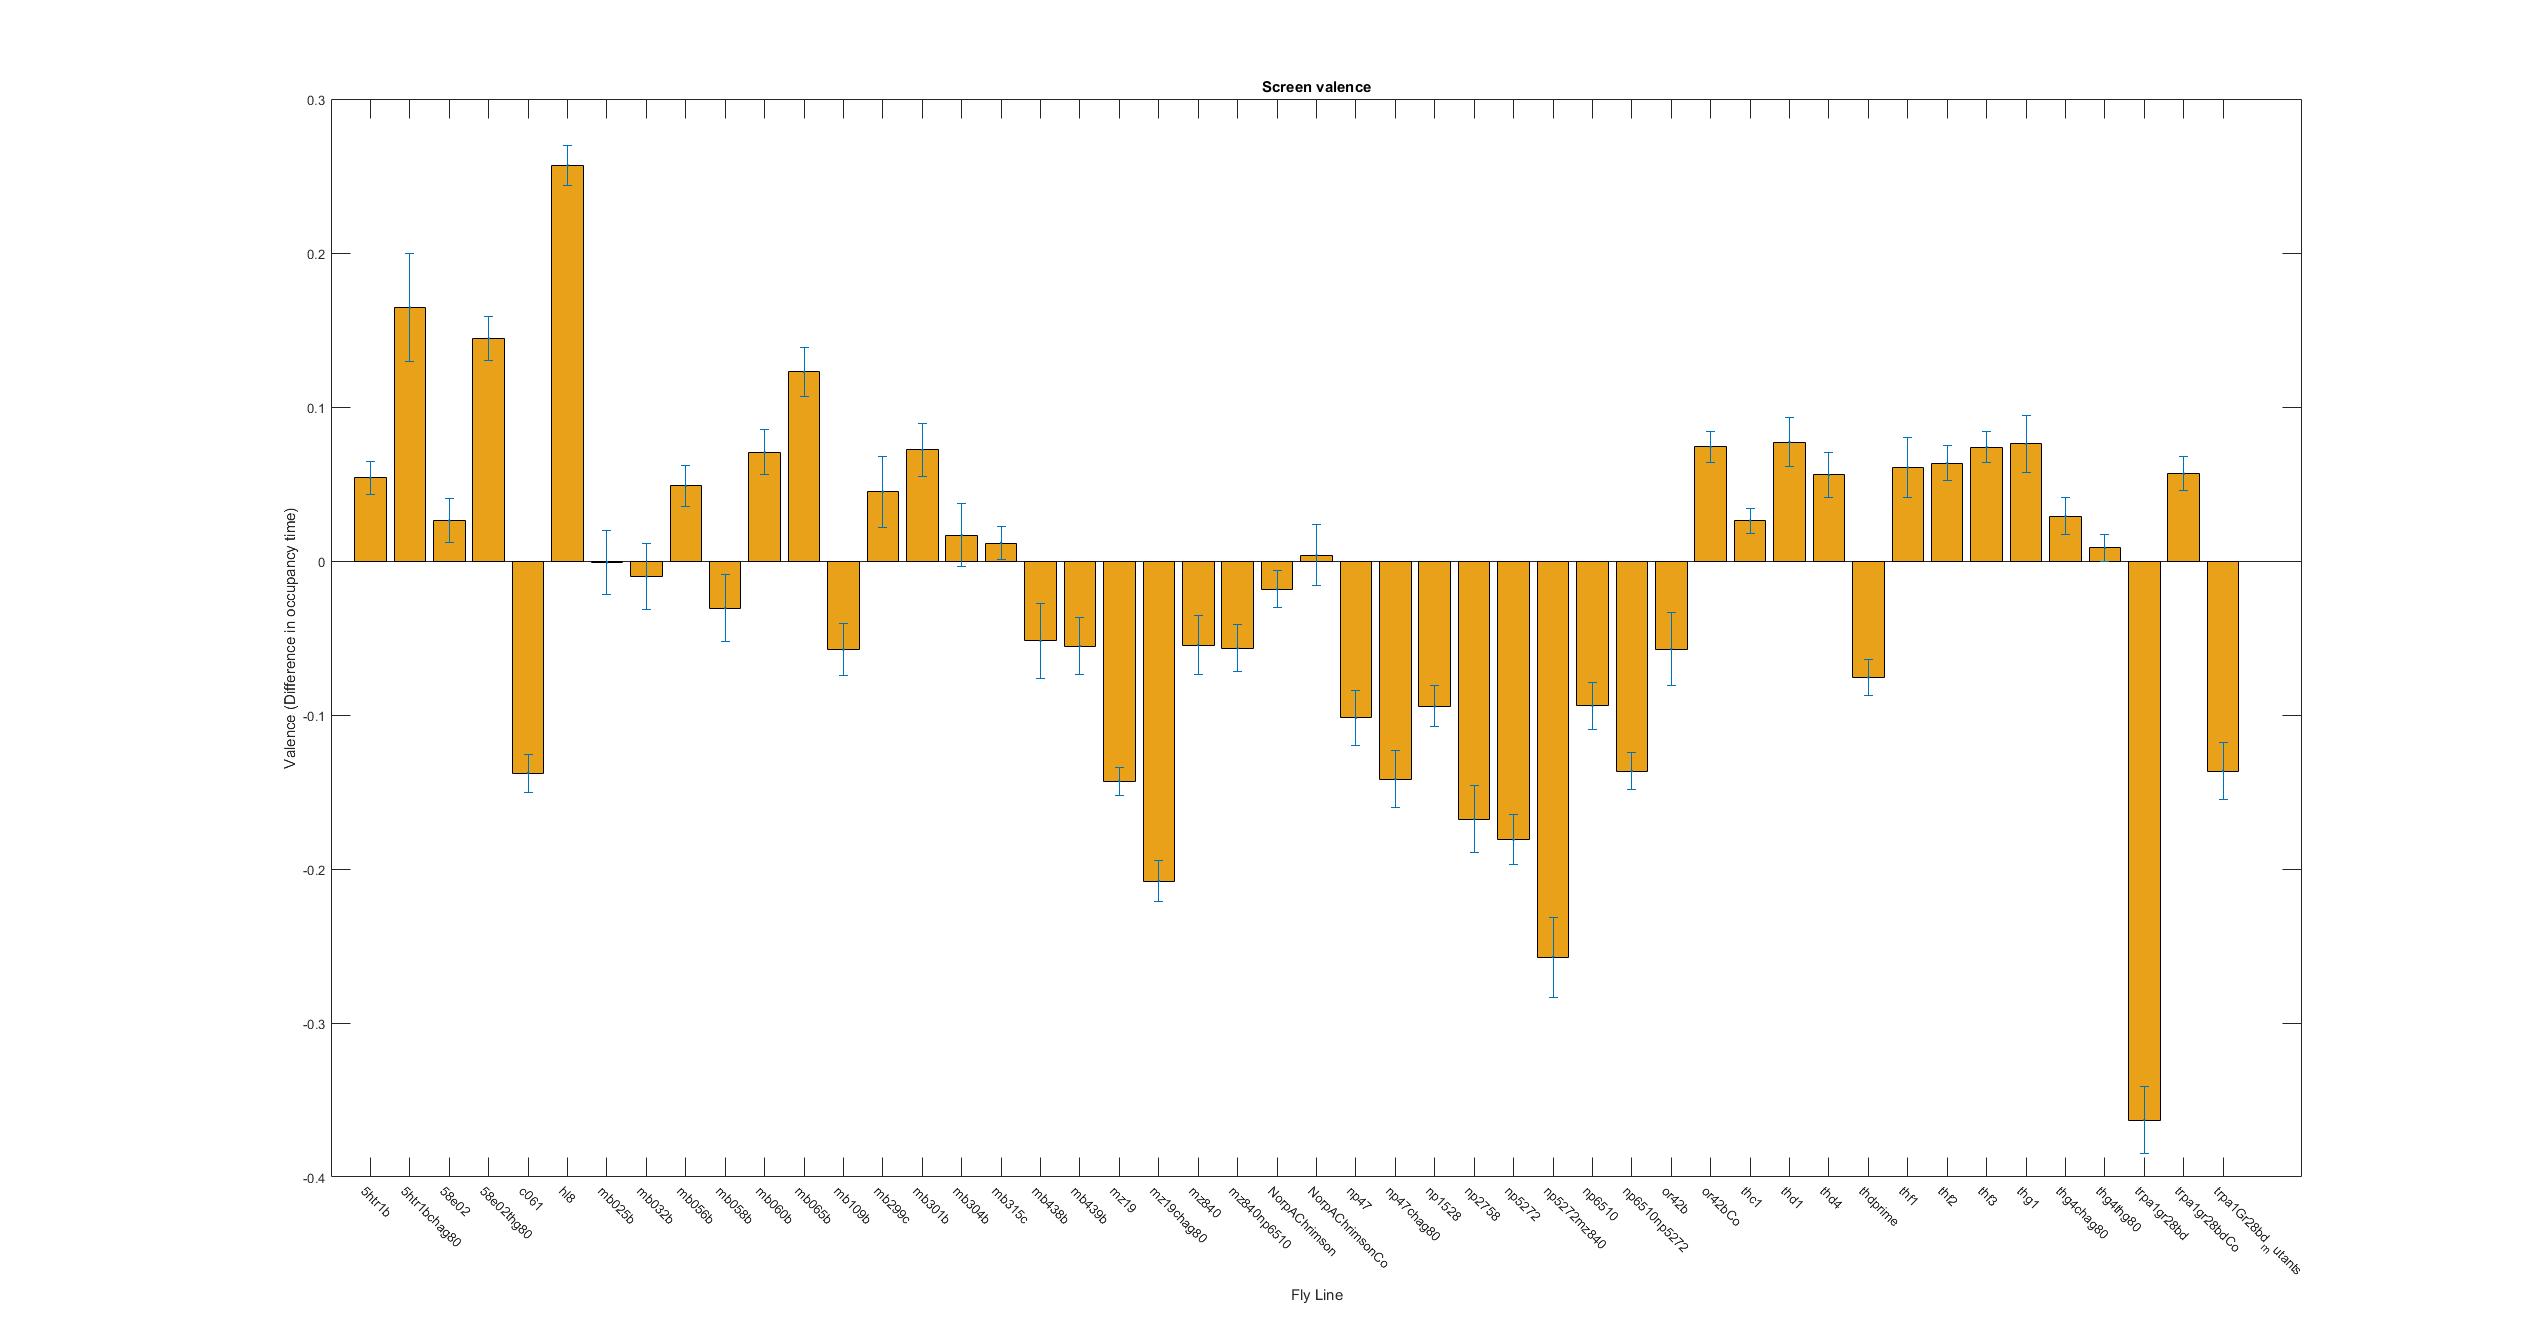
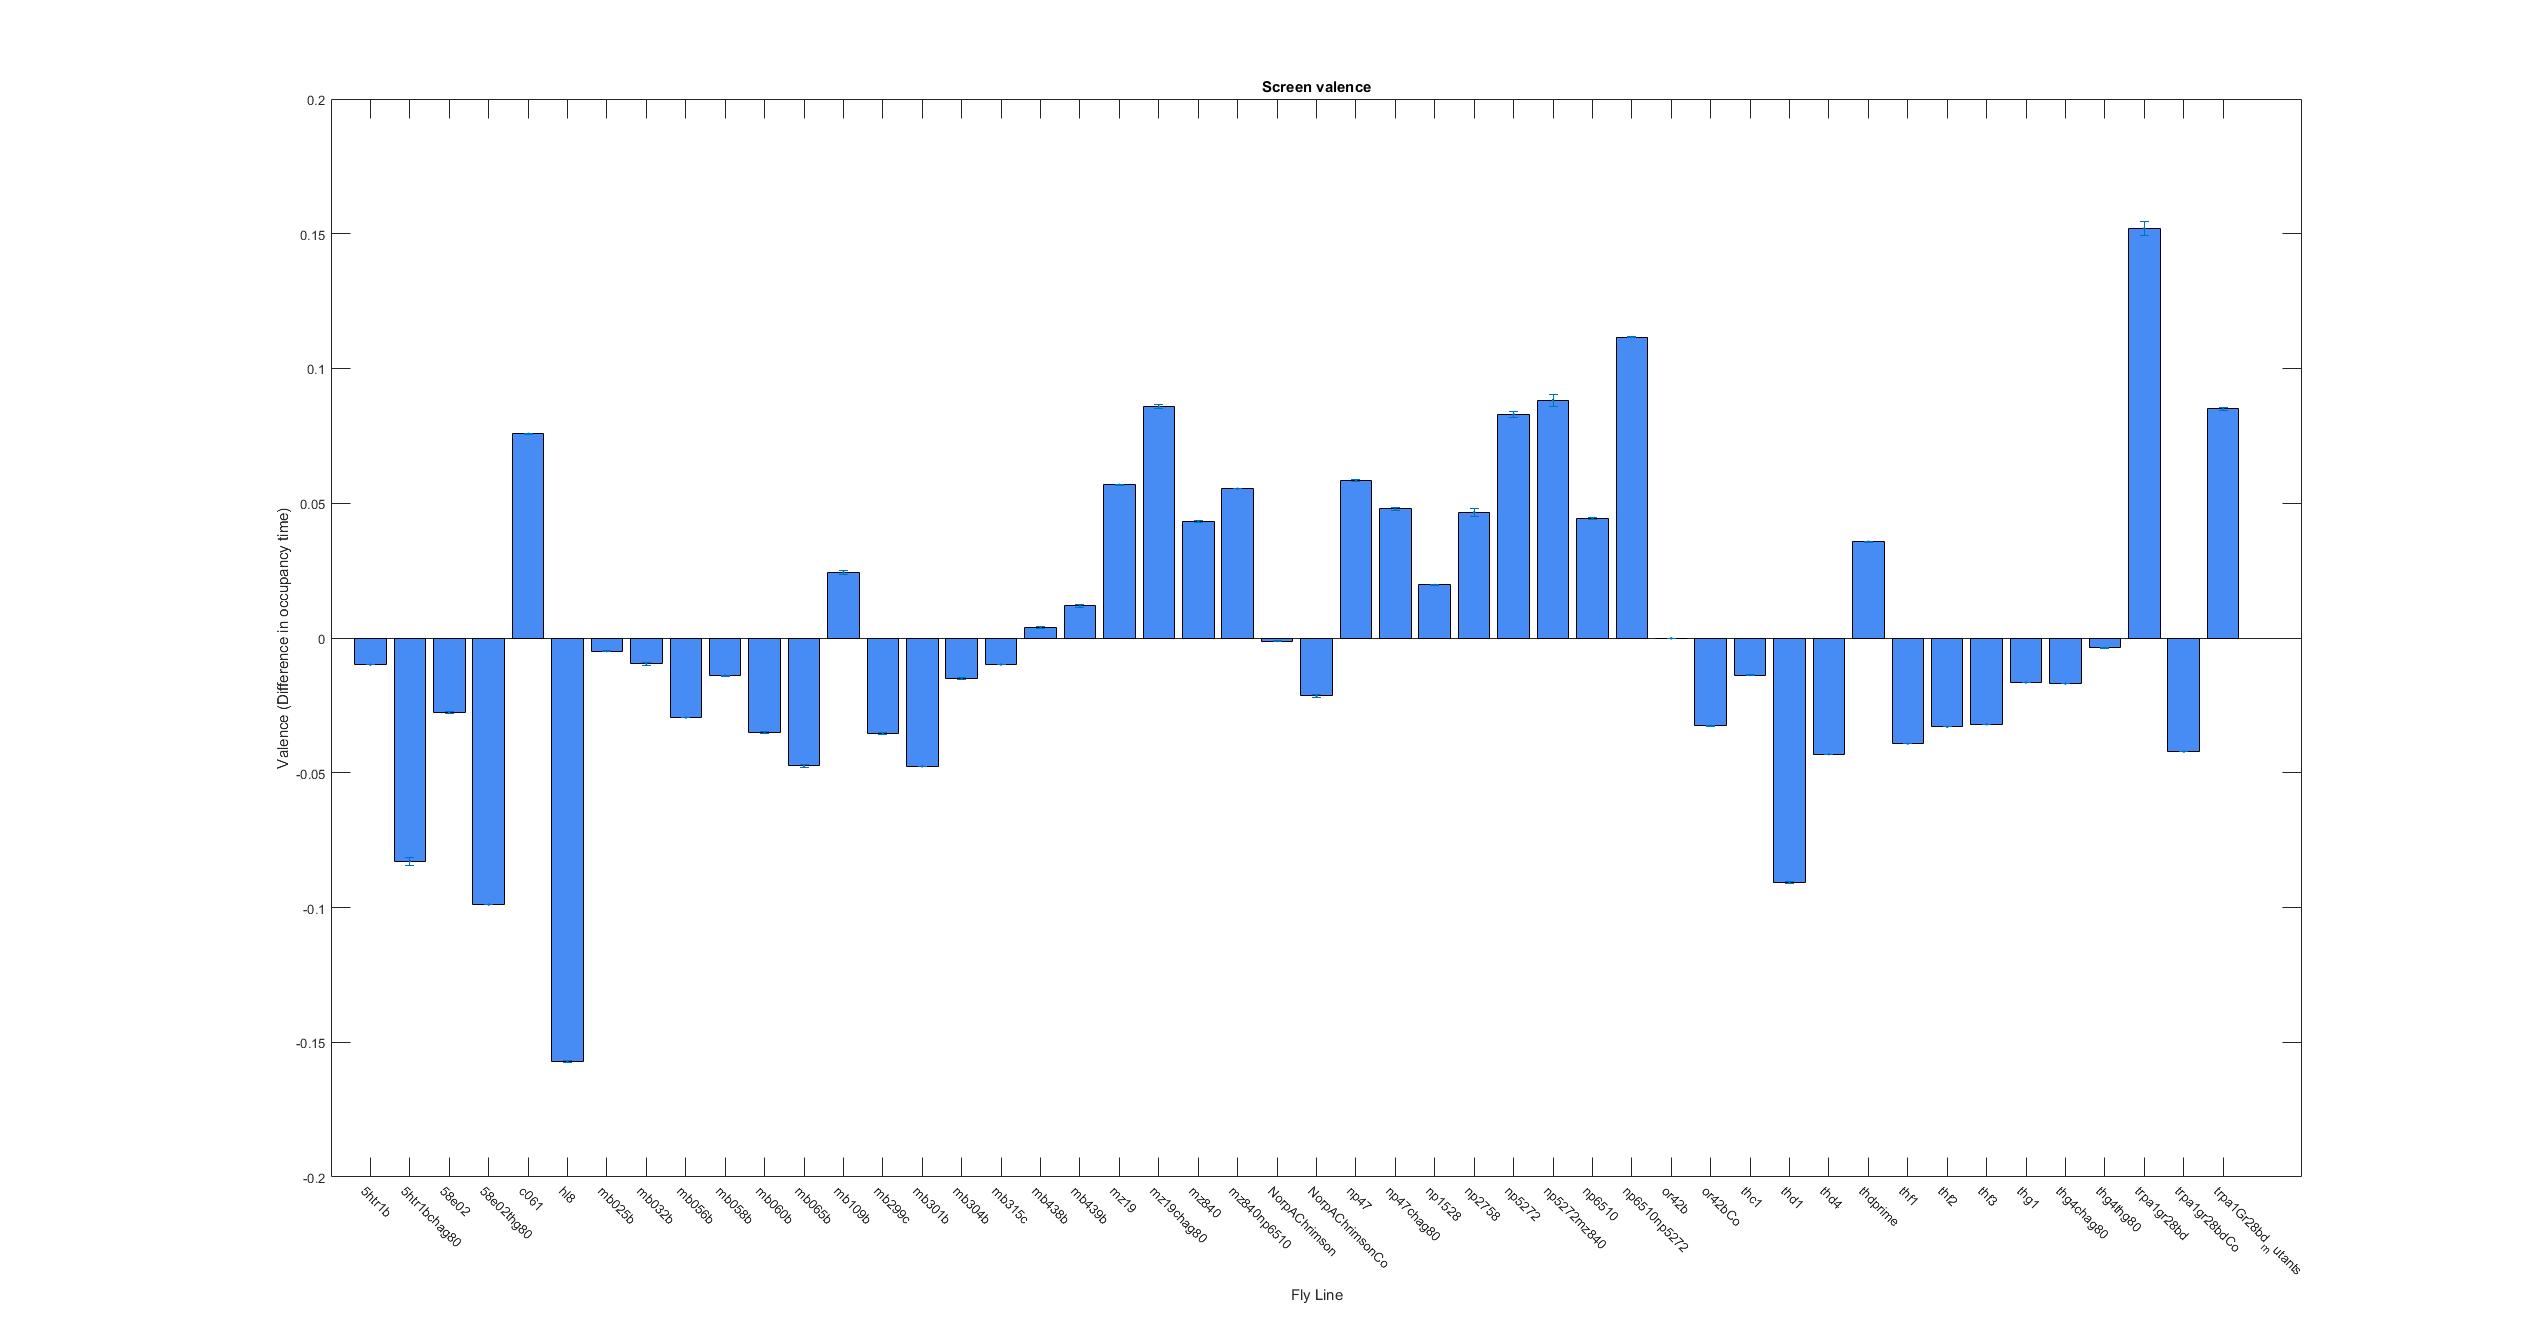
Initial screen results
on Monday, June 18th, 2018 1:15 | by Gaia Bianchini
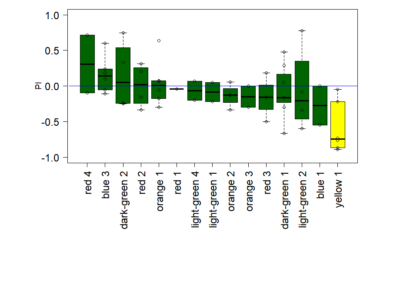
Yellow 1 (Positive Control): Gr28bd-G4, TrpA1-G4
Light: intensity (500 Lux side, 1000 Lux bottom), frequency (20Hz)
Category: crosses, genetics, lab.brembs.net, neuronal activation, open science, Operant learning, Optogenetics | No Comments
Calibration(of different units of intensity) for Tmaze and Joystick platform
on Wednesday, June 13th, 2018 12:38 | by Saurabh Bedi
- For the Joystick experiment – We continuously varied the light intensity at the tip of the optical fibre and measured it using the Lux meter at first and then in mW/cm^2. Then both these readings were taken down and the best fit was generated which depicted the measured fit. Now a theoretical fit was also generated and plotted. This is given below
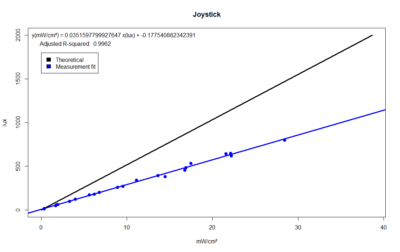
- We also did the best fit for the Tmaze experimental setup. We measured the light intensity on both sides of the chamber in between and took the average of it.
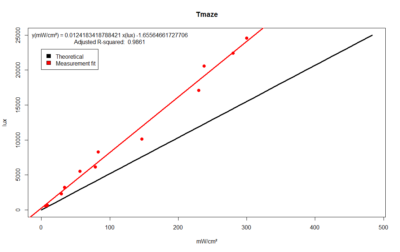
- The Information for plotting the theoretical fit was obtained from here: https://www.dfisica.ubi.pt/~hgil/Fotometria/HandBook/ch07.html
## 1 Watt = 517.031 lm at 590 nm
## 1 lux = 1 lm/m2
## Therefore: 517.031 lux = 517.031 lm/m2 = 1 Watt/m2 = 1000mW/mm2 = 10mW/cm2
Category: neuronal activation | No Comments