Modelling the valence of dopaminergic clusters from the Y-mazes
on Monday, June 25th, 2018 1:52 | by Christian Rohrsen
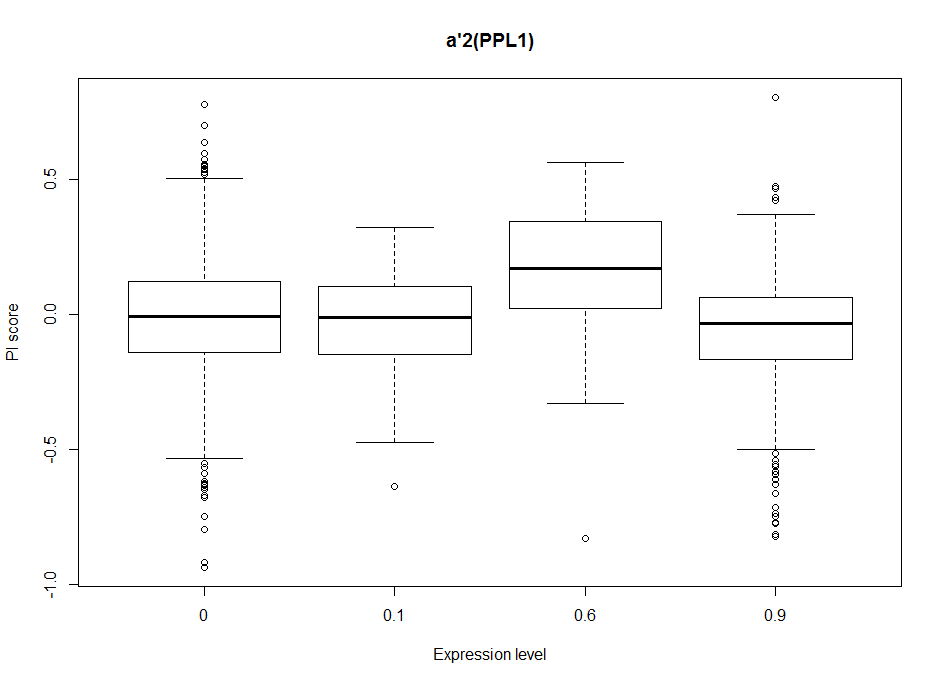
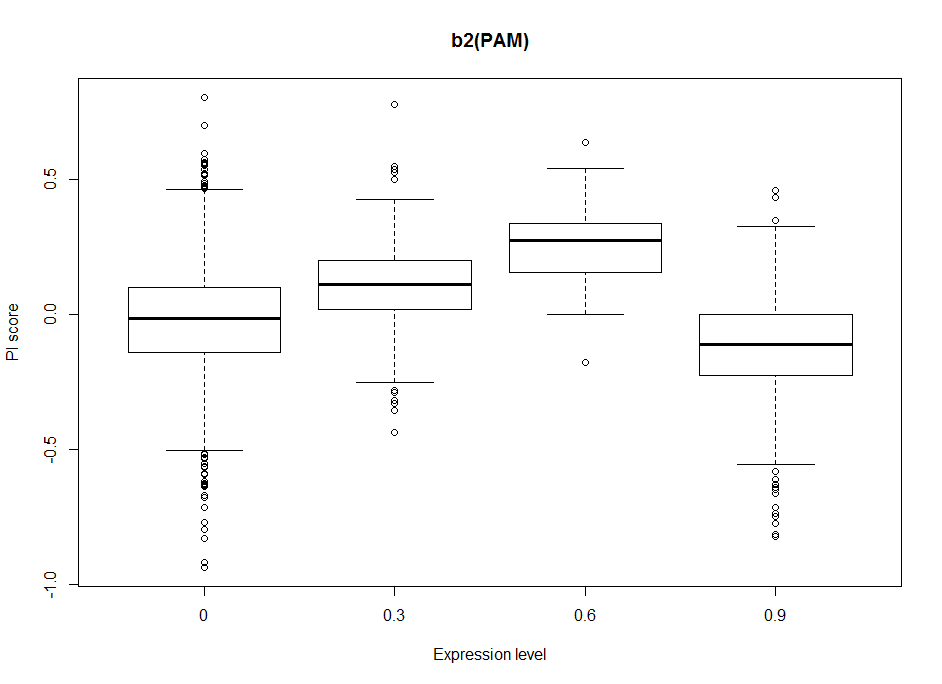
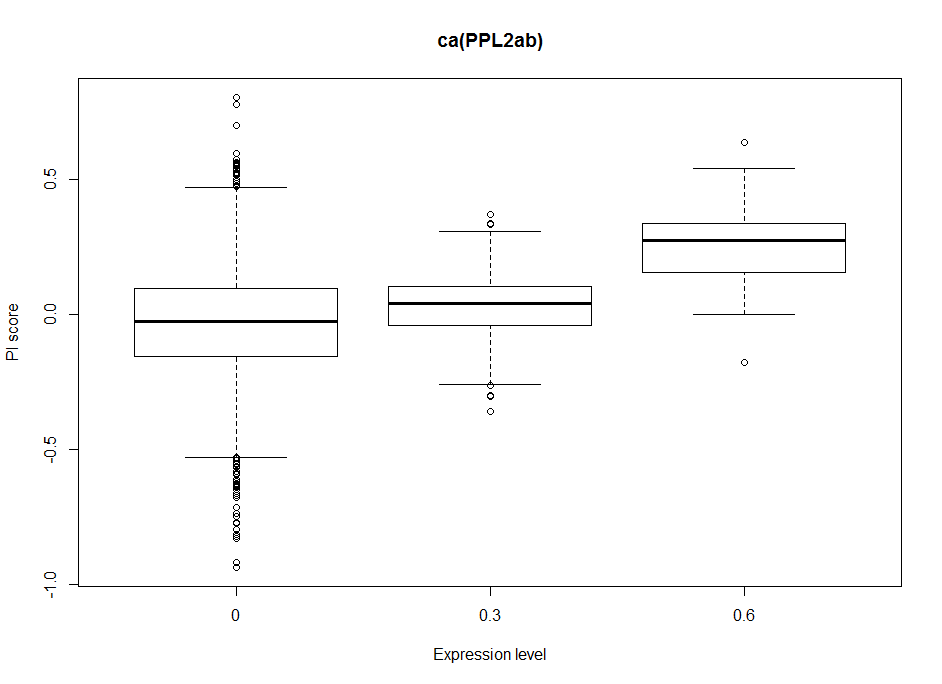
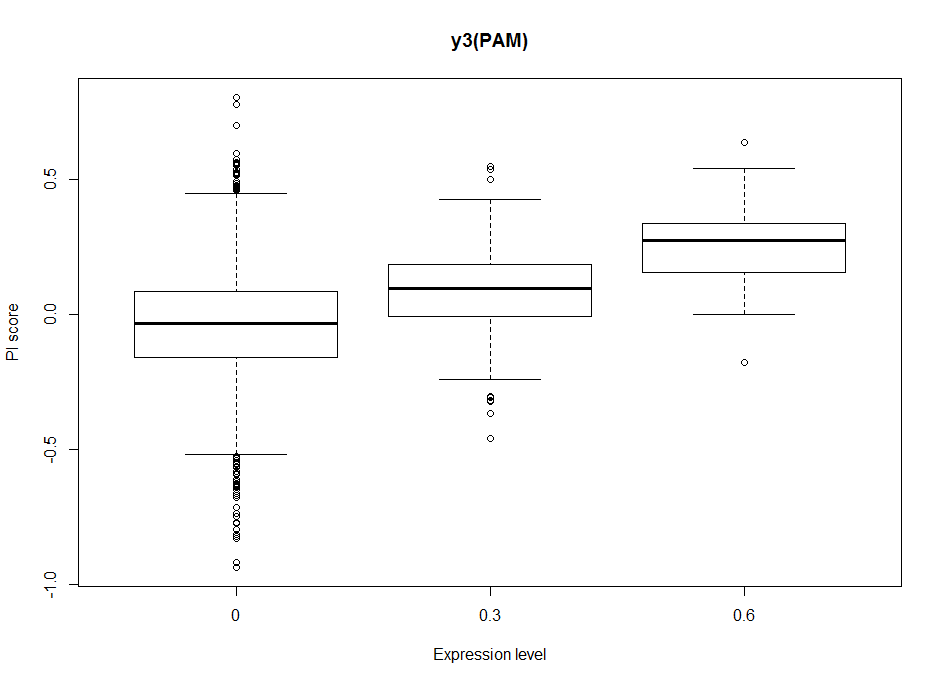
Dopaminergic clusters are differently targeted by the different Gal4s. Some of the express faintly, others stronger. Here I try to see if the dose-response curve (or expression-PI curve) seems to be linear or not. Here I put two examples from the 17 clusters, where the first two seem to have nonlinear curves, with and optimal expression level, and the last two seem to have a linear response curve.
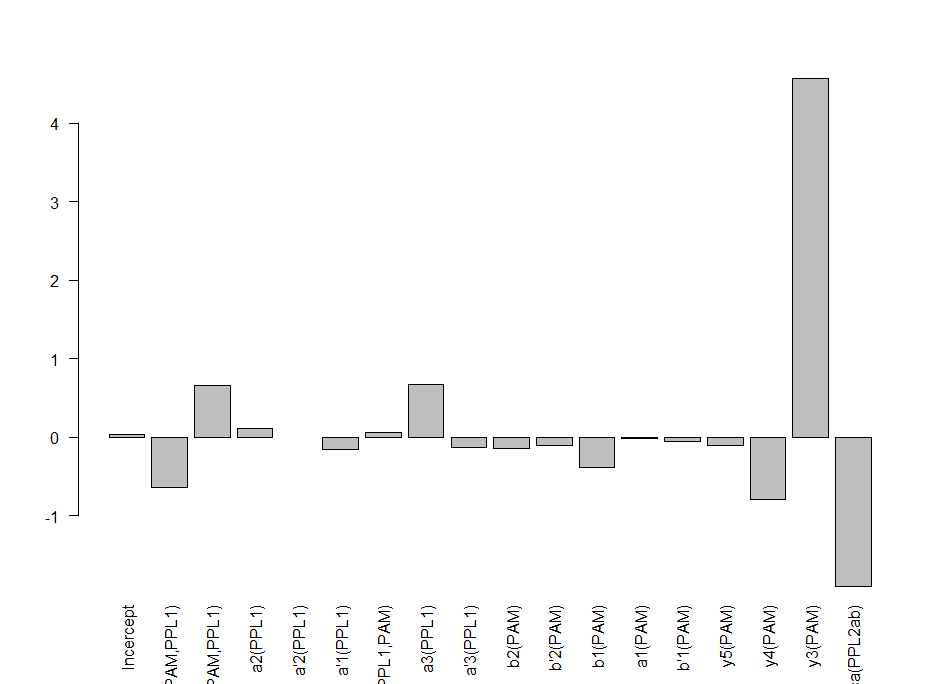
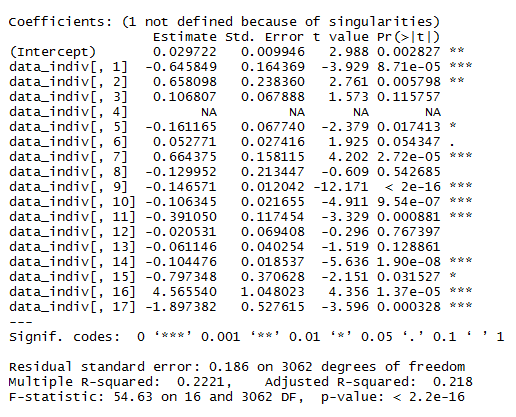
This will be important for the modelling in order to decide to make a linear/nonlinear model. Down below I show the results from a linear model and it´s statistics. From Aso et al. 2012, one could see that activating the lines with TrpA1 shows a linear response curve. But in this case it does not necessarily seem to be the case. Therefore, light intensities might have an effect, as well as the expression level, and conclusion needs to be taken carefully.
In addition it is difficult to calculate this for all the clusters with just one single light intensity test, because not all clusters are expressed in several Gal4s to different level, so that we can estimate from there. So for the interesting lines we might need to make several experiments at different intensities, and see the dose response curve.
The G4s I have used for the modelling are the ones shown here.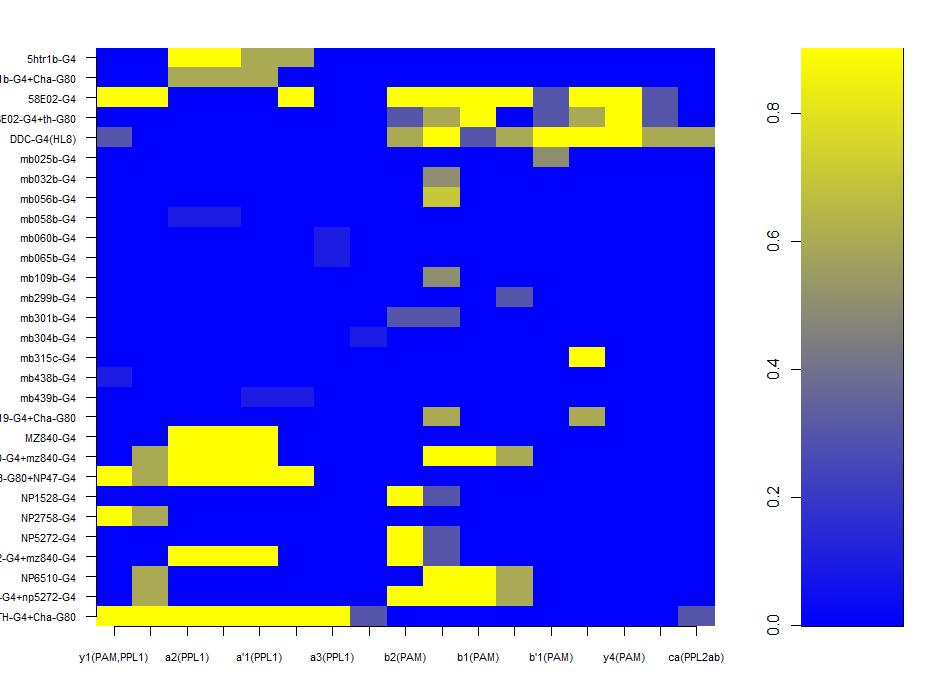

Category: neuronal activation, Operant reinforcment, operant self-learning, Optogenetics
Leave a Reply