Searching interesting lines
on Friday, August 31st, 2018 4:23 | by Christian Rohrsen
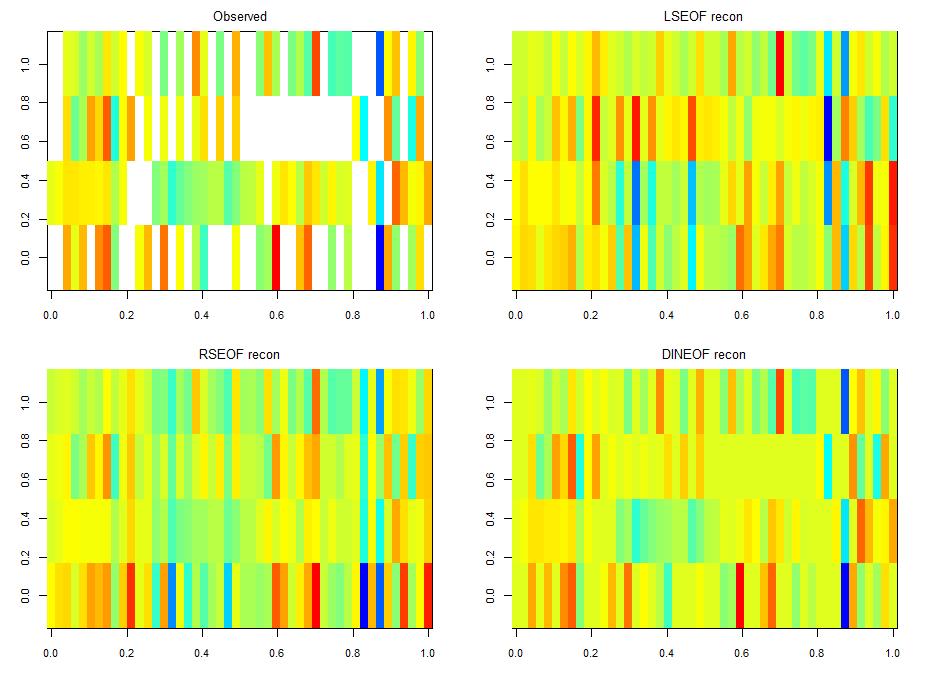
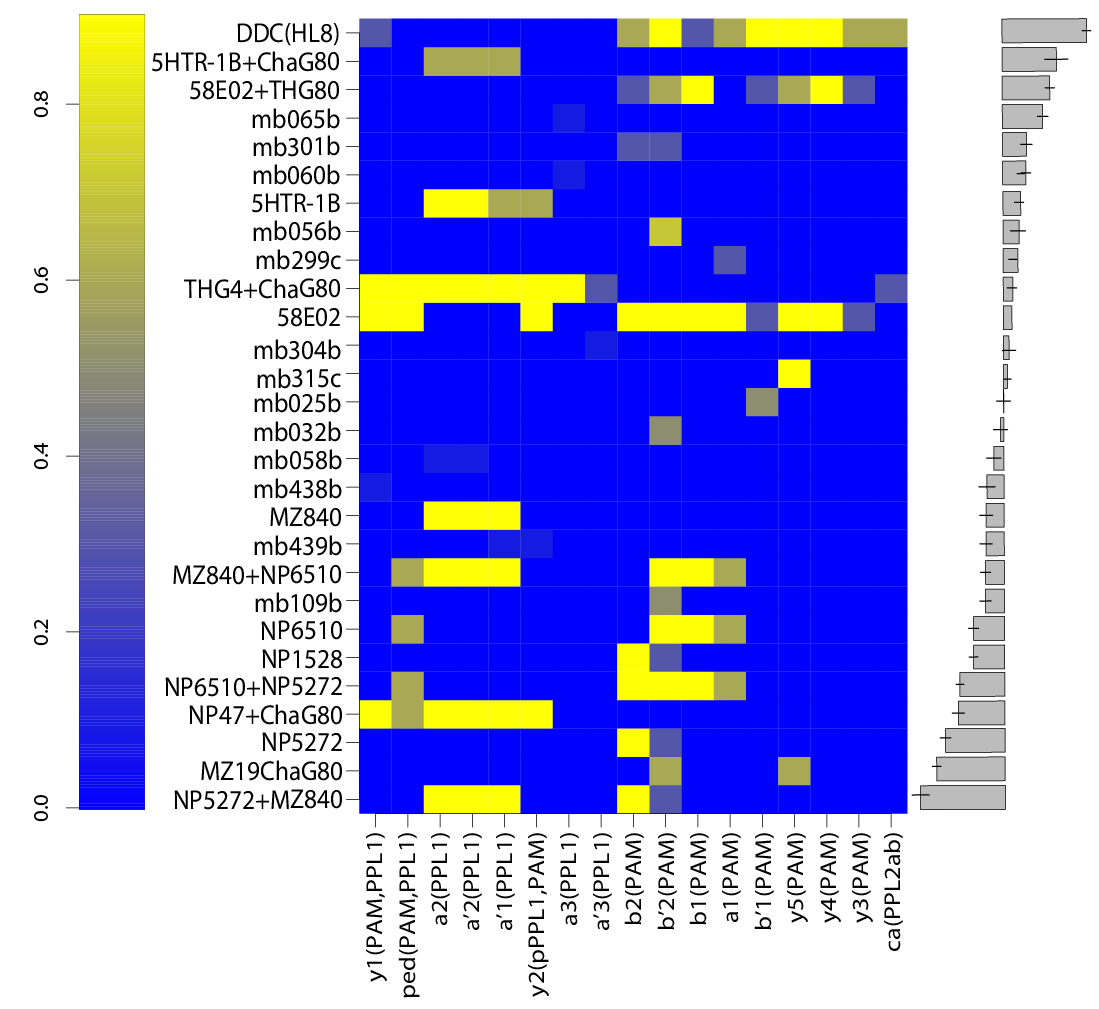
For finding if there are phenotype correlations in the different setups one needs a full matrix, which is not my case since I tested to some extent different lines in different setups. To make it more graphically, the observed results are shown in the above-left table. Colours just means values obtained (colorbars are unfortunately missing but it´s not so important) and each of the rows is a setup and each of the columns a fly line tested.
For testing correlations among setups, and similarly for doing a PCA one needs a full matrix, and not a sparse matrix as I have. What are the options? a few…
There is LSEOF (Empirical Orthogonal Function Analysis), RSEOF which is like LSEOF but recursive and normally achieves better results. There is another algorithm that is called DINEOF which consists of an additional step, interpolation, before doing LSEOF. The latter has shown to yield the best results. That is why I opted for this for filling my matrix for further analysis.
The results are shown in the figure below
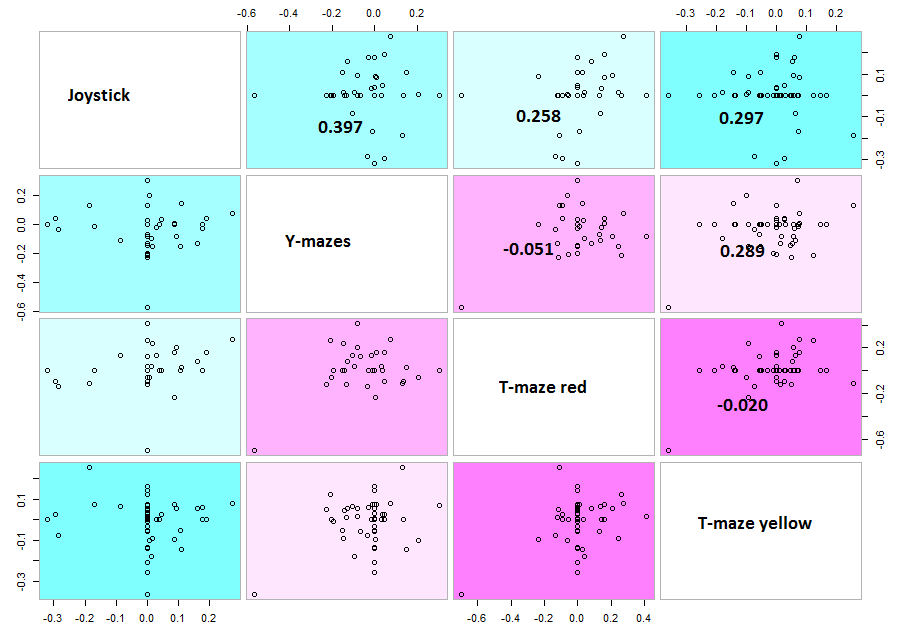
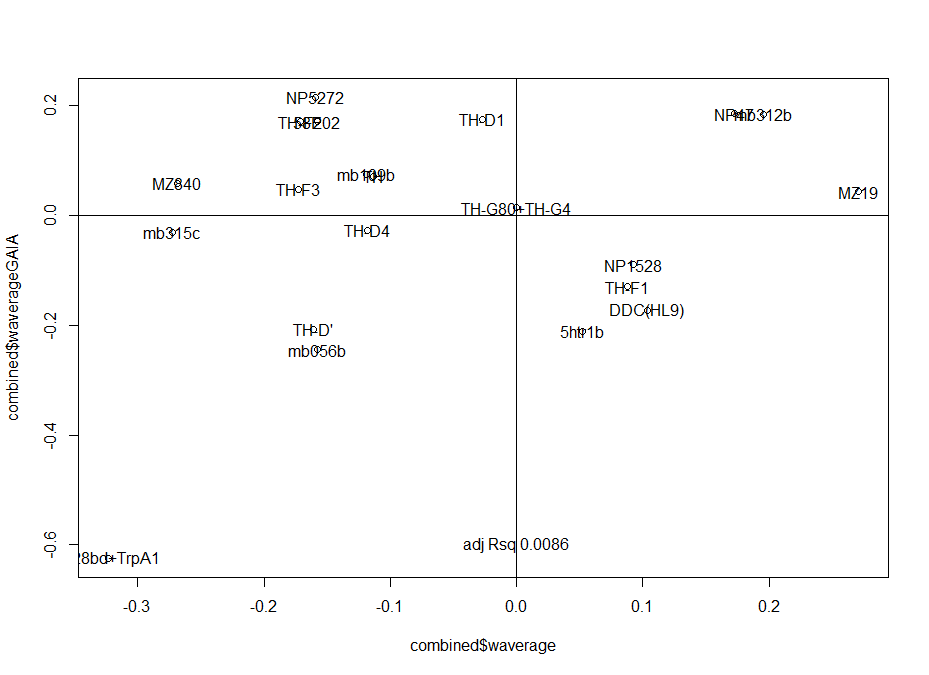
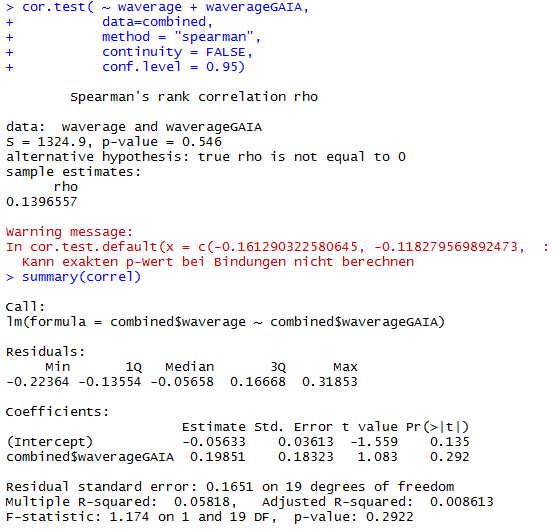
 Here the correlation of the mean results for the lines tested in the experiments. From the correlation numbers I would not say that there is any clear correlation of any experiment to the other ( Adj R² = 0.1392 for Joystick and Y-mazes; Adj R² = 0.06809 for Joystick and yellow T-maze)
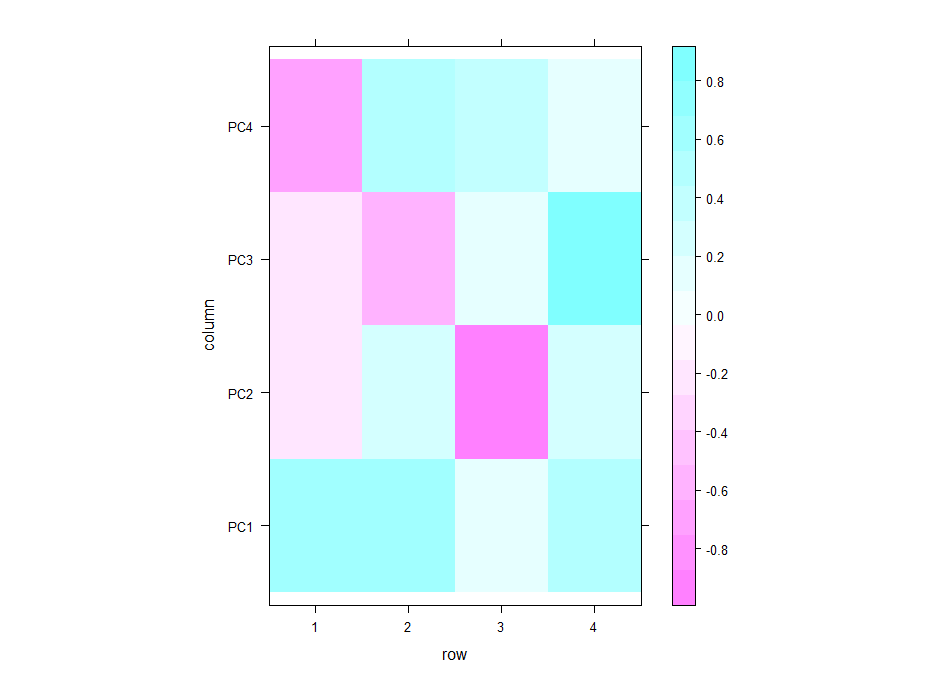
Even if there is no clear correlation among setups that the PCA could use, I decided to do a PCA to see what comes out of it. In the table below one can see the PCA loadings from the 4 different setup. We see that the PC1 uses a positive correlation of Joystick,Ymazes and yellow T-maze. PC2 a negative correlation of red T-maze and Joystick and positive Y-mazes and yellow T-mazes. After all there is not much to say about this, I think.
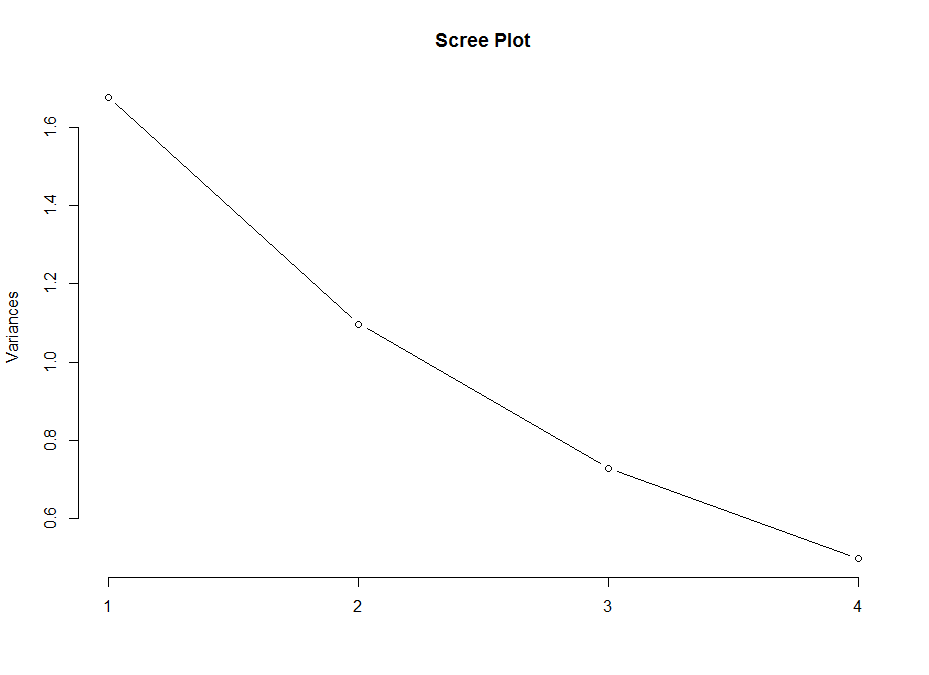
 This scree plot without any clear elbow gives me the impression that there is not much information here.
 This is how the table of “discrete phenotypes” looks like. The first column is positive scores and the second is negative scores. That means that we are looking for lines that have 4´s. This means that it has 4 negative/positive scores (Joystick, Ymazes, Tmaze red and yellow). In this case TH-G1 and TH-D1 have 4 positive scores (HL9 and TH-C1 have 3). TH-D’ have 4 negative scores (MB025B has 3). Unfortunately not all lines were tested in all setups so we might miss some interesting lines.
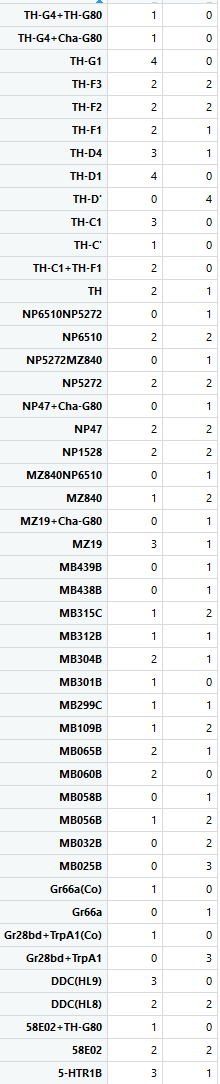
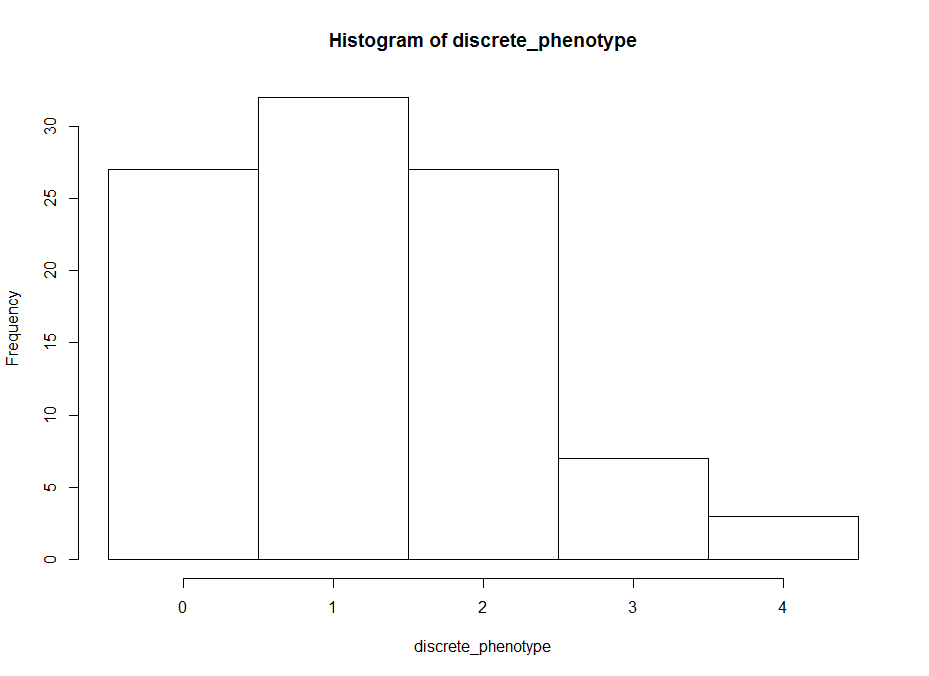
This is an histogram of the amount of zeros, ones,… that are in the above table.
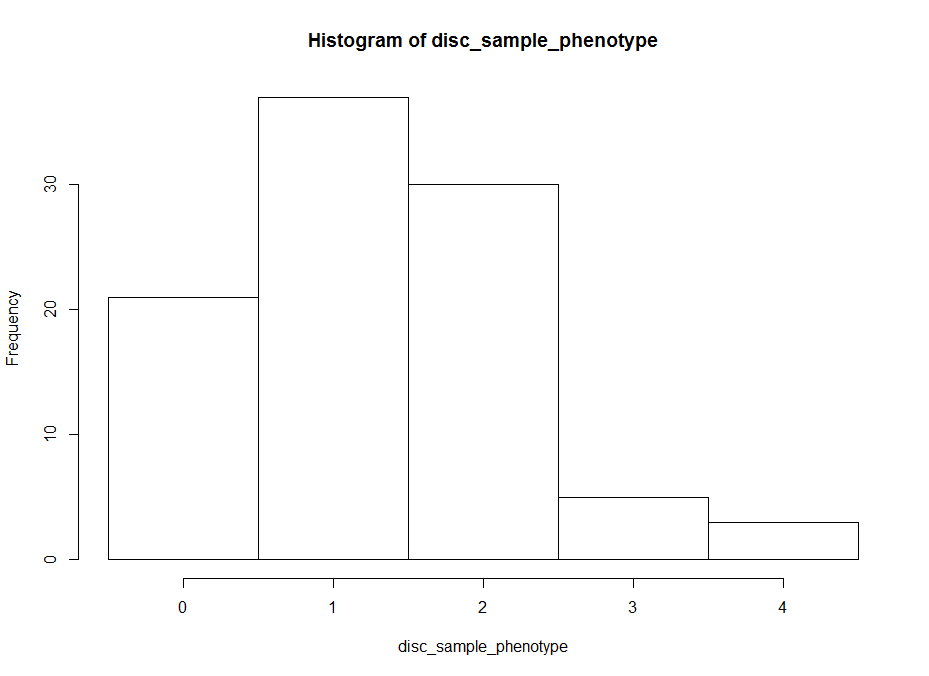
 The histogram below is the same as above but by generating surrogate data. I just sampled data from each experiment and checked what this imaginary lines might do. The histogram is quite similar to the one above. I think that having the same histogram shape only shows that there is not correlation of effects among setups, which was already shown above.
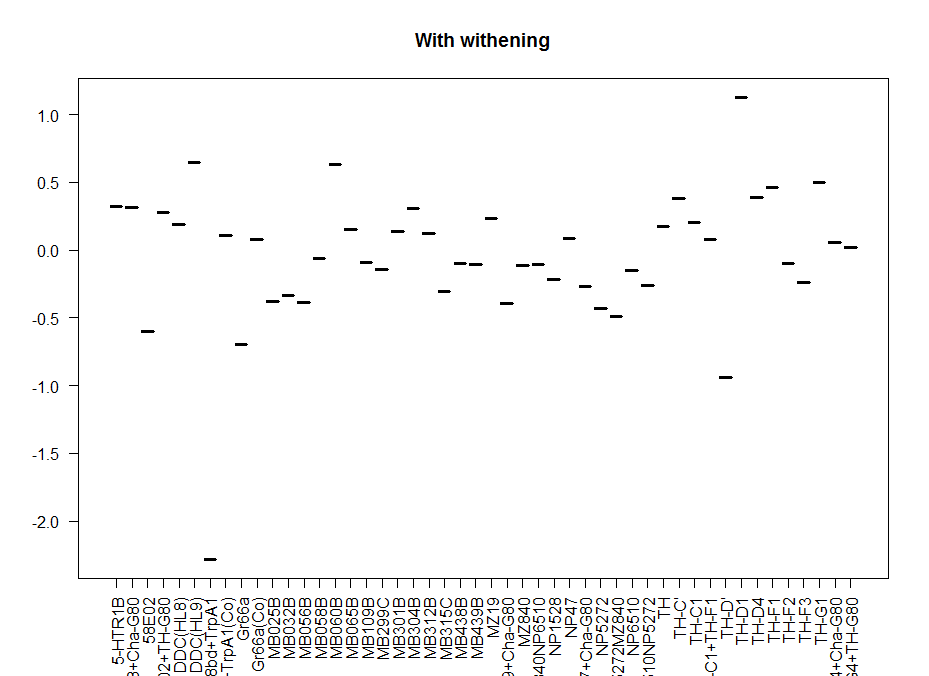
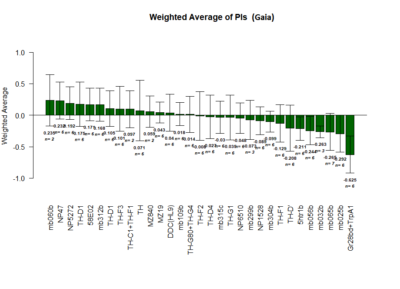
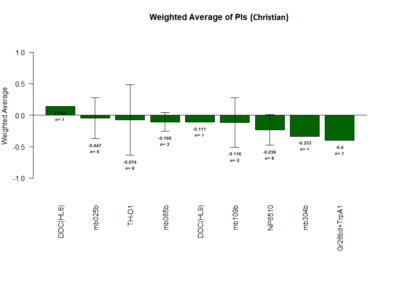
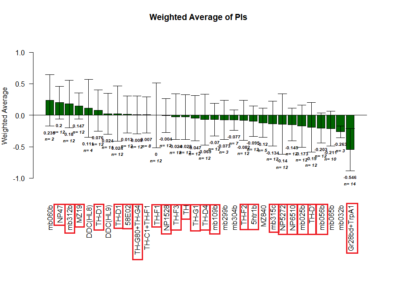
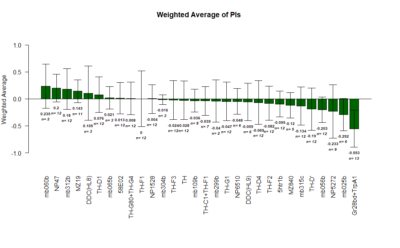
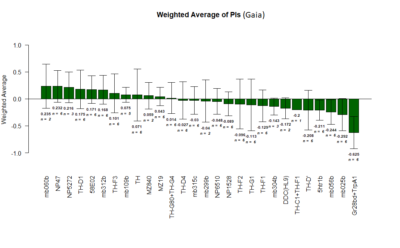
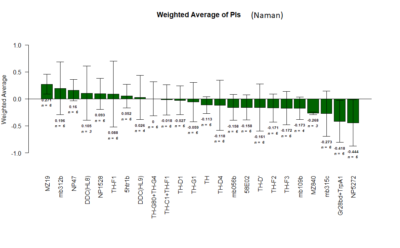
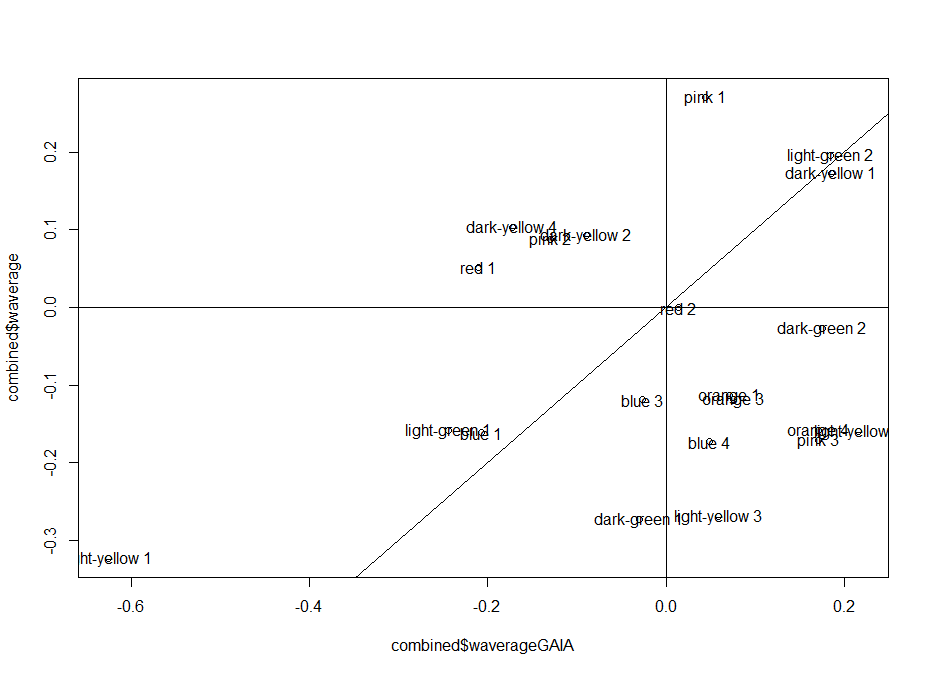
This is another way of looking for the interesting lines. I decided to withen the data so that all have mean zero and equal deviation so that all experiments have same weight. Then I did a mean for all experiments for each line. The extreme values show that they had a very strong overall phenotype. Here one can confirm what was seen with the “discrete phenotypes”. TH-D’ shows a negative score. TH-D1 a positive one, as well as MB060B and HL9.
Here we plot in different colours the effect from each of the setups tested. Here are also lines like TH-D’ and TH-D1 outstanding. I think it is important to see that the longer the bars the most interesting, but also the more mixed contribution of each experiment the more stronger the statistics might be.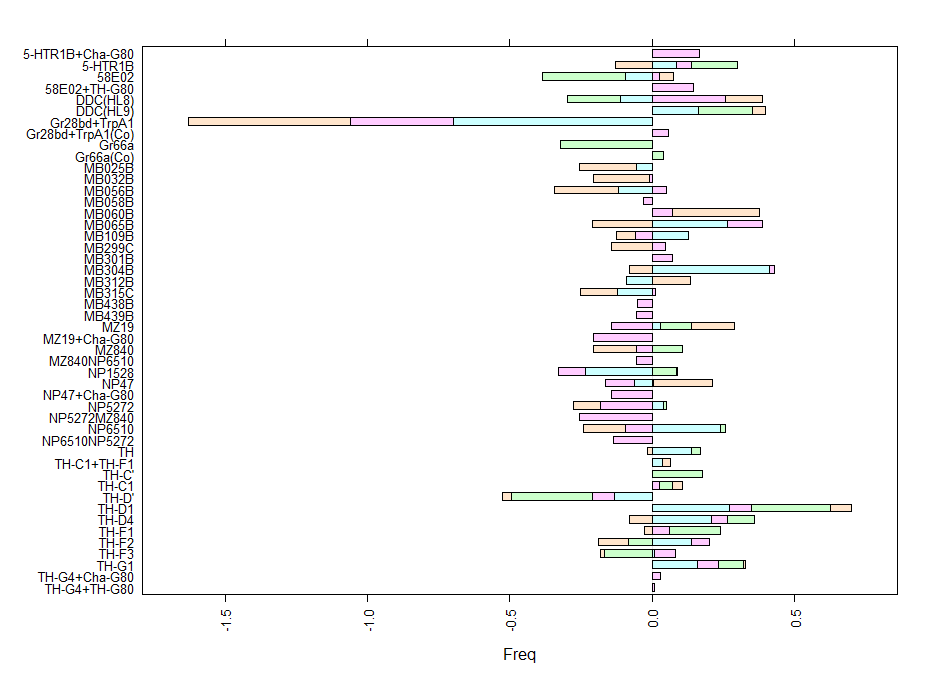

Category: neuronal activation, Operant reinforcment, Optogenetics | No Comments
TH-D’ regions of interest
on Tuesday, August 21st, 2018 2:50 | by Christian Rohrsen
These are all the graphs I could fetch from other articles referring to TH-D’ expression.
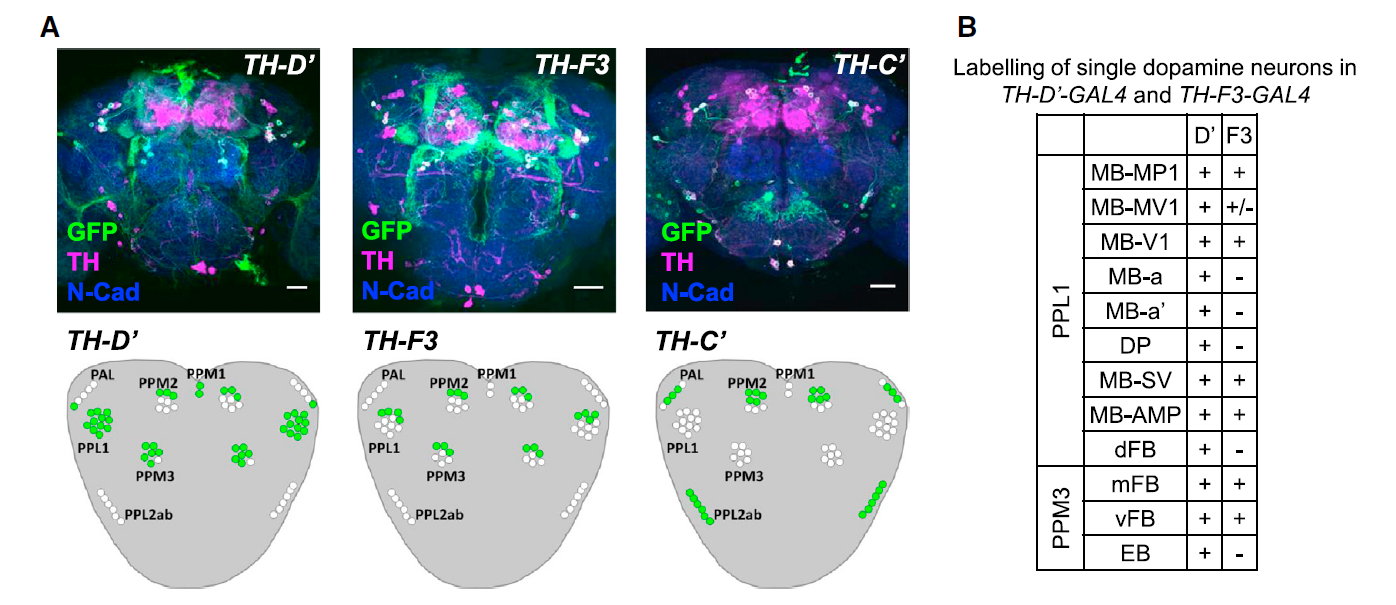
from Galili et al. 2014:
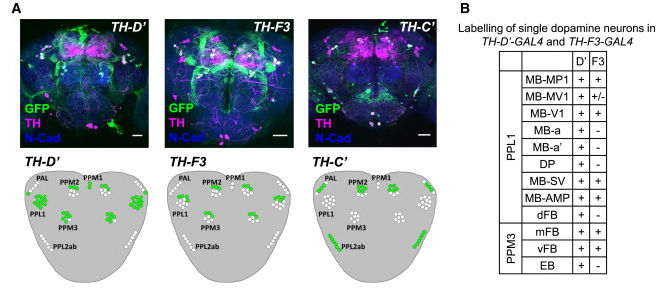
from the table in B, the expression of TH-D’-G4 is different from TH-F3-G4 in PPL1 regions projecting to alpha and alpha’ as well to dorsal Fan Shaped Body (dFB) and DP. I would not focus on the alpha projections into the Mushroom bodies (MB), because the other G4s targeting the alpha lobes did not yield any effect.
In PPM3 only is different the projection to the ellipsoid body (EB). In addition from graph A, PPM1 and PAL regions are stained by TH-D’ but might not be targeted by the other drivers shown.
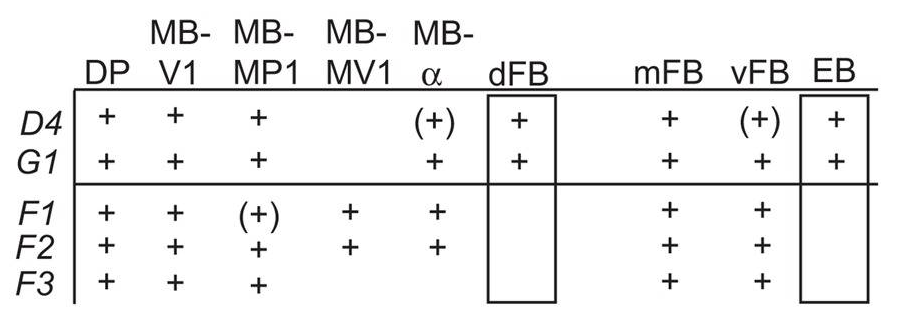
from Liu et al. 2012:
We see that other drivers that were also tested in our screen (like TH-D4 and TH-G1) also stain the PPL1->dFB, PPL1->DP and PPM3->EB. Since these two drivers did not have a phenotyp,e we might not attribute the effect of TH-D’ because of these projections.
From Pathak et al. 2015:
We have a different pattern where they do not describe expression in regions like PPM2, PPM1 or PAL. They point out the expression in PPM3 and PPL1 but we already discarded these regions as the ones involved in reinforcement in the graphs above in this post. They also observed expression in PPL2, which might be a region also stained by TH-G4, TH-D1 and TH-C’, but we do not know how they overlap. A few TH+ neurons in the ventral ganglia are also targeted by TH-D’.
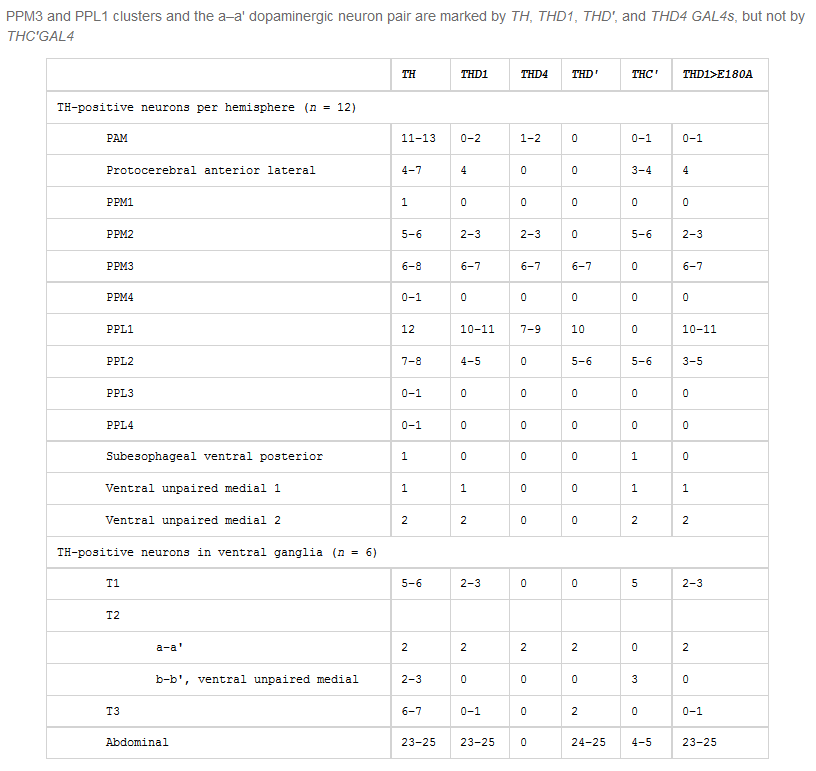
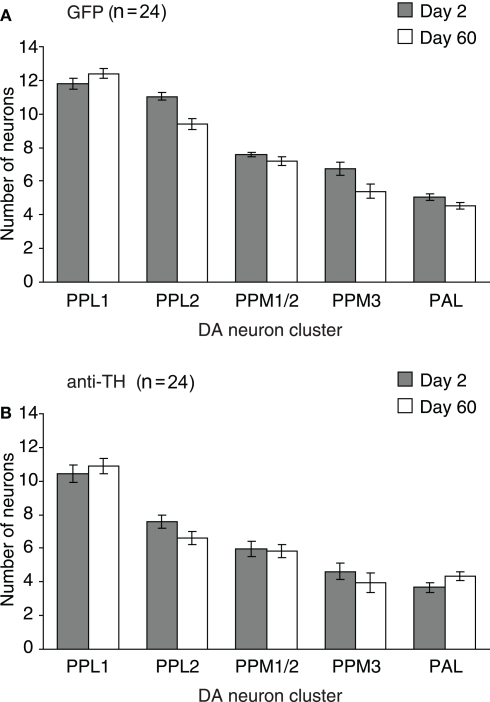
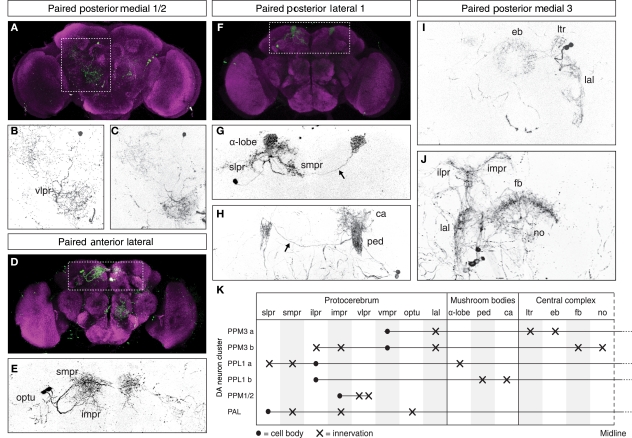
From White et al. 2011?:
We see more general dopaminergic anatomical properties, like the number of neurons in each dopaminergic cluster. In the second graph one can see where the PPL1, PPM3, PPM1/2 and PAL project to.
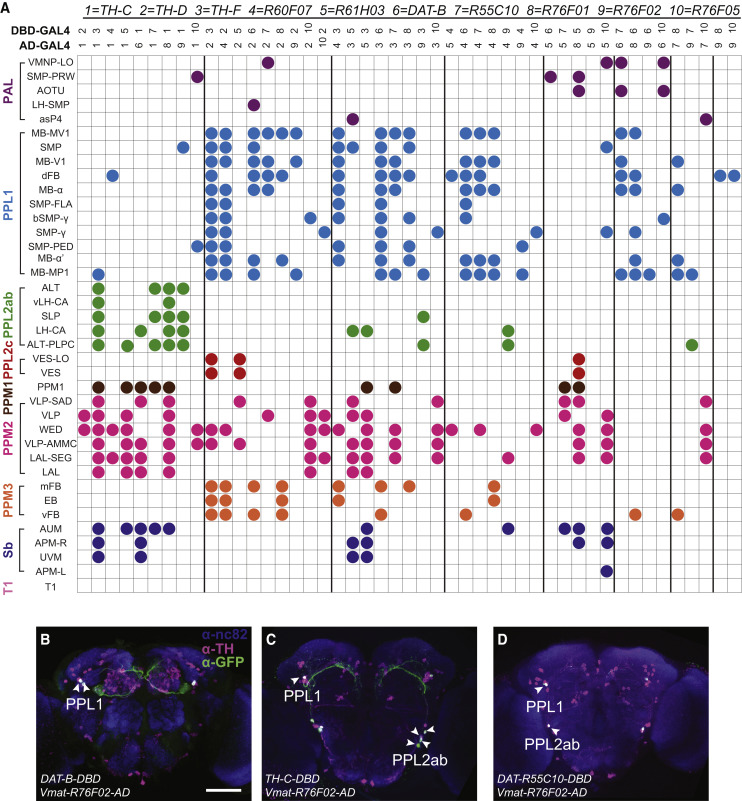
from Xie et al. 2018:
I would say that the only two interesting columns are 1&2 and 2&3 which finds common regions for TH-C vs TH-D and TH-D vs TH-F, respectively. The only conclusion I would take from the first is that a few PPM2 regions are discarded as interesting, and from the second that the whole PPL1 does not seem to have differential expression in TH-D’.
Category: Anatomy, neuronal activation, Operant reinforcment, Optogenetics | No Comments
Joystick results
on Tuesday, August 21st, 2018 2:09 | by Christian Rohrsen
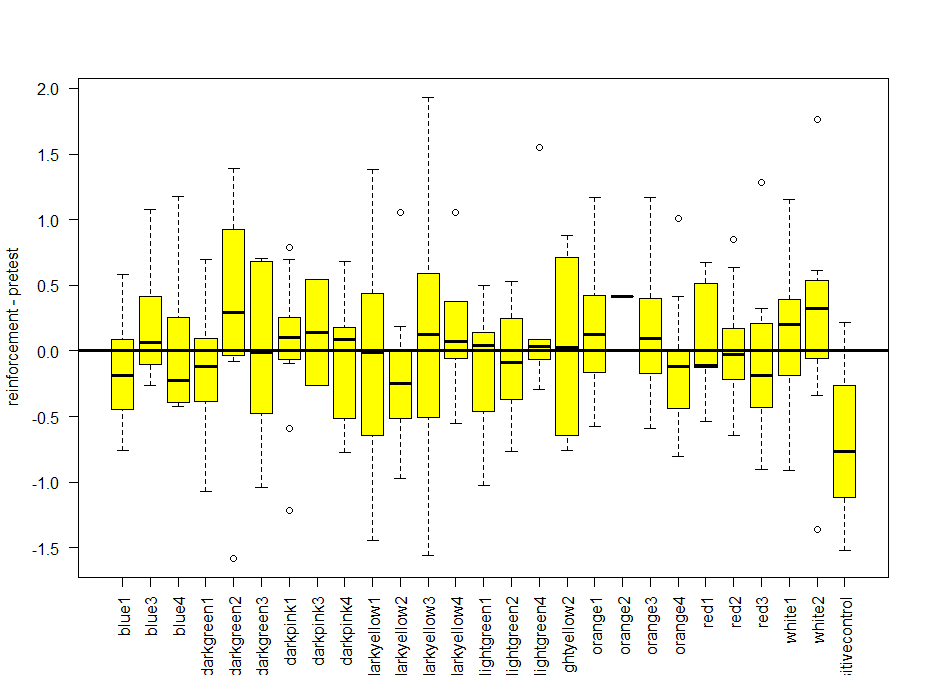
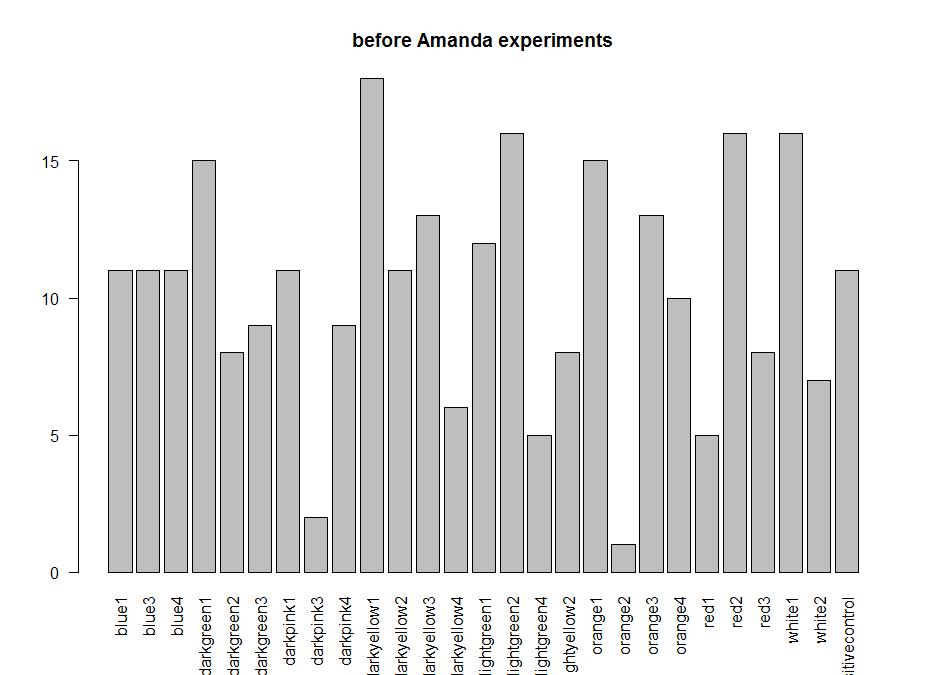
These are the results of Saurabh and Avani together. The positive control, the last one seems to be good (for the barplot and the boxplot). The only objection is that from the metadata it seems like they did all the positive controls on the same day, the 6th of June, which is not a good scientific practice. The third plot is the amount of experiments of each line.
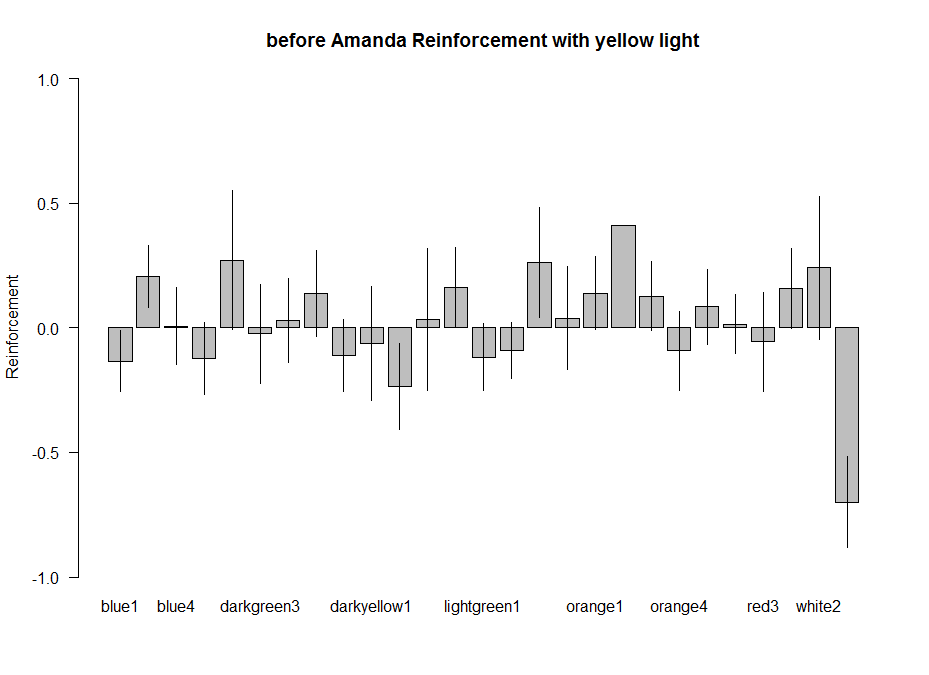
These are the experiments from Amanda, the second plot is the amount of experiments per line. Since the positive control does not show the aversive phenotype I am afraid I have to throw her data away :( 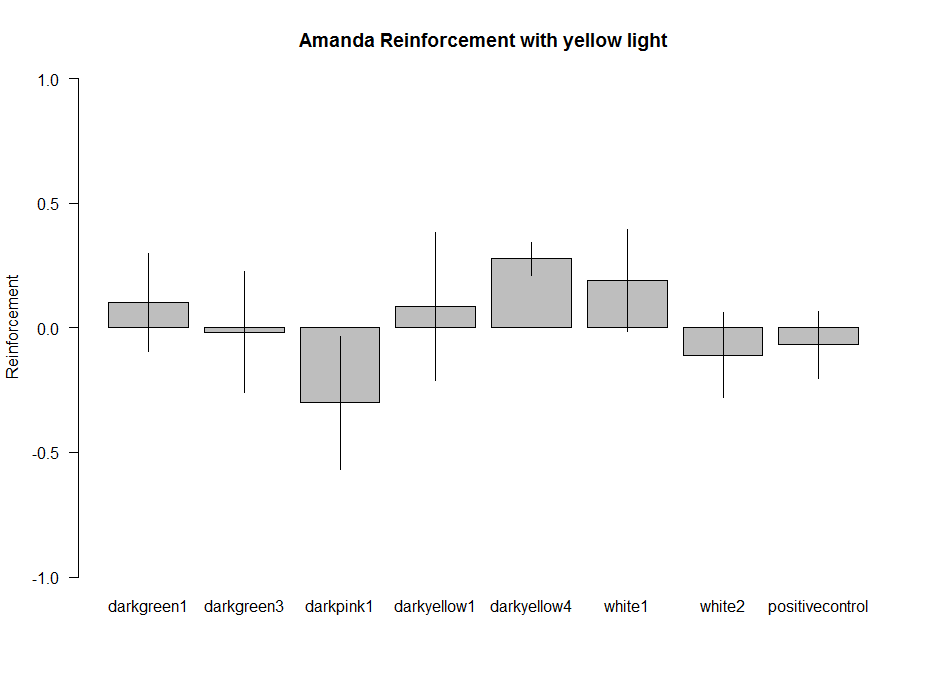
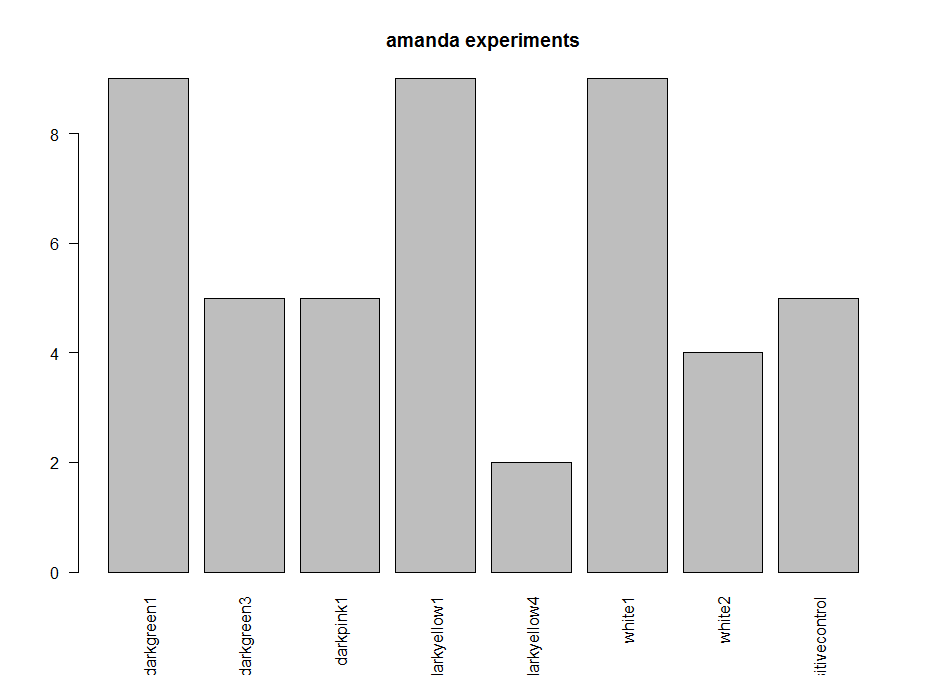
I can´t see if effects reproduce in different hands because I do not have the data from Amanda, so I will just pool all the data together.
Category: neuronal activation, Operant reinforcment, Optogenetics | No Comments
We do not seem to reproduce each other results
on Tuesday, August 14th, 2018 2:40 | by Christian Rohrsen
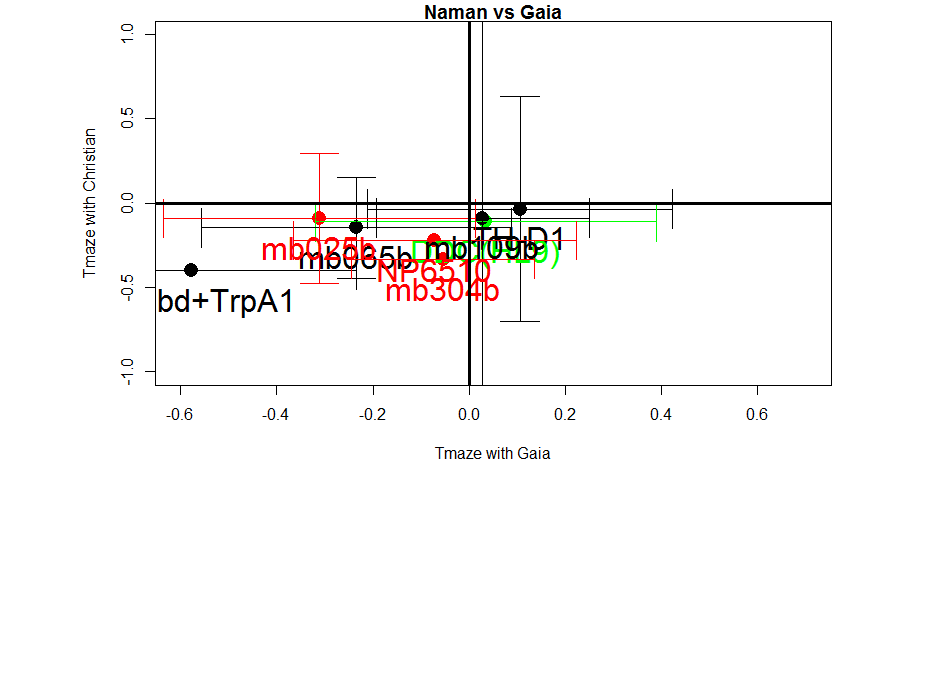
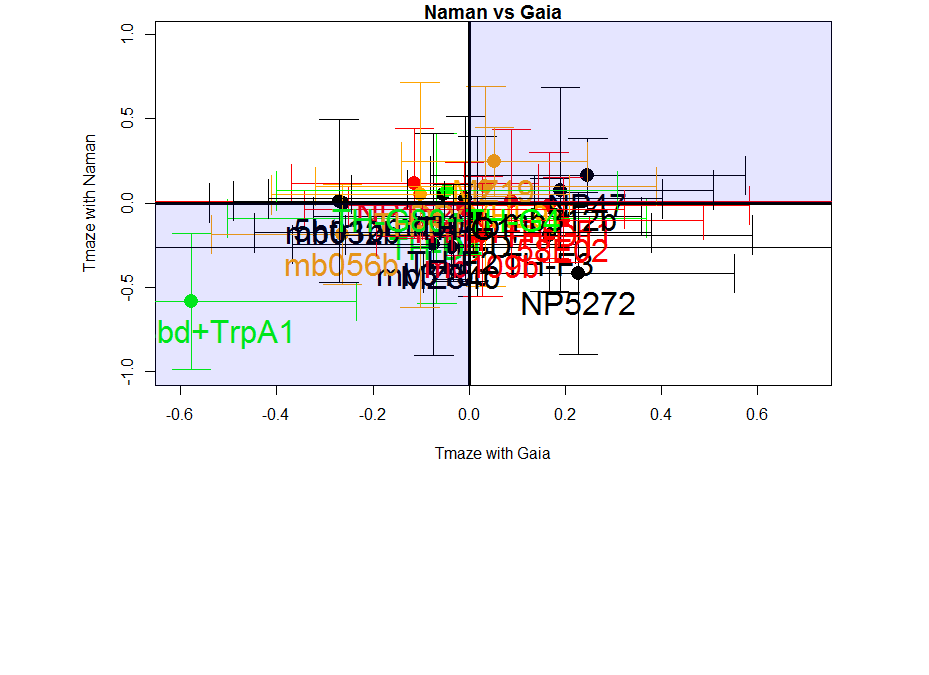
Since we do not reproduce each others results, together with the previous post with the bootstrapping I can confirm that these neurons do not have an effect in reinforcement (in general). But we will focus on TH-D’
 Residuals:
Min 1Q Median 3Q Max
-0.26964 -0.15074 0.07699 0.10043 0.24611
Coefficients:
Estimate Std. Error t value Pr(>|t|)
(Intercept) 0.05663 0.12282 0.461 0.661
new_Christian$mean 1.07180 0.56922 1.883 0.109
Residual standard error: 0.1943 on 6 degrees of freedom
Multiple R-squared: 0.3714, Adjusted R-squared: 0.2667
F-statistic: 3.545 on 1 and 6 DF, p-value: 0.1087
 Residuals:
Min 1Q Median 3Q Max
-0.43451 -0.10793 0.02633 0.14283 0.28667
Coefficients:
Estimate Std. Error t value Pr(>|t|)
(Intercept) -0.05975 0.03595 -1.662 0.1101
new_Gaia$mean 0.33806 0.19627 1.722 0.0984 .
—
Signif. codes: 0 ‘***’ 0.001 ‘**’ 0.01 ‘*’ 0.05 ‘.’ 0.1 ‘ ’ 1
Residual standard error: 0.1787 on 23 degrees of freedom
Multiple R-squared: 0.1142, Adjusted R-squared: 0.07574
F-statistic: 2.967 on 1 and 23 DF, p-value: 0.09842
Category: neuronal activation, Operant reinforcment, Optogenetics | No Comments
Bootstrapping NorpA flies without G4
on Tuesday, August 14th, 2018 2:19 | by Christian Rohrsen
To see if there is an effect of the activation of these neurons in general, I thought of bootstrapping all the flies containing NorpA without G4s to see if the statistics are similar to that of my screen.
here the final screen
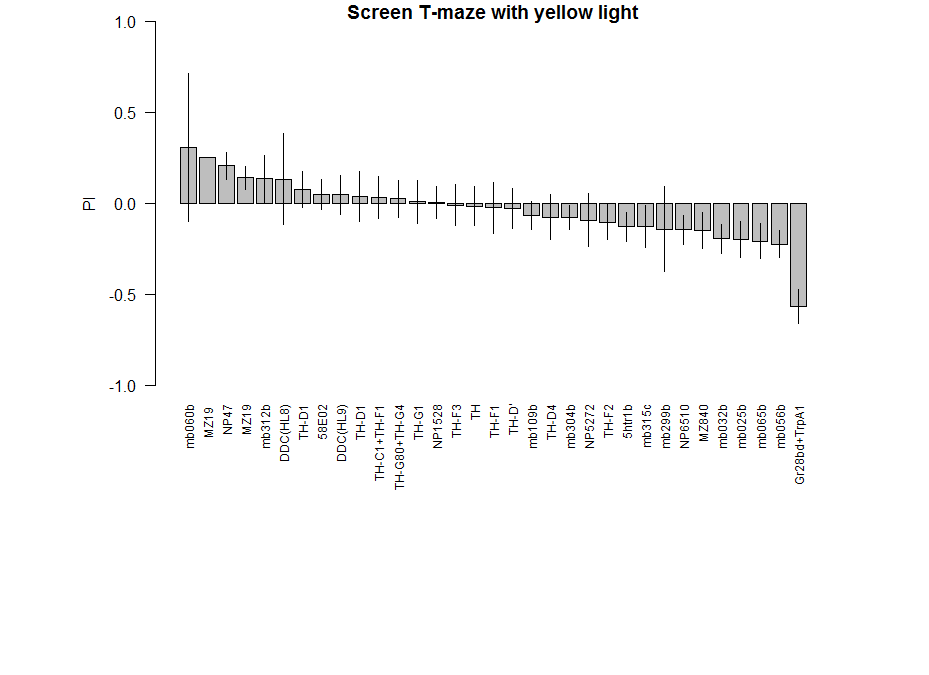
Here a total of 37 Tmaze experiments containing NorpA with UAS-GtACRs, UAS-Chrimson or UAS-ChR2XXL but without G4. Experiments are from Naman, Gaia and me, here the pooled effect:
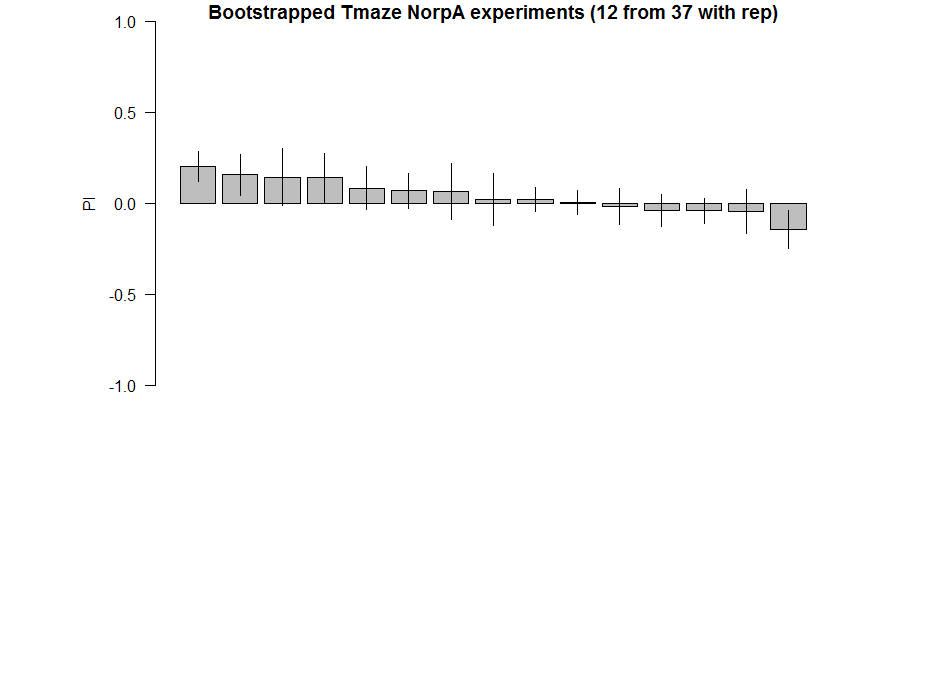
 Here the barplot of the result of 12 samples (with repetitions) for 20 times. Considering 37 experiments are closer to the real true distribution of NorpA flies, we sample from them to observe the probability of obtaining false positives, as well as the distributions.
 Here the boxplot
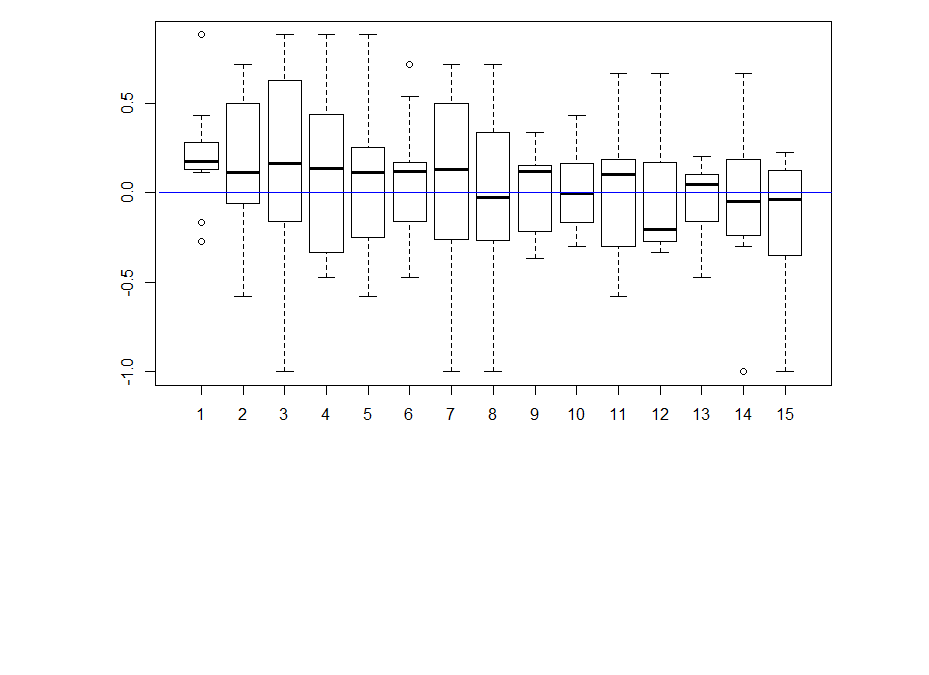 From this results I would deduce that most of these neurons have no effect on their reinforcement. This idea came because I saw that the phenotype scores of th-G4+th-G80>Chrimson was always close to zero in all of the behavioral setups. I thought that this could show that the dopaminergic neurons have an effect that is context dependent and that is why PIs might be more extreme than with the negative control (th-G4+th-G80>Chrimson).
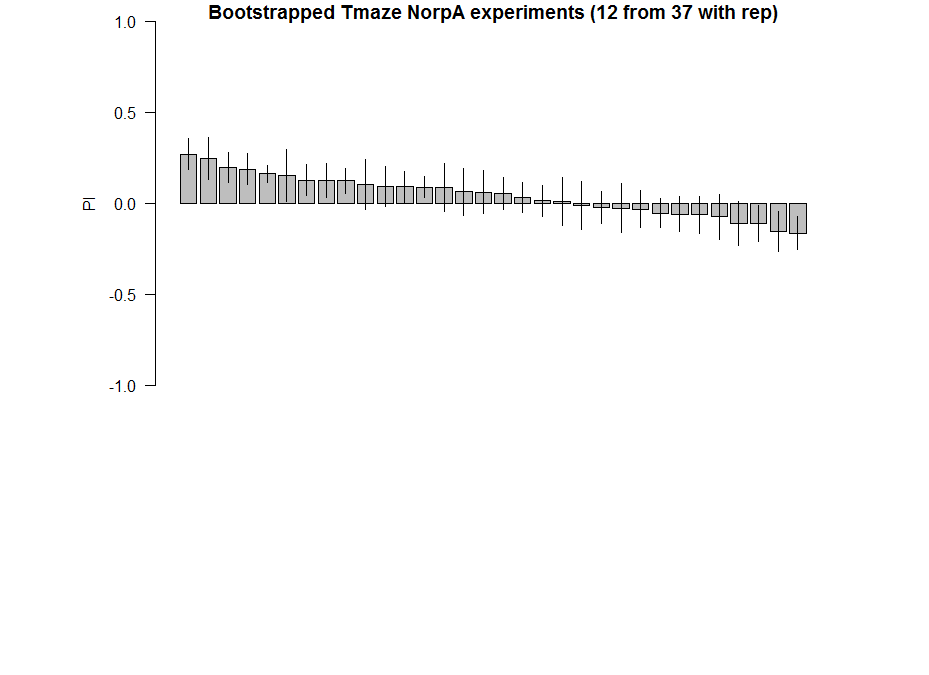
This is a quick edit to see how it would look with 32 lines (the same number as for the real screen)
Category: neuronal activation, Operant reinforcment, Optogenetics | No Comments
Role of dopaminergic neurons in operant behaviour
on Friday, July 27th, 2018 3:54 | by Gaia Bianchini
Positive Control: Gr28bd-G4, TrpA1-G4
Parameters: Light: intensity (500 Lux side, 1000 Lux bottom); frequency = 20Hz; Delay = 1 ms; Duration = 9.9 ms; volts = 6.4
Red lines: completed
mb025b: not selected against tubby
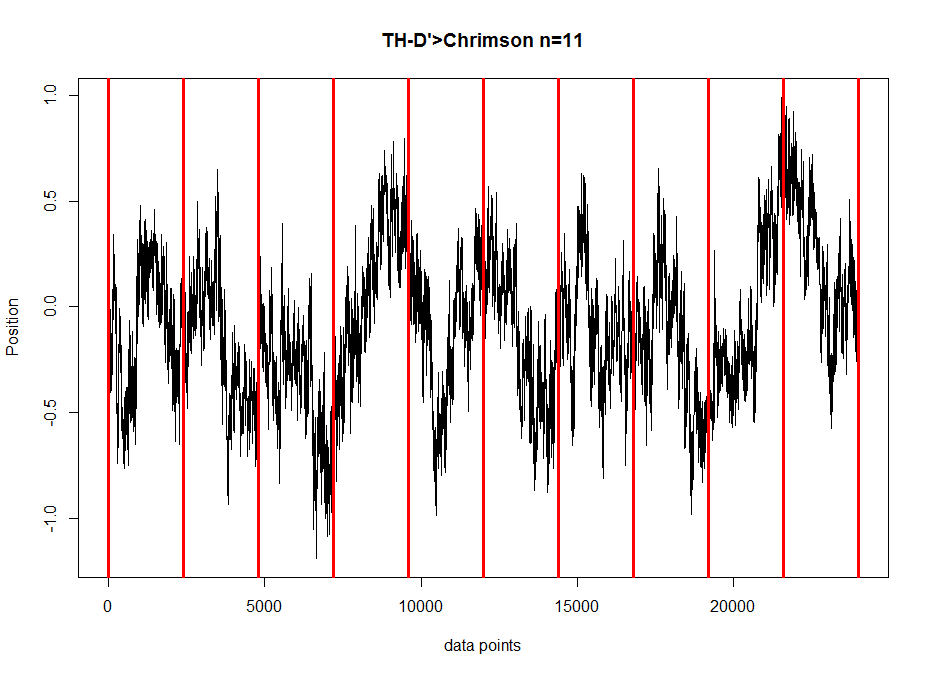
Mean trace of all flies and how degrees of freedom vary over learning
on Monday, July 23rd, 2018 6:40 | by Christian Rohrsen
Mean trace of the positive control in the Joystick to get to see what are the overall dynamics and maybe to get an idea what might be the best score to pick.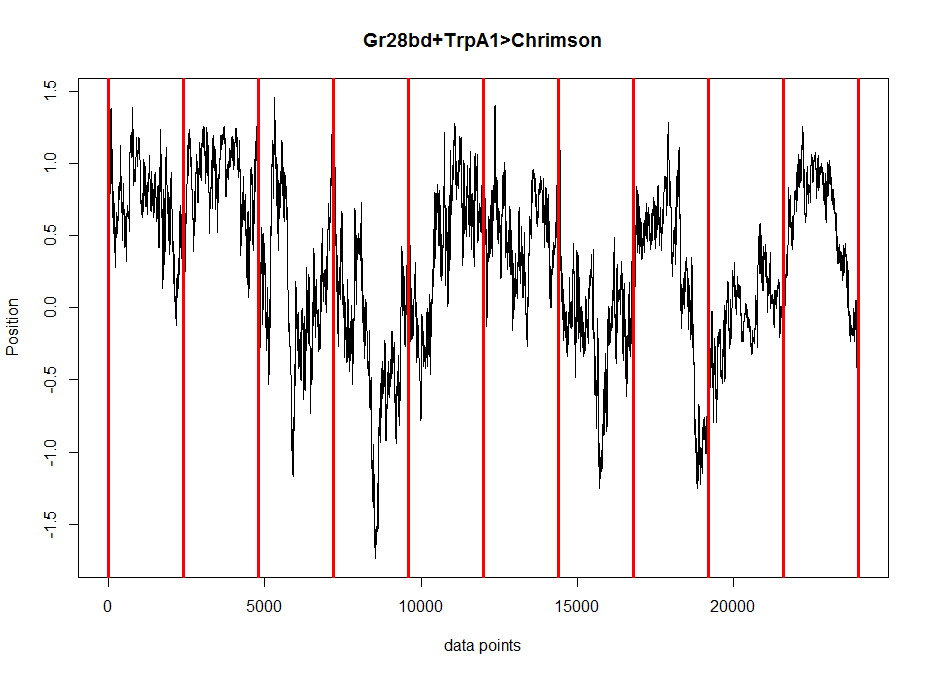 Here the standard deviation of the flies along the time axis. This is just to see if all the flies have more similar phenotypes with each other or not at each time.
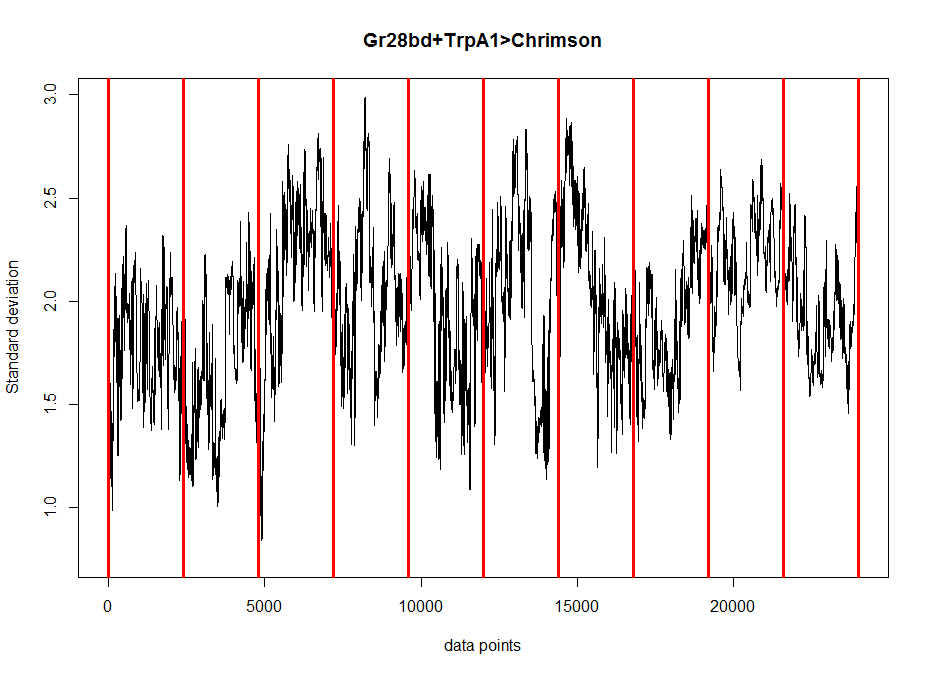
This is to see if the flies have less degrees of freedom at any segment by measuring the standard deviation at each segment. There does not seem to be any effect. Although this might be mixed with the wiggle scores. I think measuring entropy is a better measure.
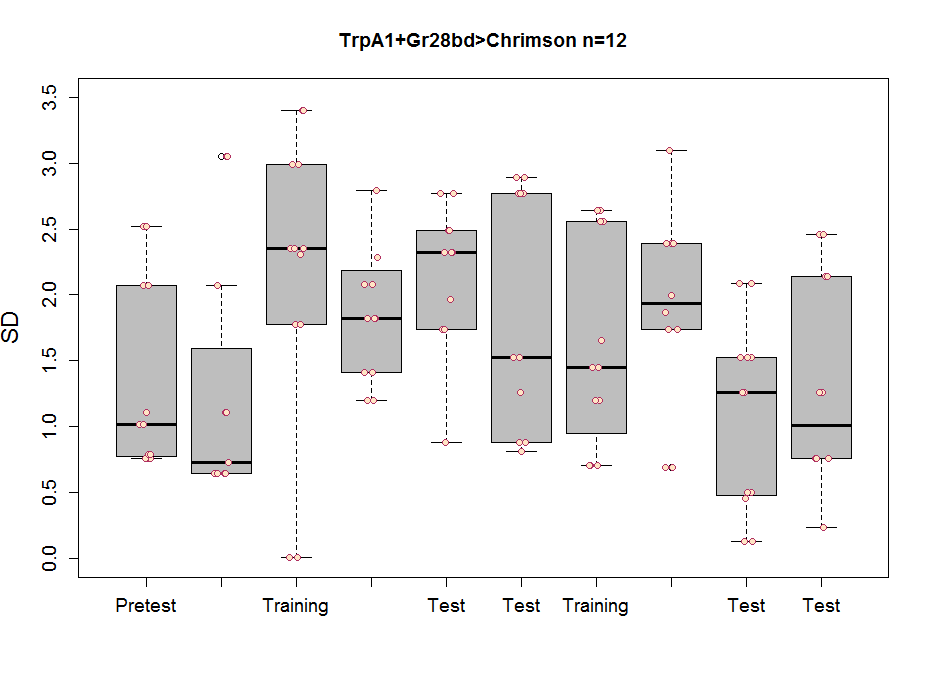
All the same plots as above but for TH-D’, the interesting line from the screen.
Standard deviation across flies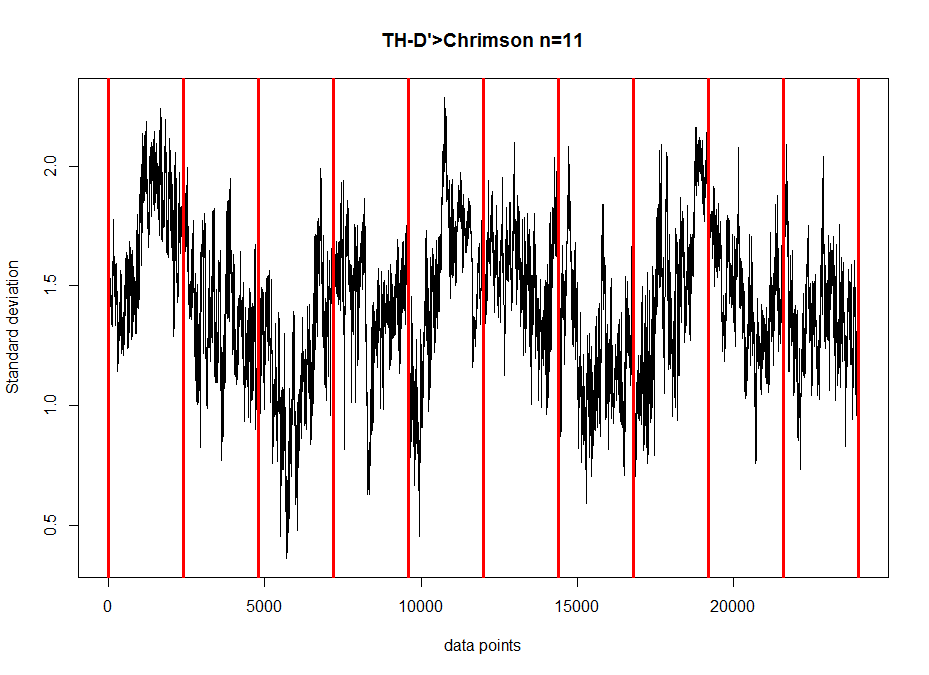
Standard deviation across segments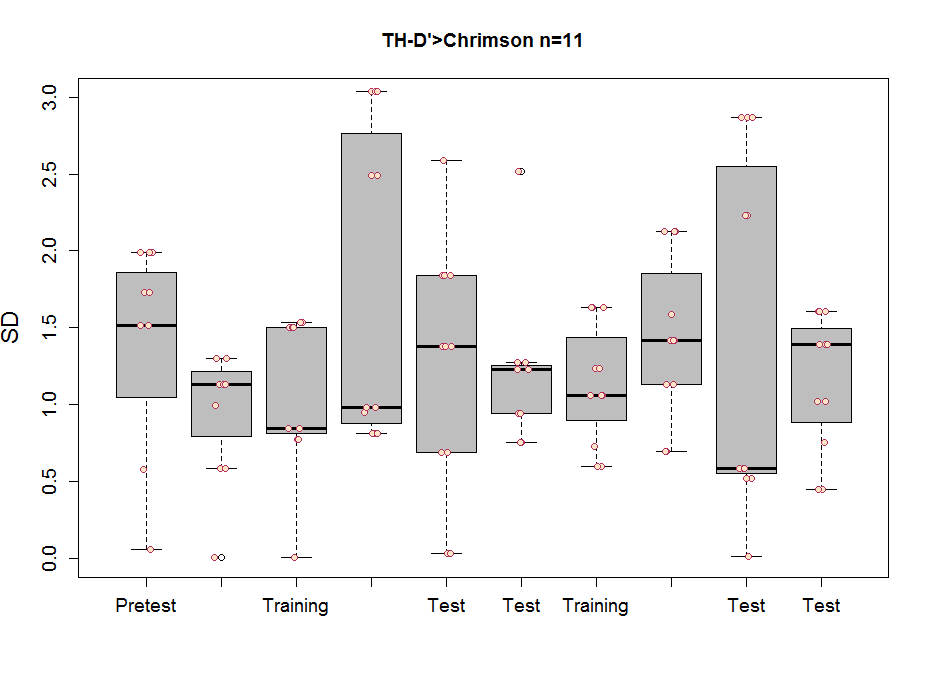
Performance index for modelling for data in the Y-mazes
on Monday, July 23rd, 2018 5:30 | by Christian Rohrsen
This are the performance indices for the different models performed to estimate the valence of the dopaminergic clusters. AIC: Akaike Information Criteria; BIC: Bayesian information Criteria; LogLikelihood: log Likelihood estimation
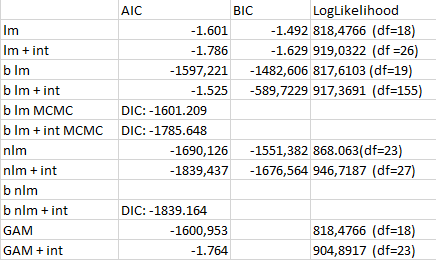
lm: linear model
+ int: taking double interaccions into consideration
b lm: bayesian linear model with bayesglm function
b lm MCMC: bayesian linear model with MCMCglm function
nlm: nonlinear model with lm function with splines fitted
b nlm: splines fitted to each cluster and MCMCglm function
GAM: general additive model with gam function
Adding double interactions seems to produce better models, nonlinearities also make models better and frequentist also. To me it seems like this data might be noise and therefore adding interactions, nonlinearities and frequentist methods is just fitting the noise better (overfitting) and that is why I get better scores with them. In addition, care needs to be taken since I use different functions that calculate the model performance scores differently (although the formulas are theoretically the same for all!)
The Tmaze Experiments : Screen results as on 22-7-18
on Sunday, July 22nd, 2018 6:41 | by Naman Agrawal
Yellow 1 (Positive Control): Gr28bd-G4, TrpA1-G4
Parameters: Light: intensity (500 Lux side, 1000 Lux bottom); frequency = 20Hz; Delay = 1 ms; Duration = 9.9 ms; volts = 6.4
Category: neuronal activation, open science, Operant learning, Optogenetics | No Comments
Finding the interesting lines
on Friday, July 20th, 2018 3:46 | by Christian Rohrsen
This is the correlation from the T-maze experiments from Gaia and Naman. Neither ranked nor regular correlation show any significant effect. This means that these effects seem to be random, at least for most of them, is this an overfitting result?
I would say blue 1 is a line that was negative for all the tests I have so far seen. So this might be an interesting line. What to do next?
I would unblind the blue1, which is TH-D’. It was shown to be required for classical conditionning in shock and temperature learning (Galili et al. 2014). Another interesting observation is that th-g4+th-g80 seems to have like zero PI scores in all of the experiments (Naman and Gaia in the Tmaze, Joystick and Y-mazes). So could it be that all of these neurons have indeed a meaning, but is depending every time in the context?? Maybe Vanessa Ruta´s work might be interesting for that.