Flying capability of flies with DA or OA neurons silenced
on Monday, December 14th, 2015 1:54 | by Axel Gorostiza
As a control for my T-Maze experiments I decided to test if treated flies were able to fly at the same conditions they were tested in the T-Maze (32°C).
As in the T-Maze experiments, I put the flies 15 min at 32°C before testing them at the same temperature.
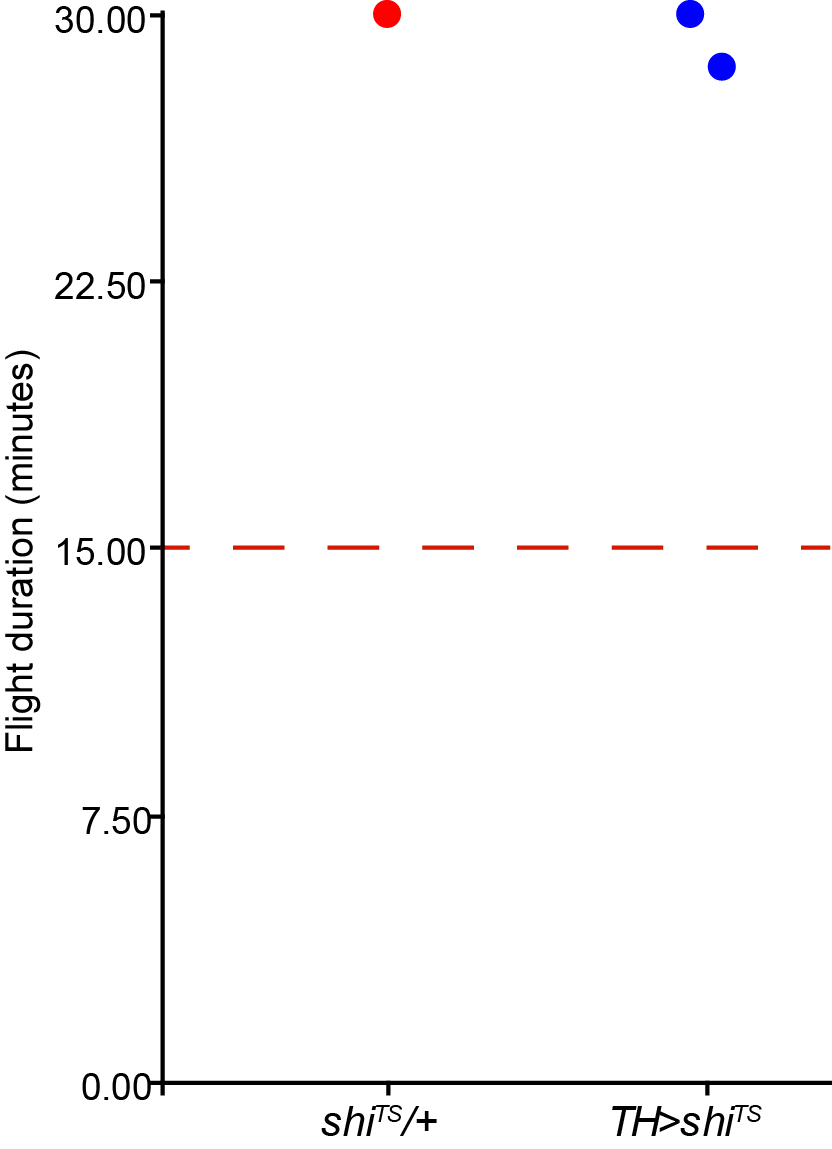
The dashed line at 15 min indicates when a T-Maze experiment would have ended.
All flies tested flew almost twice the time required to perform a T-Maze experiment.

Category: wing clipping | No Comments
Update: Phototactic Flexibility (OA Neurons) & “Stainings”
on Monday, December 14th, 2015 1:07 | by Bianca Birk
I started testing some more tbh-GAL4-subgroups. In Fig. 1 you see all tbh-subgroups, the last 5 in the graph are the newest trials (n=2).
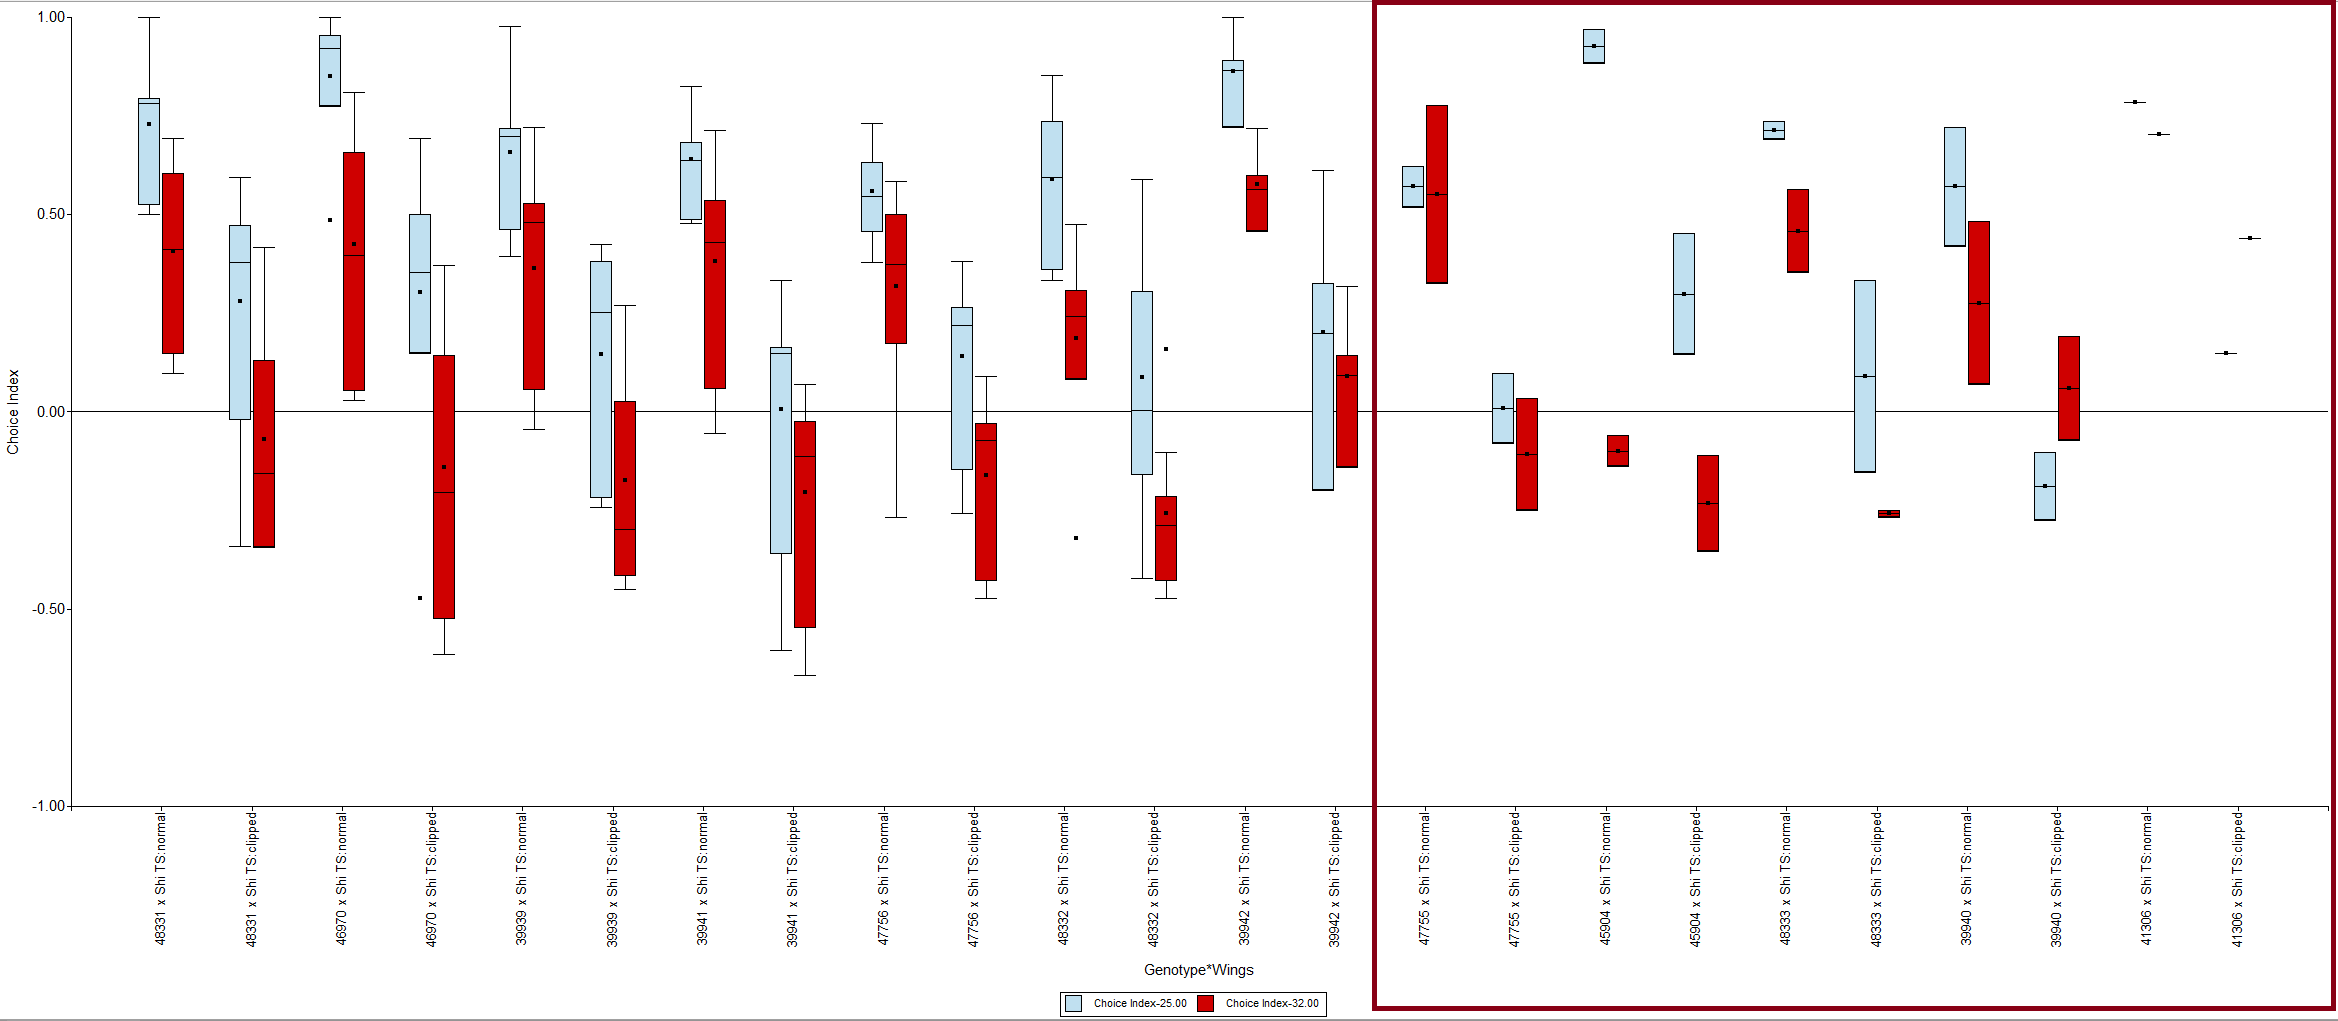
Fig. 1: tbh-subgroups screen
Moreover I dissected some more brains.
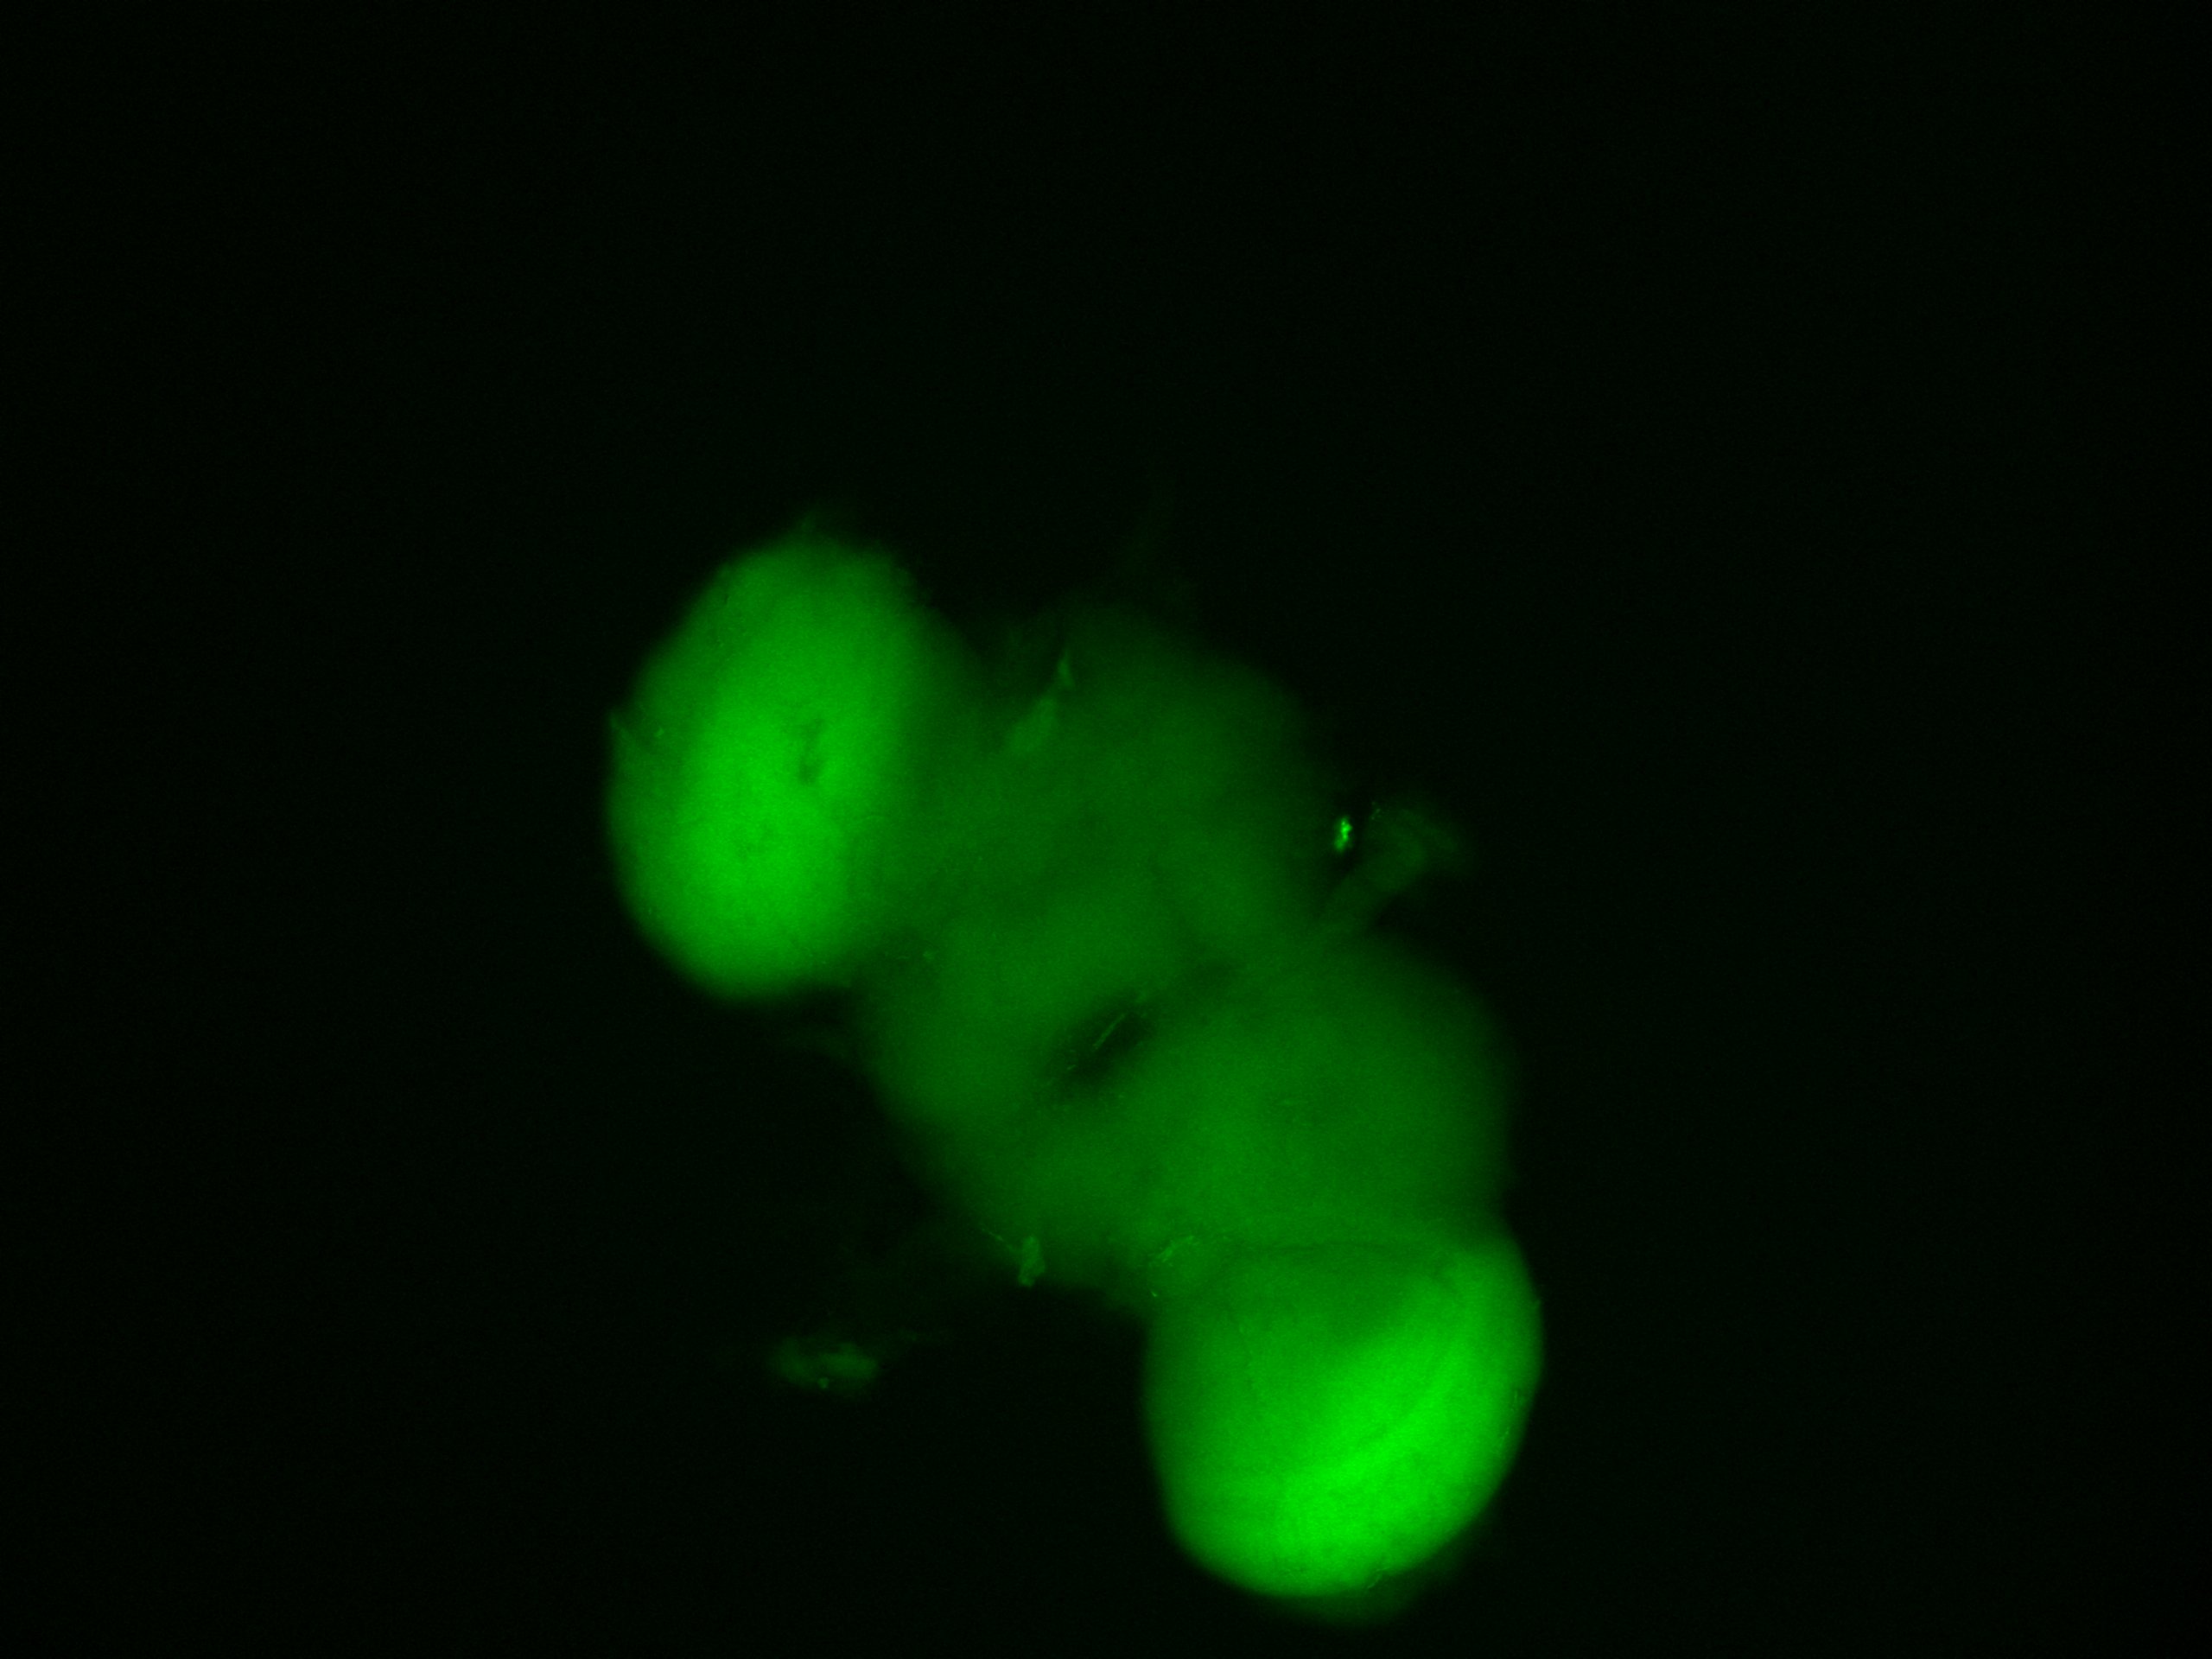
Fig 2: tbh(46970) x GFP (nucl.)
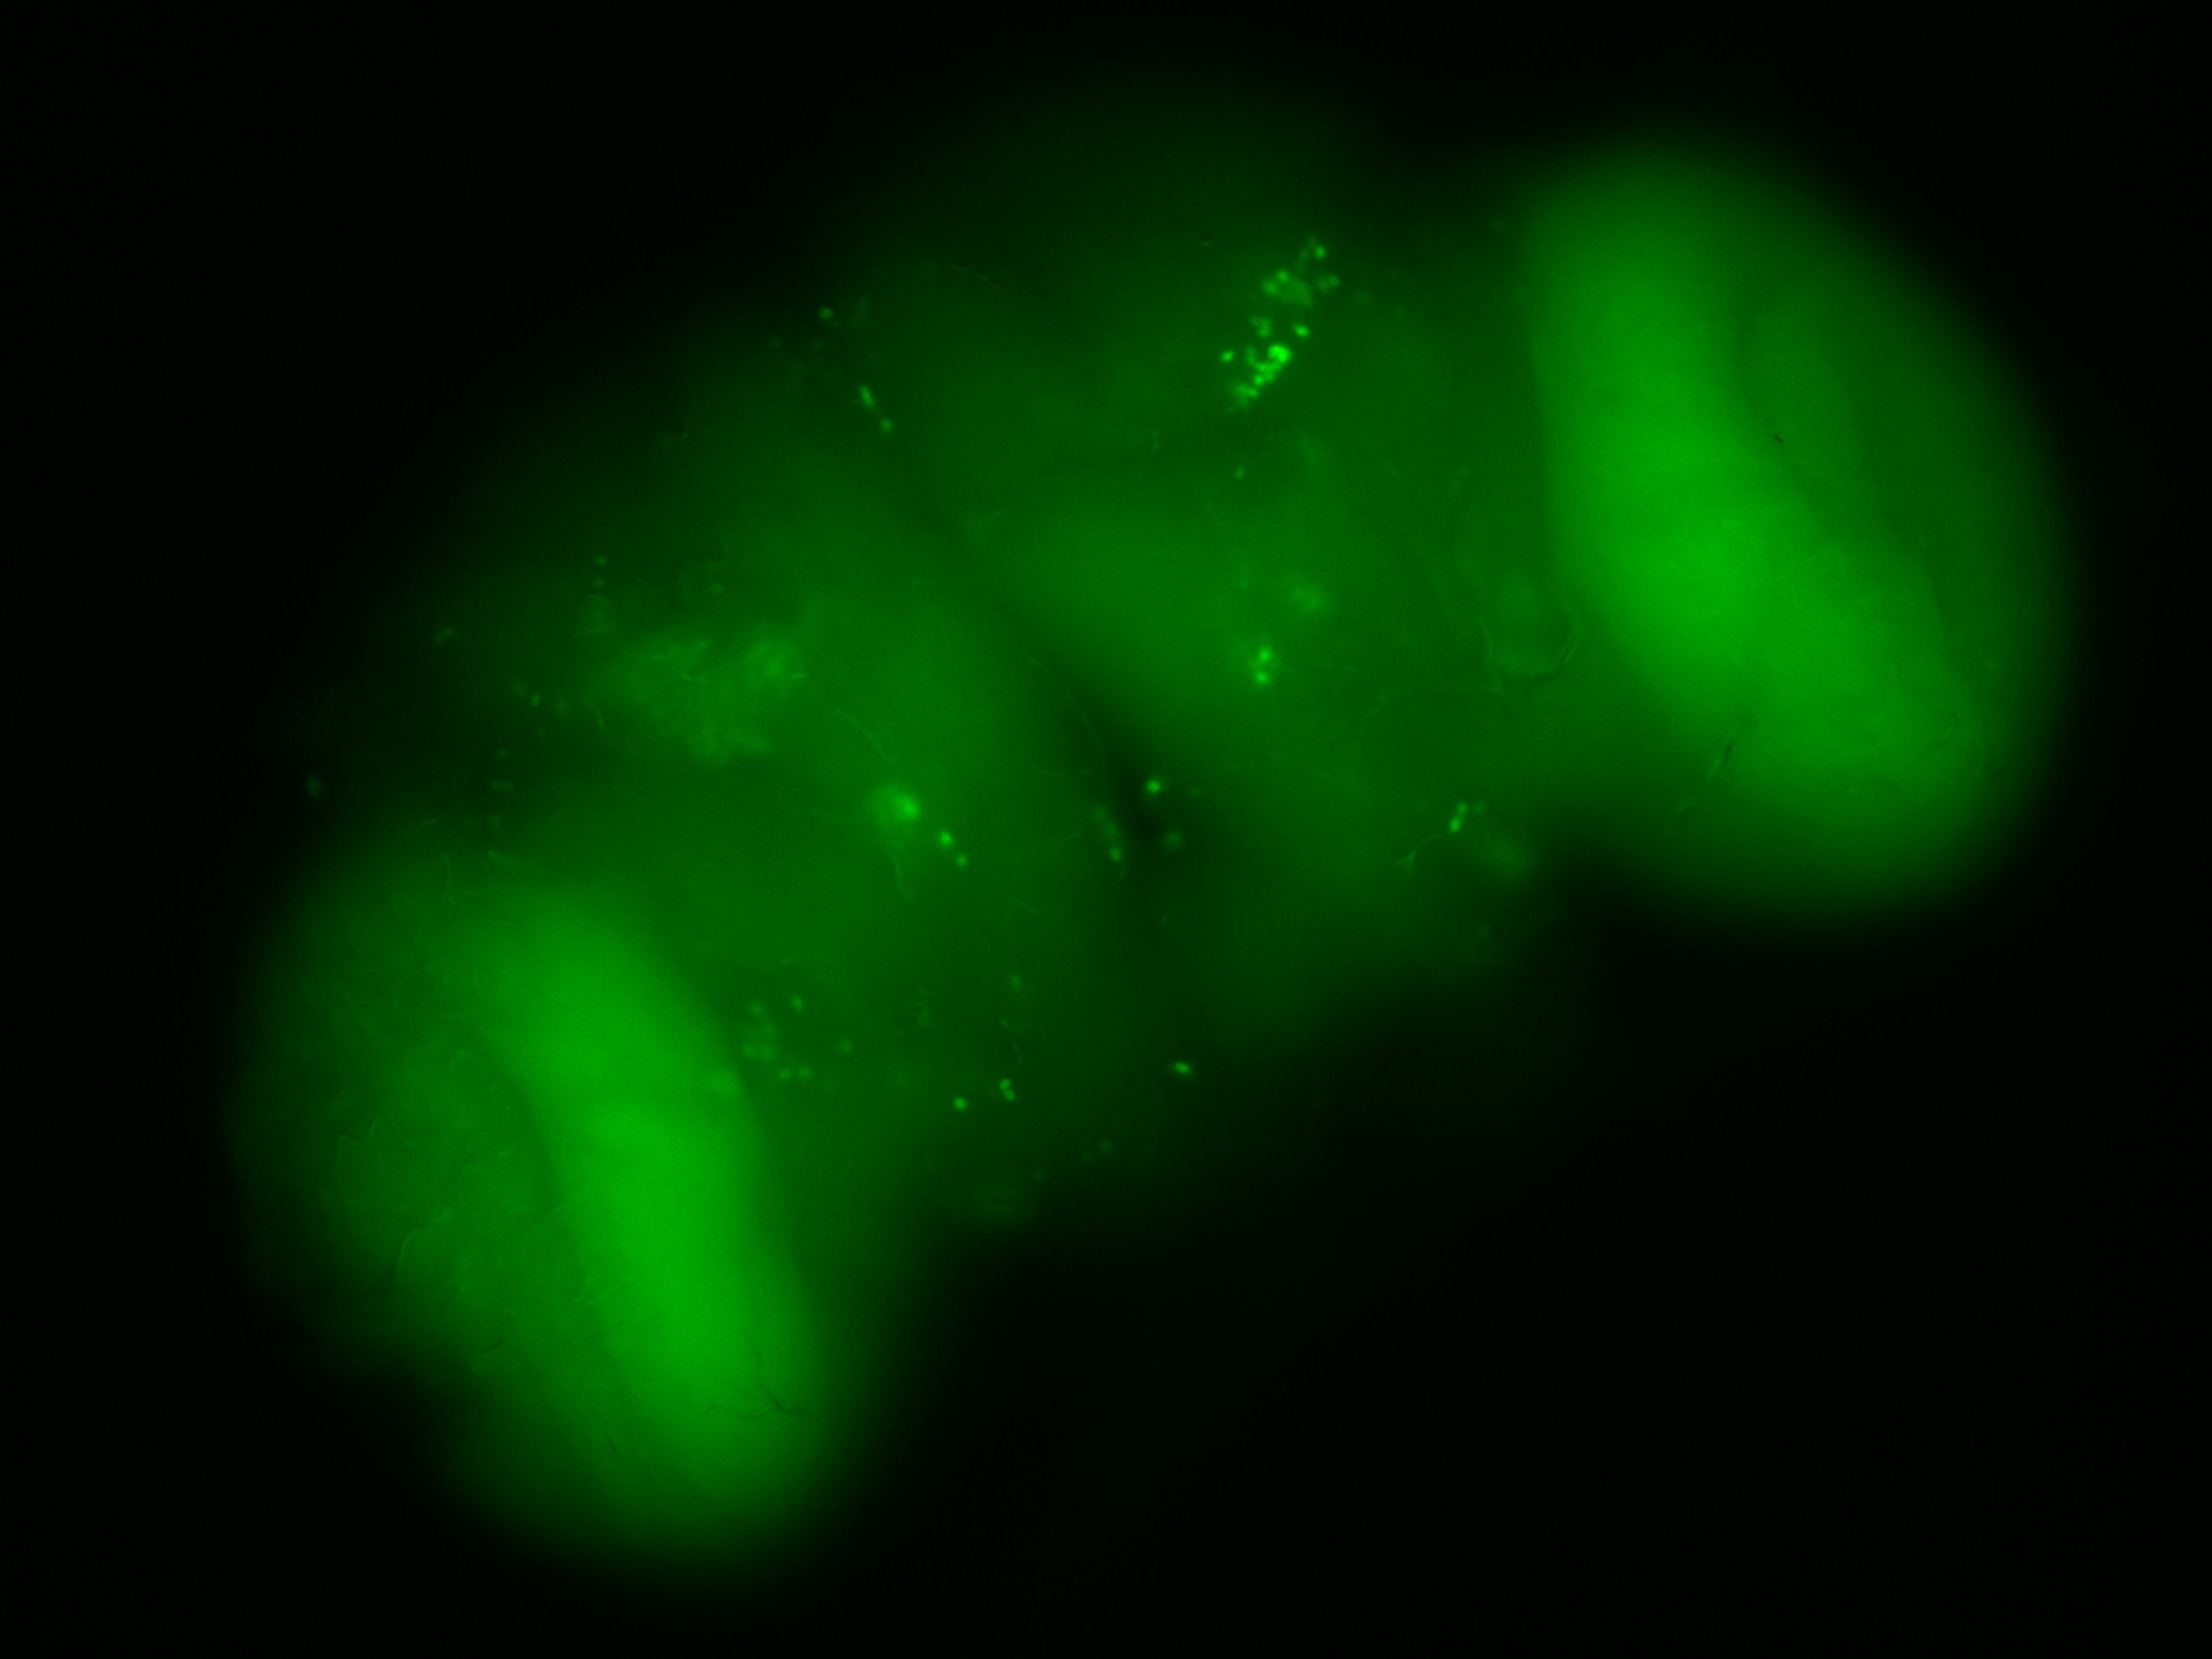
Fig 3: tbh(48332) x GFP nucl
Category: wing clipping | No Comments
Update 2: Variability of Phototaxis 3
on Monday, December 14th, 2015 12:47 | by Isabelle Steymans
Now that I reached an N of 4 for the flies of tube 0, I decided that this will be the final amount of groups of flies that will be tested (Fig.1+2). Because it is really hard to get 40 flies of the tube 0 in one week to be able to test them. Due to the results of the Buridan-paradigm, where we saw that the flies of tube 0 traveled the smallest distance and had the lowest activitytime because they made more pauses than the flies of the other tubes (see Update 2: Variability of Phototaxis 4: Buridan). So I will change the time I give the flies for each decision in the Benzer. I decided to give them 1 minute for each choice instead of 15 seconds, to see if their decision is only due to a lack of time or if it is stable over time.
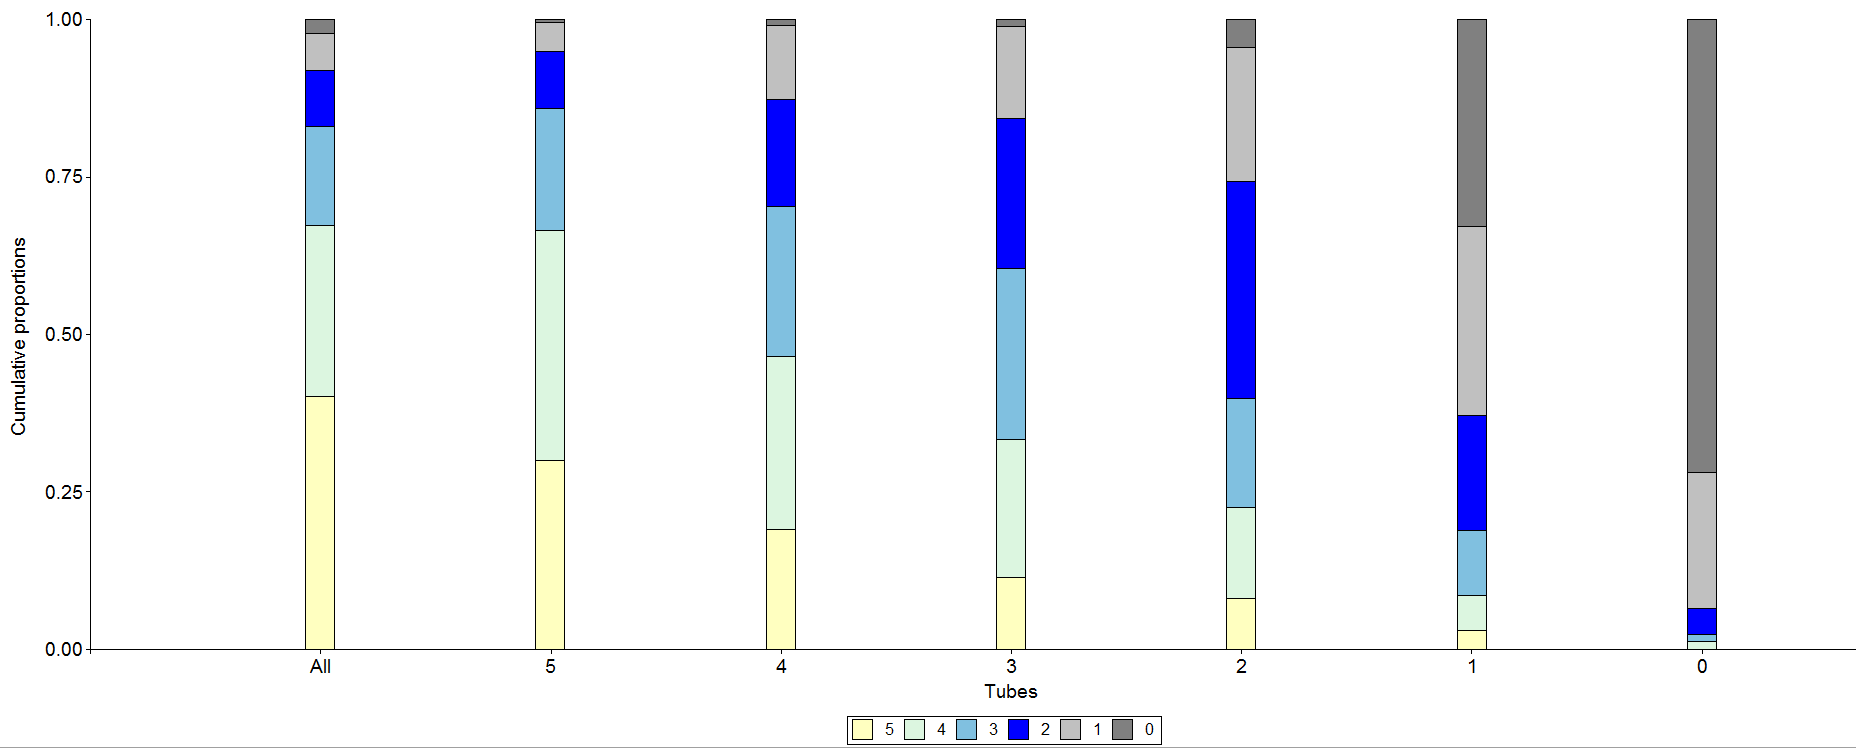
Fig.1: Cumulative proportions in all tubes
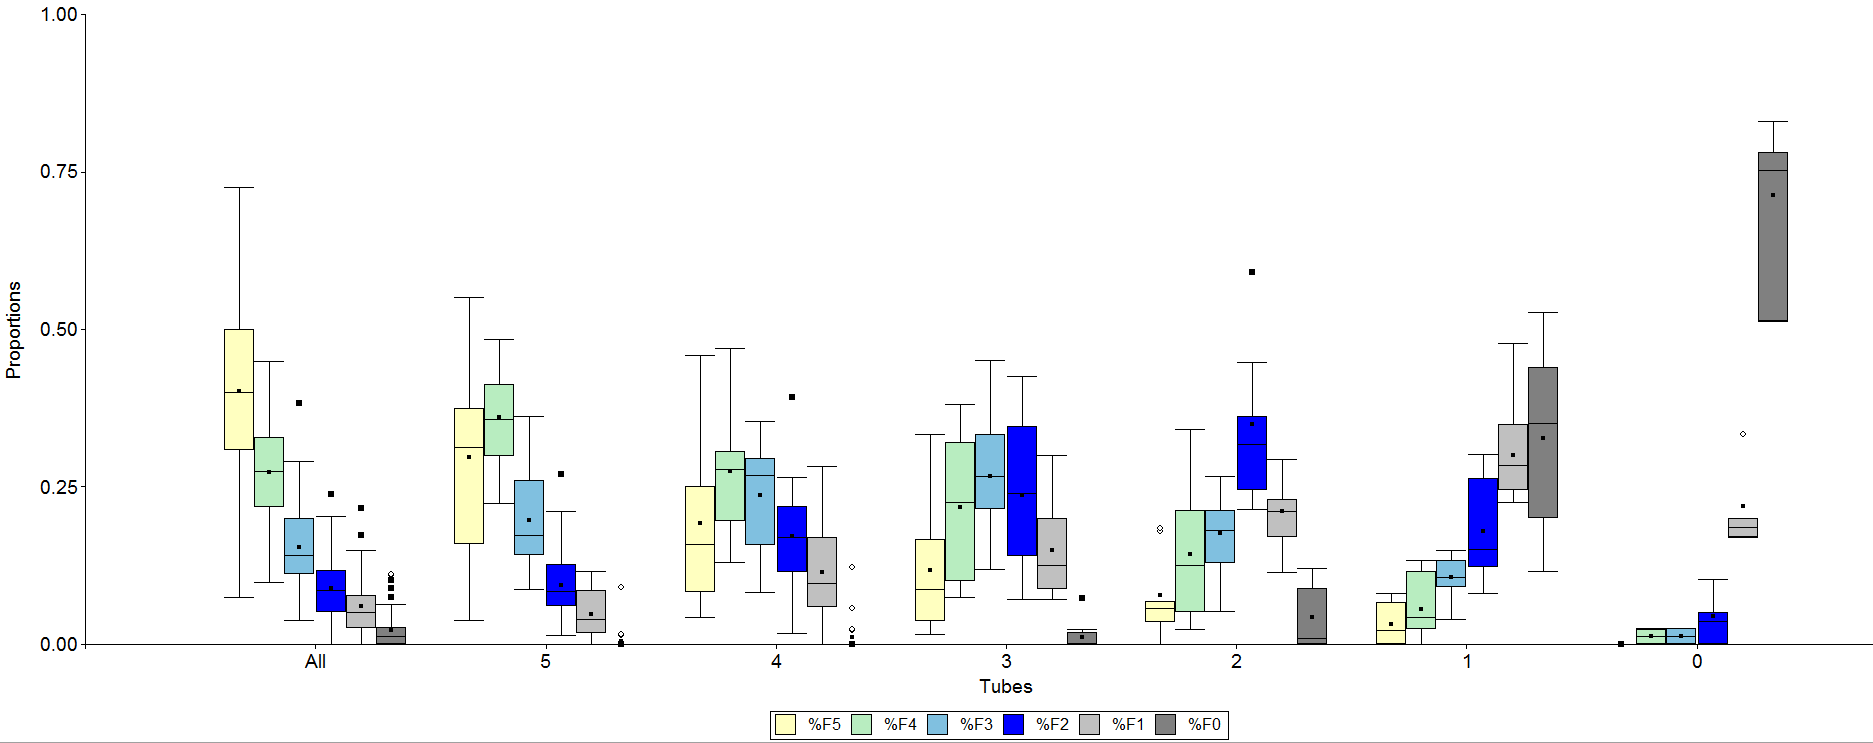
Fig.2: Proportions in all tubes
Update: Genetic Background
on Monday, December 14th, 2015 12:05 | by Amelie Roedel
I did a few more experiments for the test of the genetic background.
Figure 1: the different wildtypes tested on different temperatures (17°C, 25°C, 32°C, 37°C)
Category: temperature_phototaxis, wing clipping | No Comments
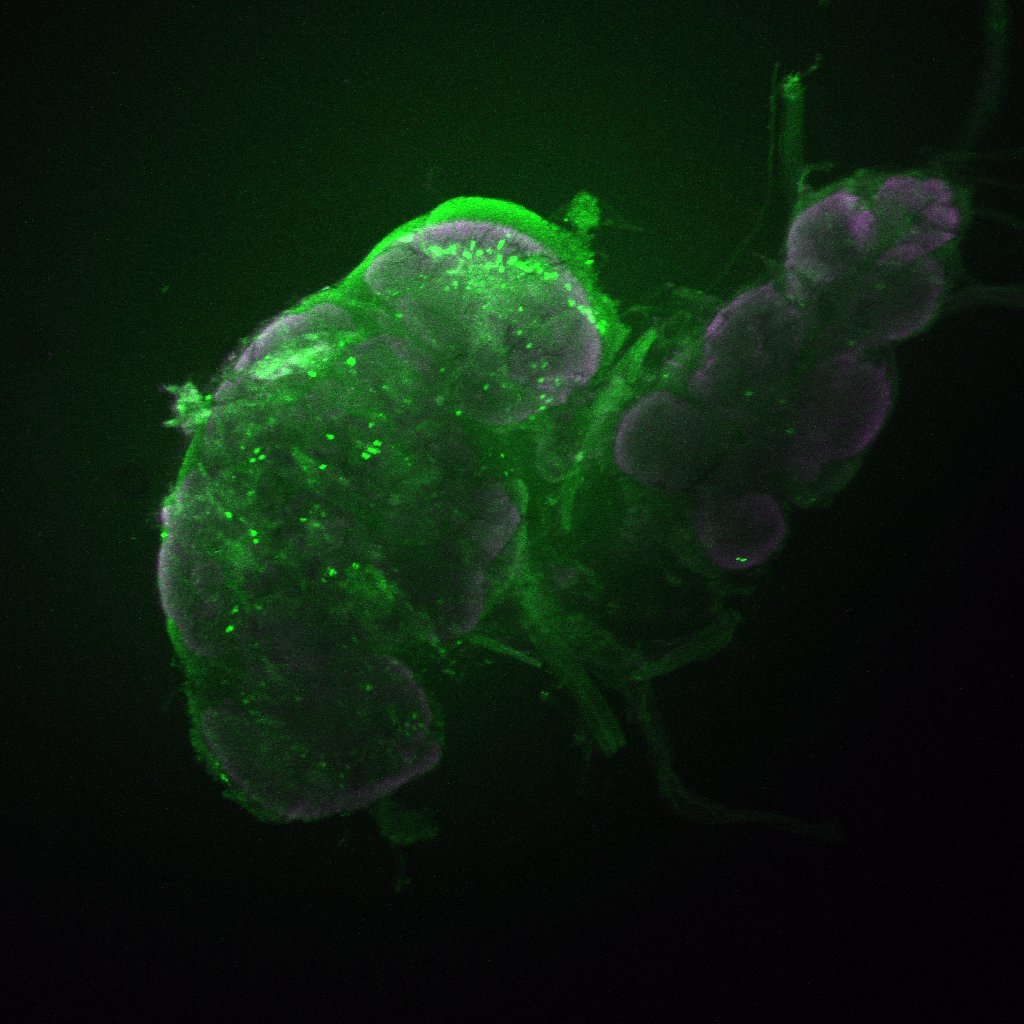
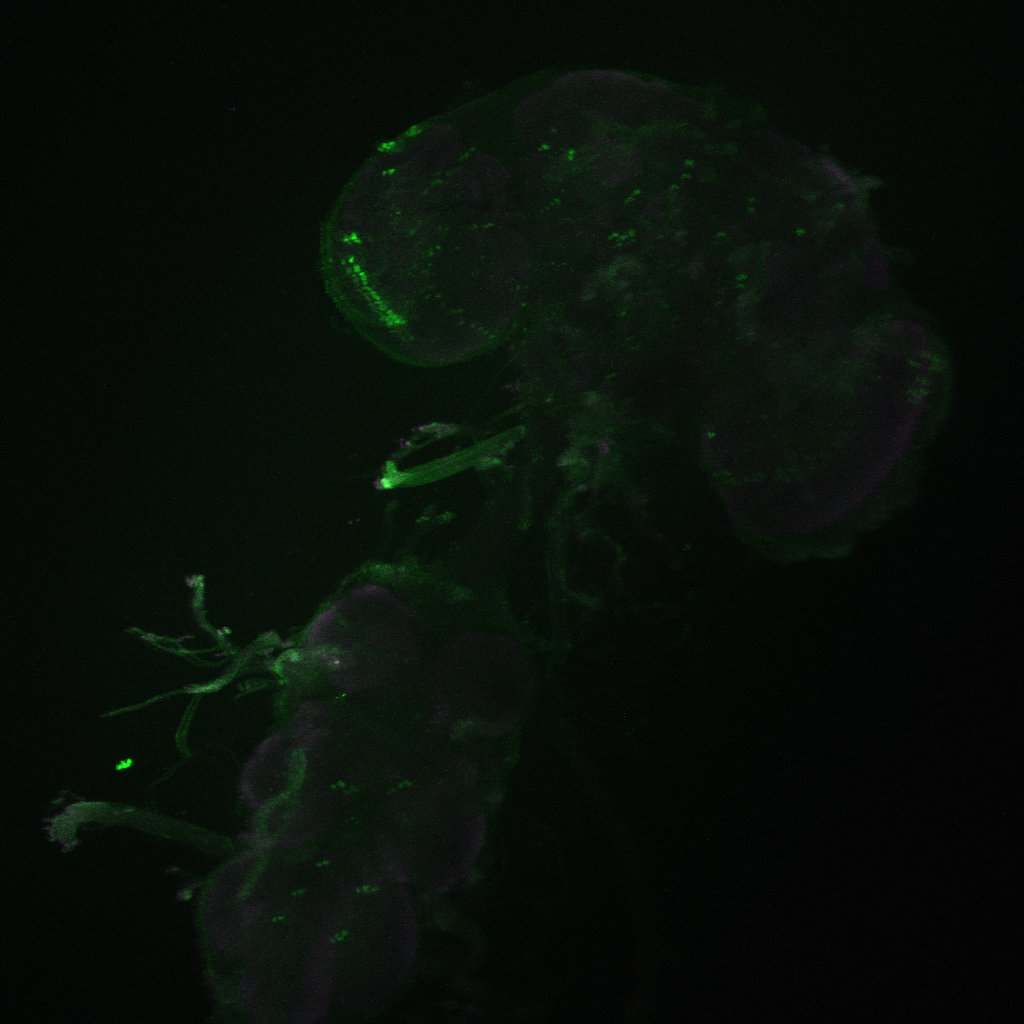
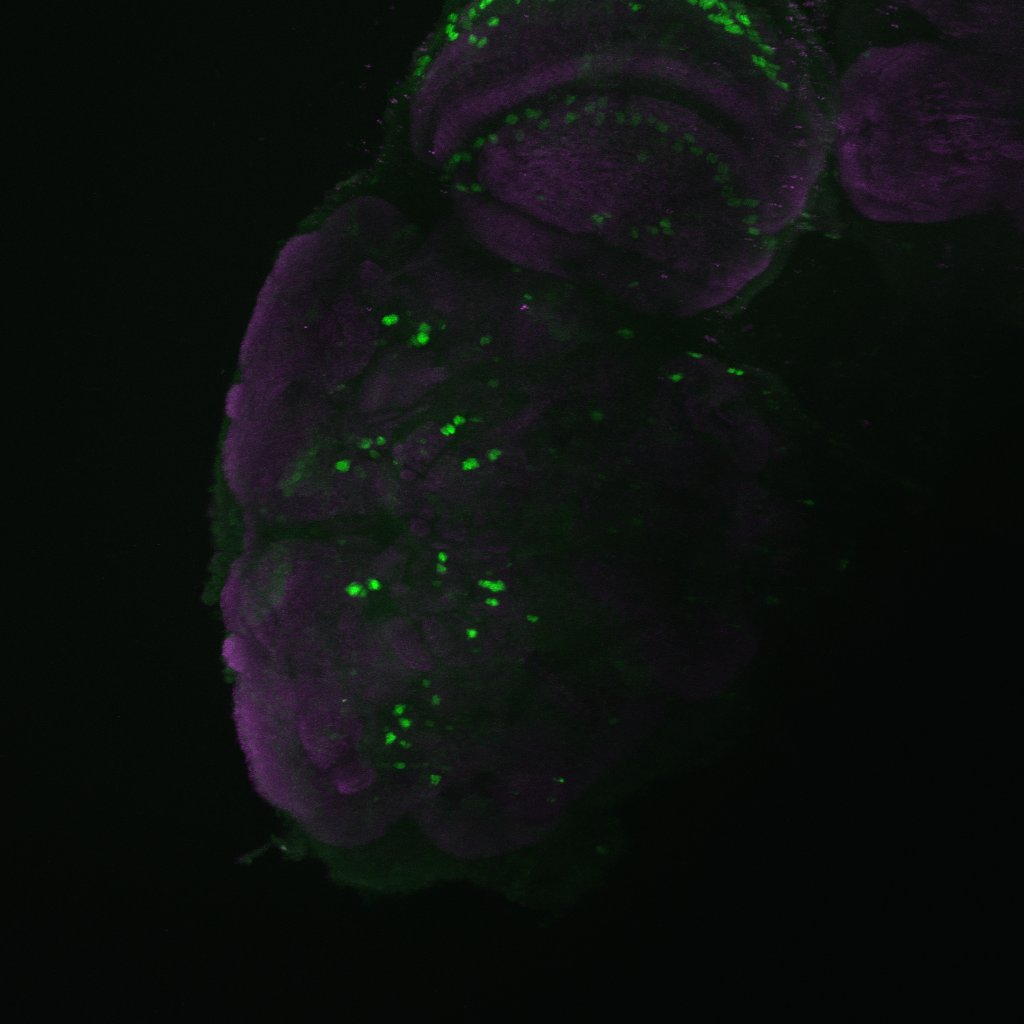
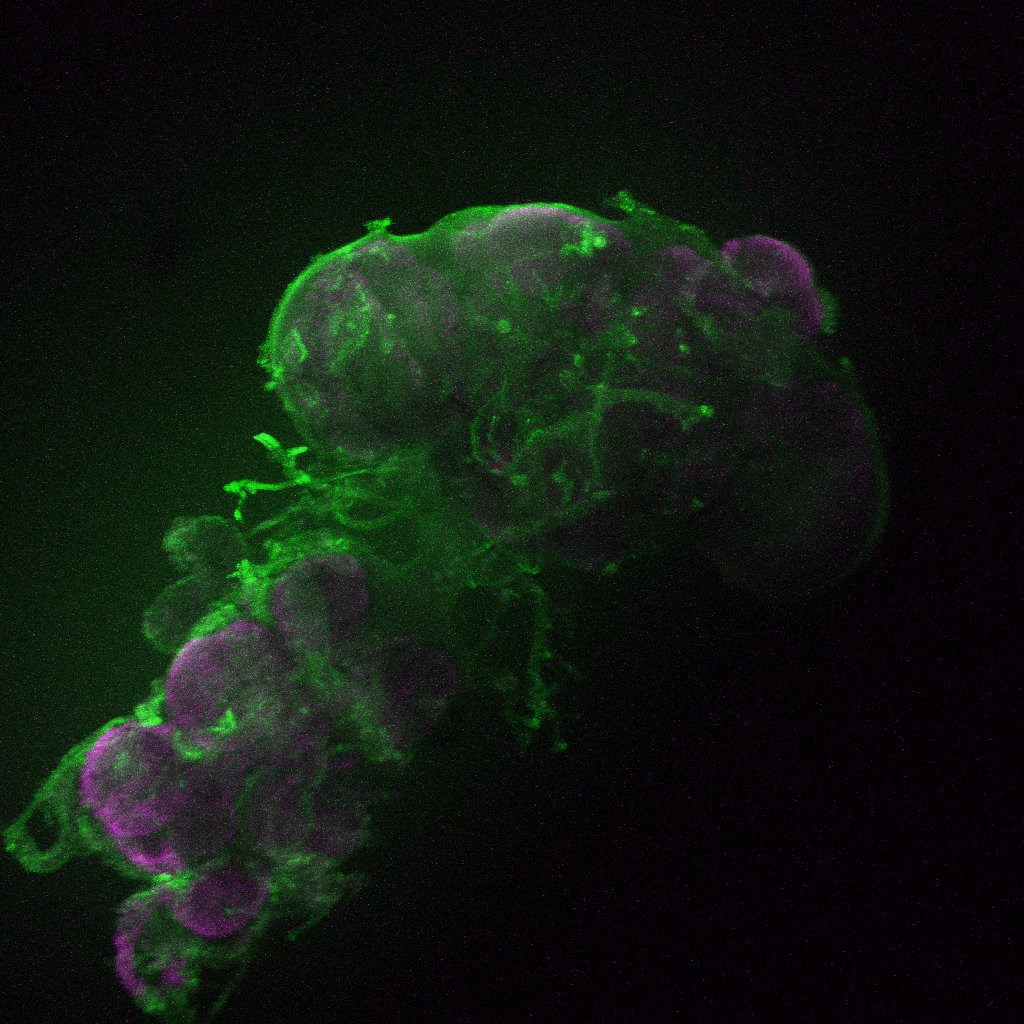
TH-F1 anatomy
on Monday, December 7th, 2015 2:22 | by Axel Gorostiza
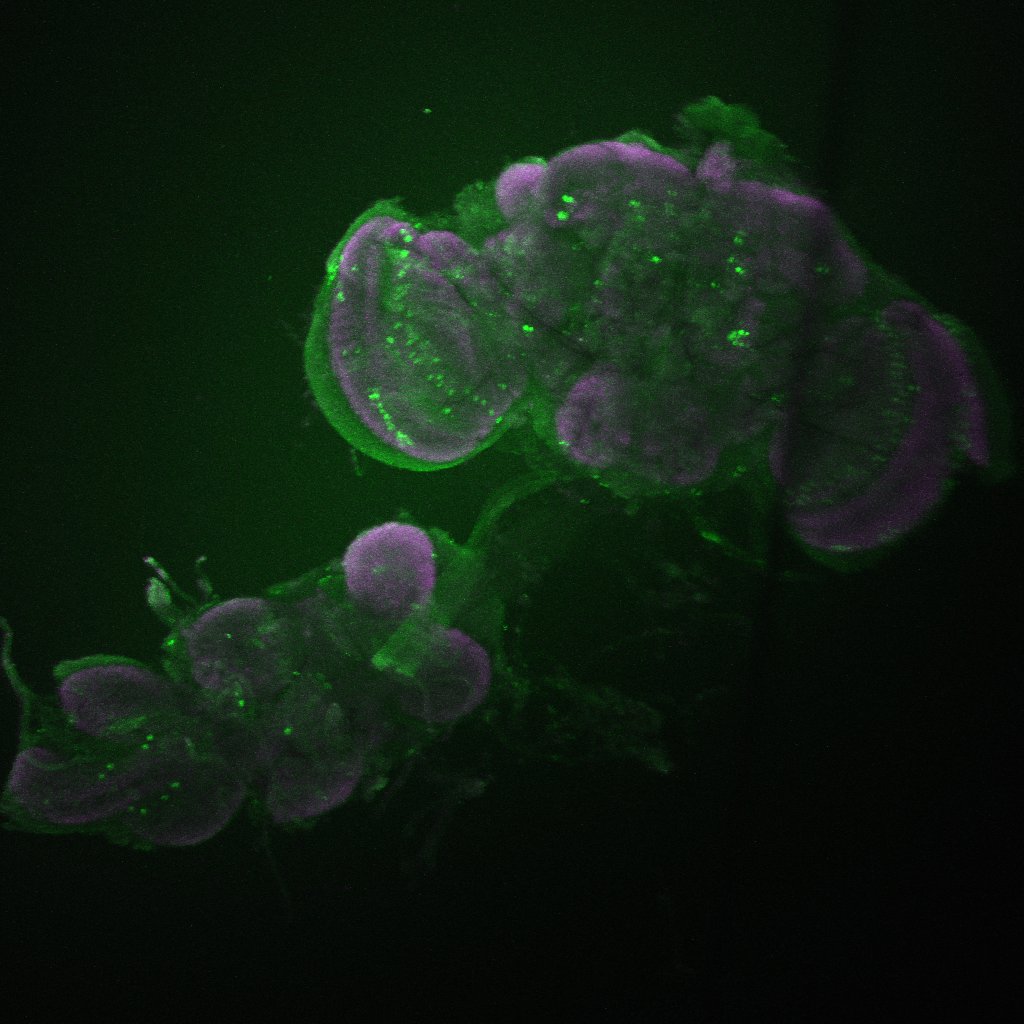
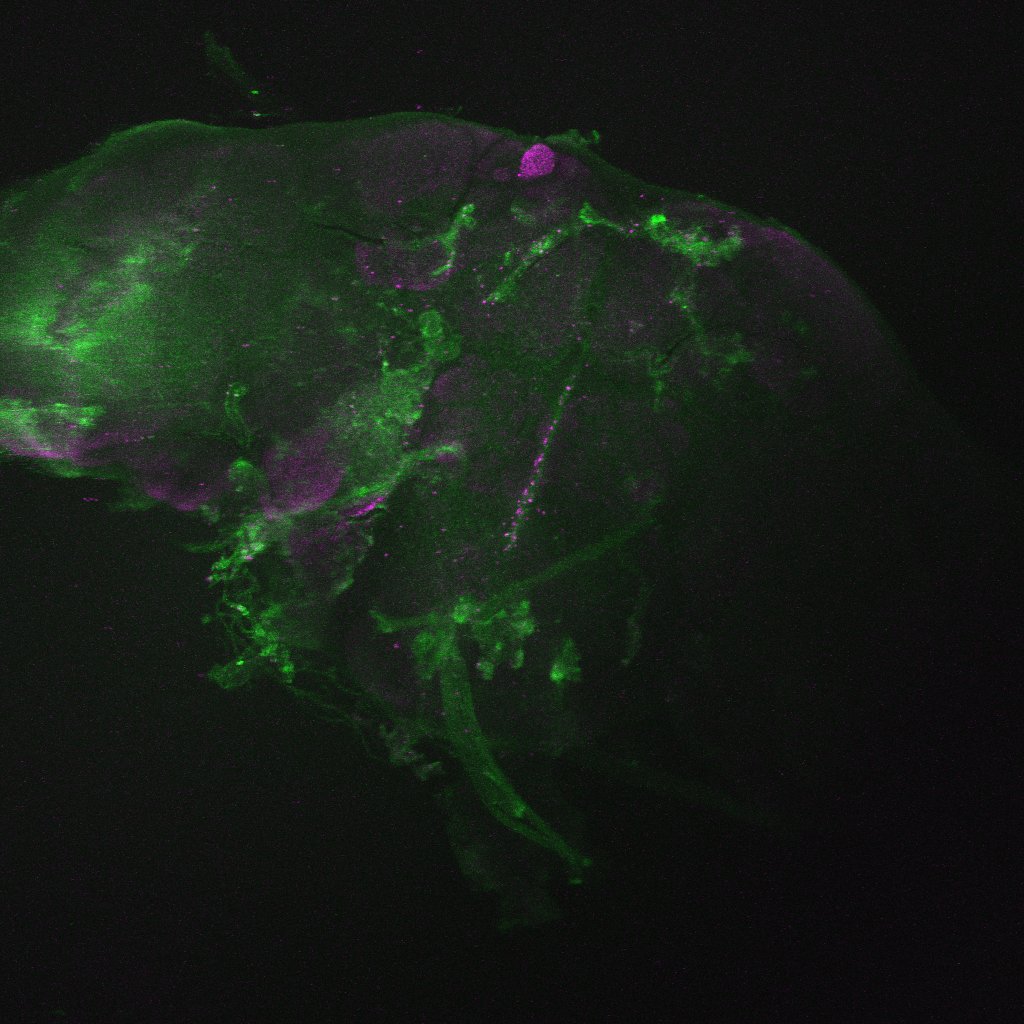
I am starting to study in more detail the genotypes that were positive in the DA screen. One was the TH-F1. Here I show the anatomy. I had several problems with the old confocal. I will try to use only the new one.
Category: Anatomy, wing clipping | No Comments
Update: Variability of Phototaxis 3
on Monday, December 7th, 2015 1:15 | by Isabelle Steymans
I started completing the experiment I started a few weeks ago (see variability of phototaxis 3), were I did once the Benzer paradigm to split the group and then I did the Benzer paradigm a second time only using the flies from a particular tube.
I tested at least 8 groups with 40 flies for each tube, except tube 0, wherefore I only have an N of 2.

Fig. 1 Cumulative proportions in all tubes
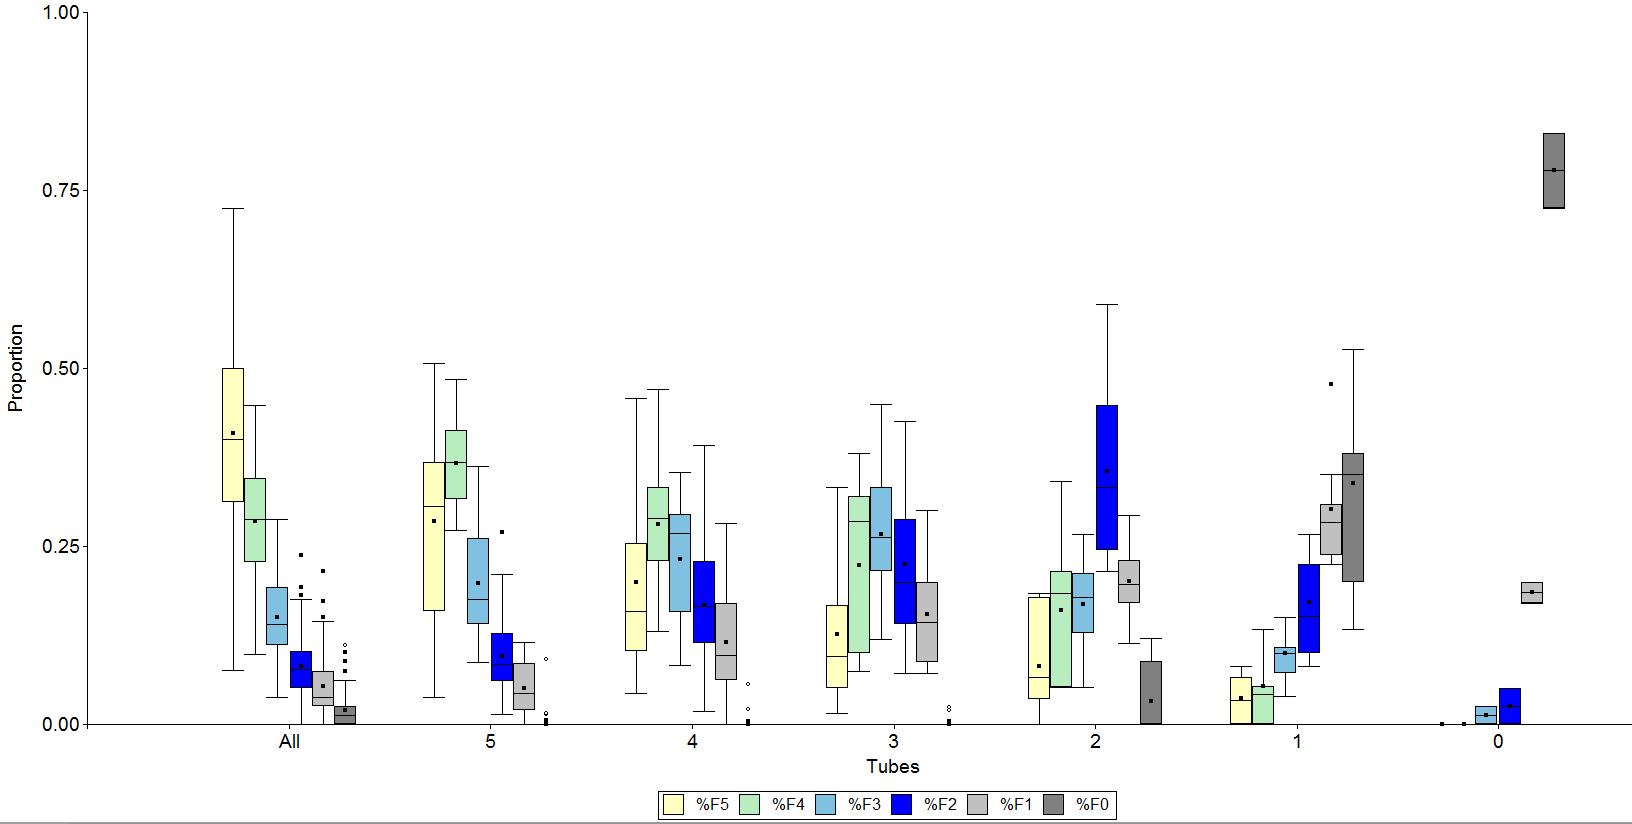
Fig. 2 Proportions in all tubes
Update: Phototactic Flexibility (OA Neurons) & “Stainings”
on Monday, December 7th, 2015 12:47 | by Bianca Birk
In Fig 1 you see the results of the tbh – subgroups screen.
Furthermore I plotted them in a dot plot. (Fig. 2 and Fig. 3)
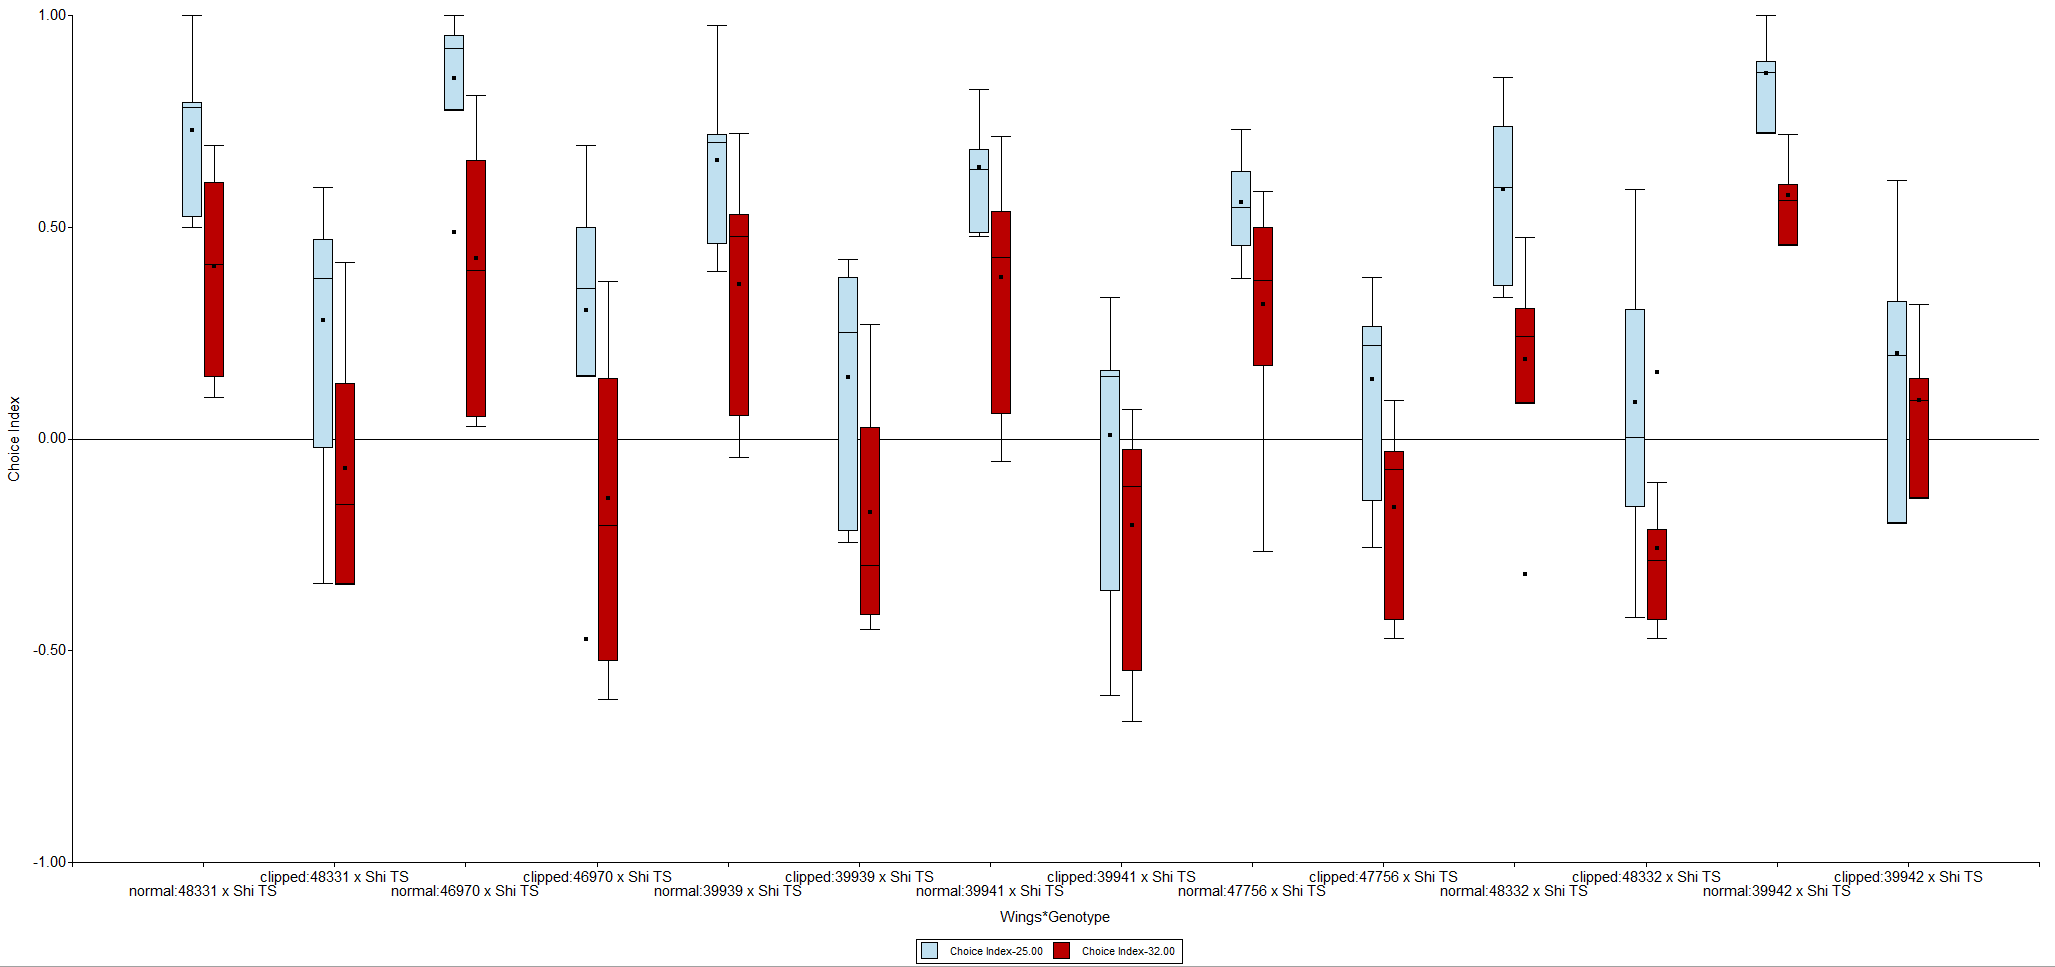
Fig.1 tbh subgroups screen
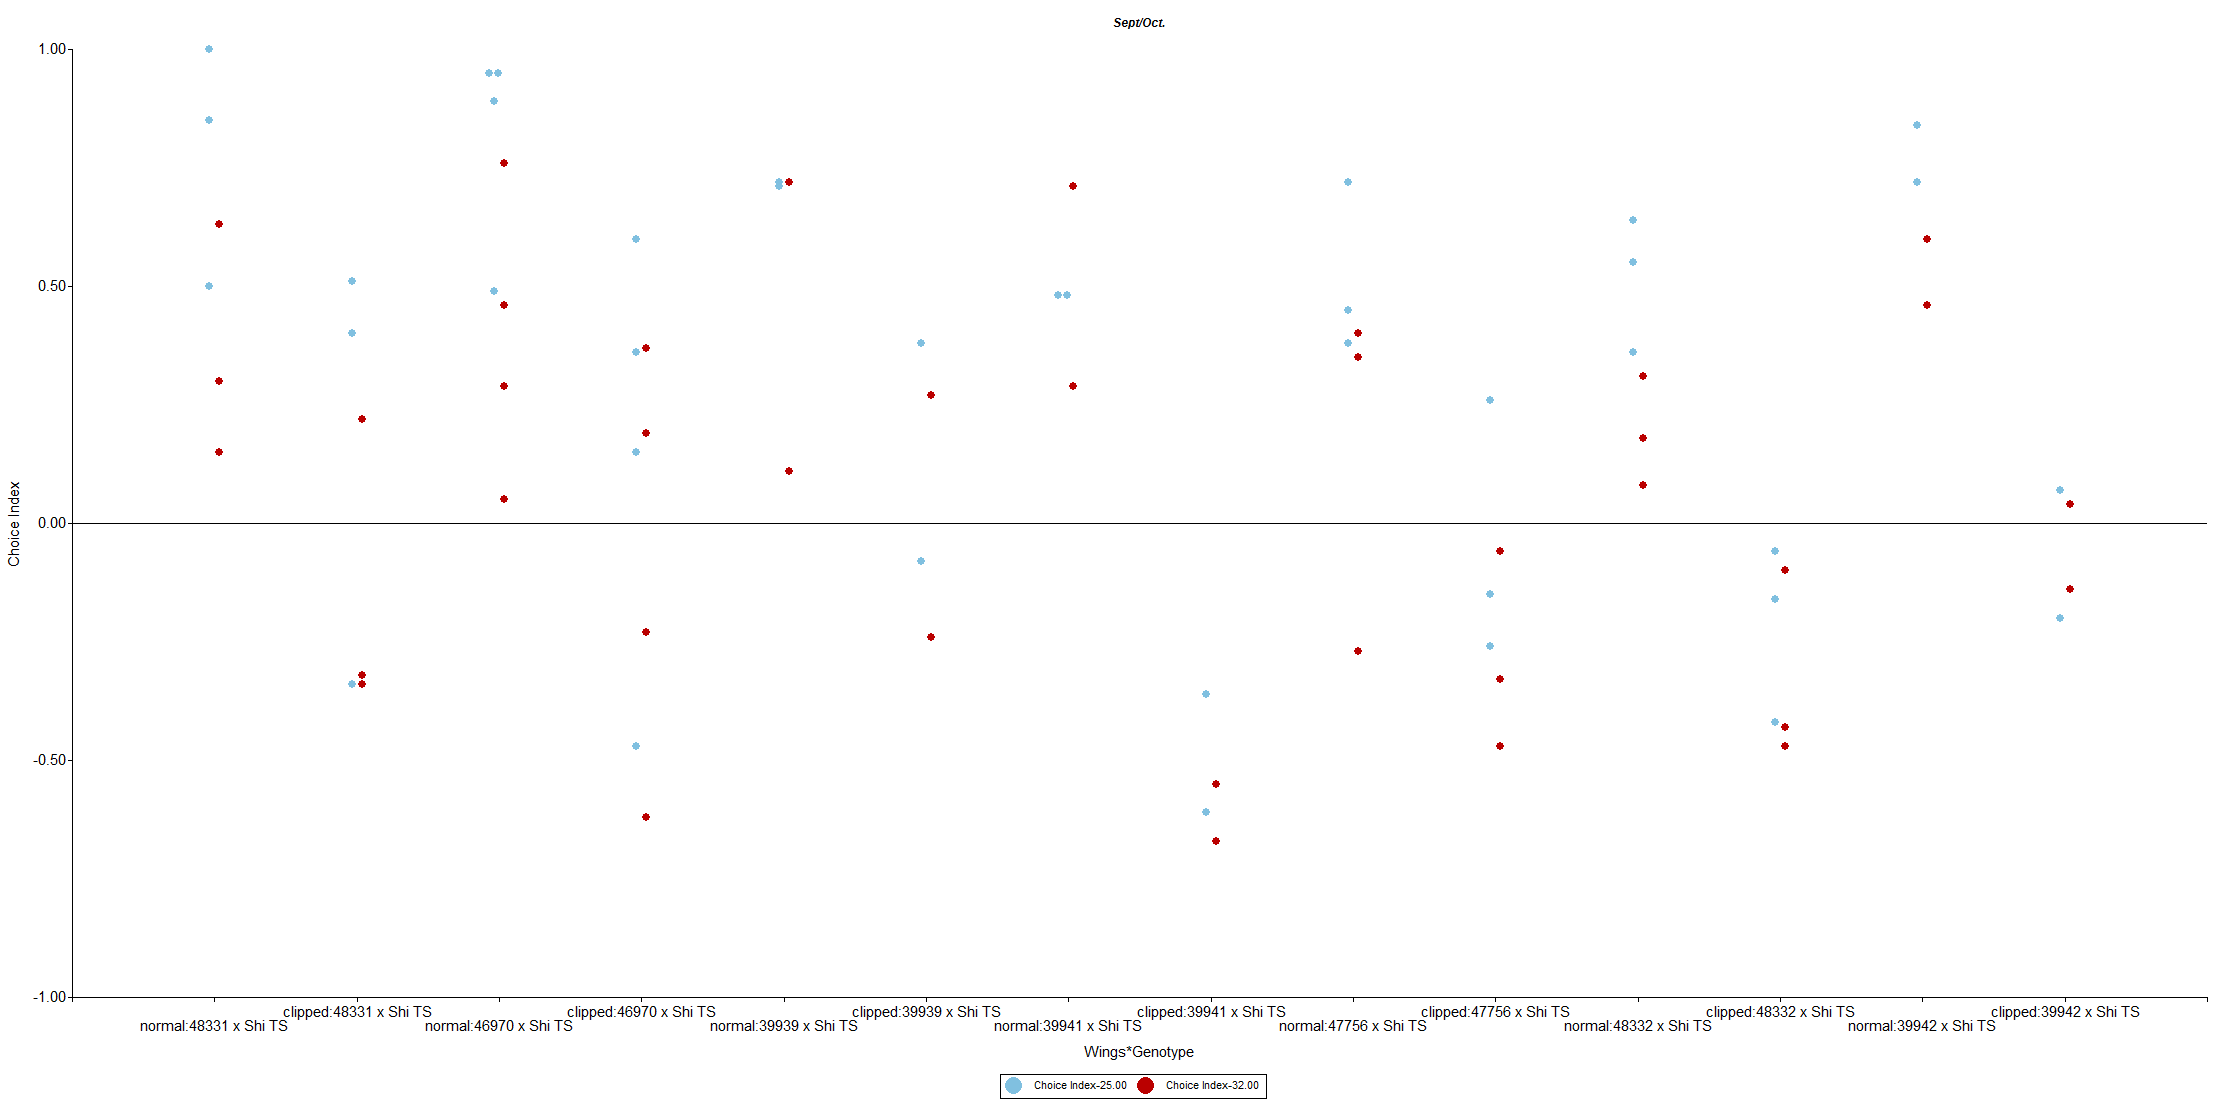
Fig 2. tbh subgroups tested in September and October

Fig. 3 tbh subgroups tested in November and December
Moreover I dissected some brains which I crossed to GFP (nucl.)
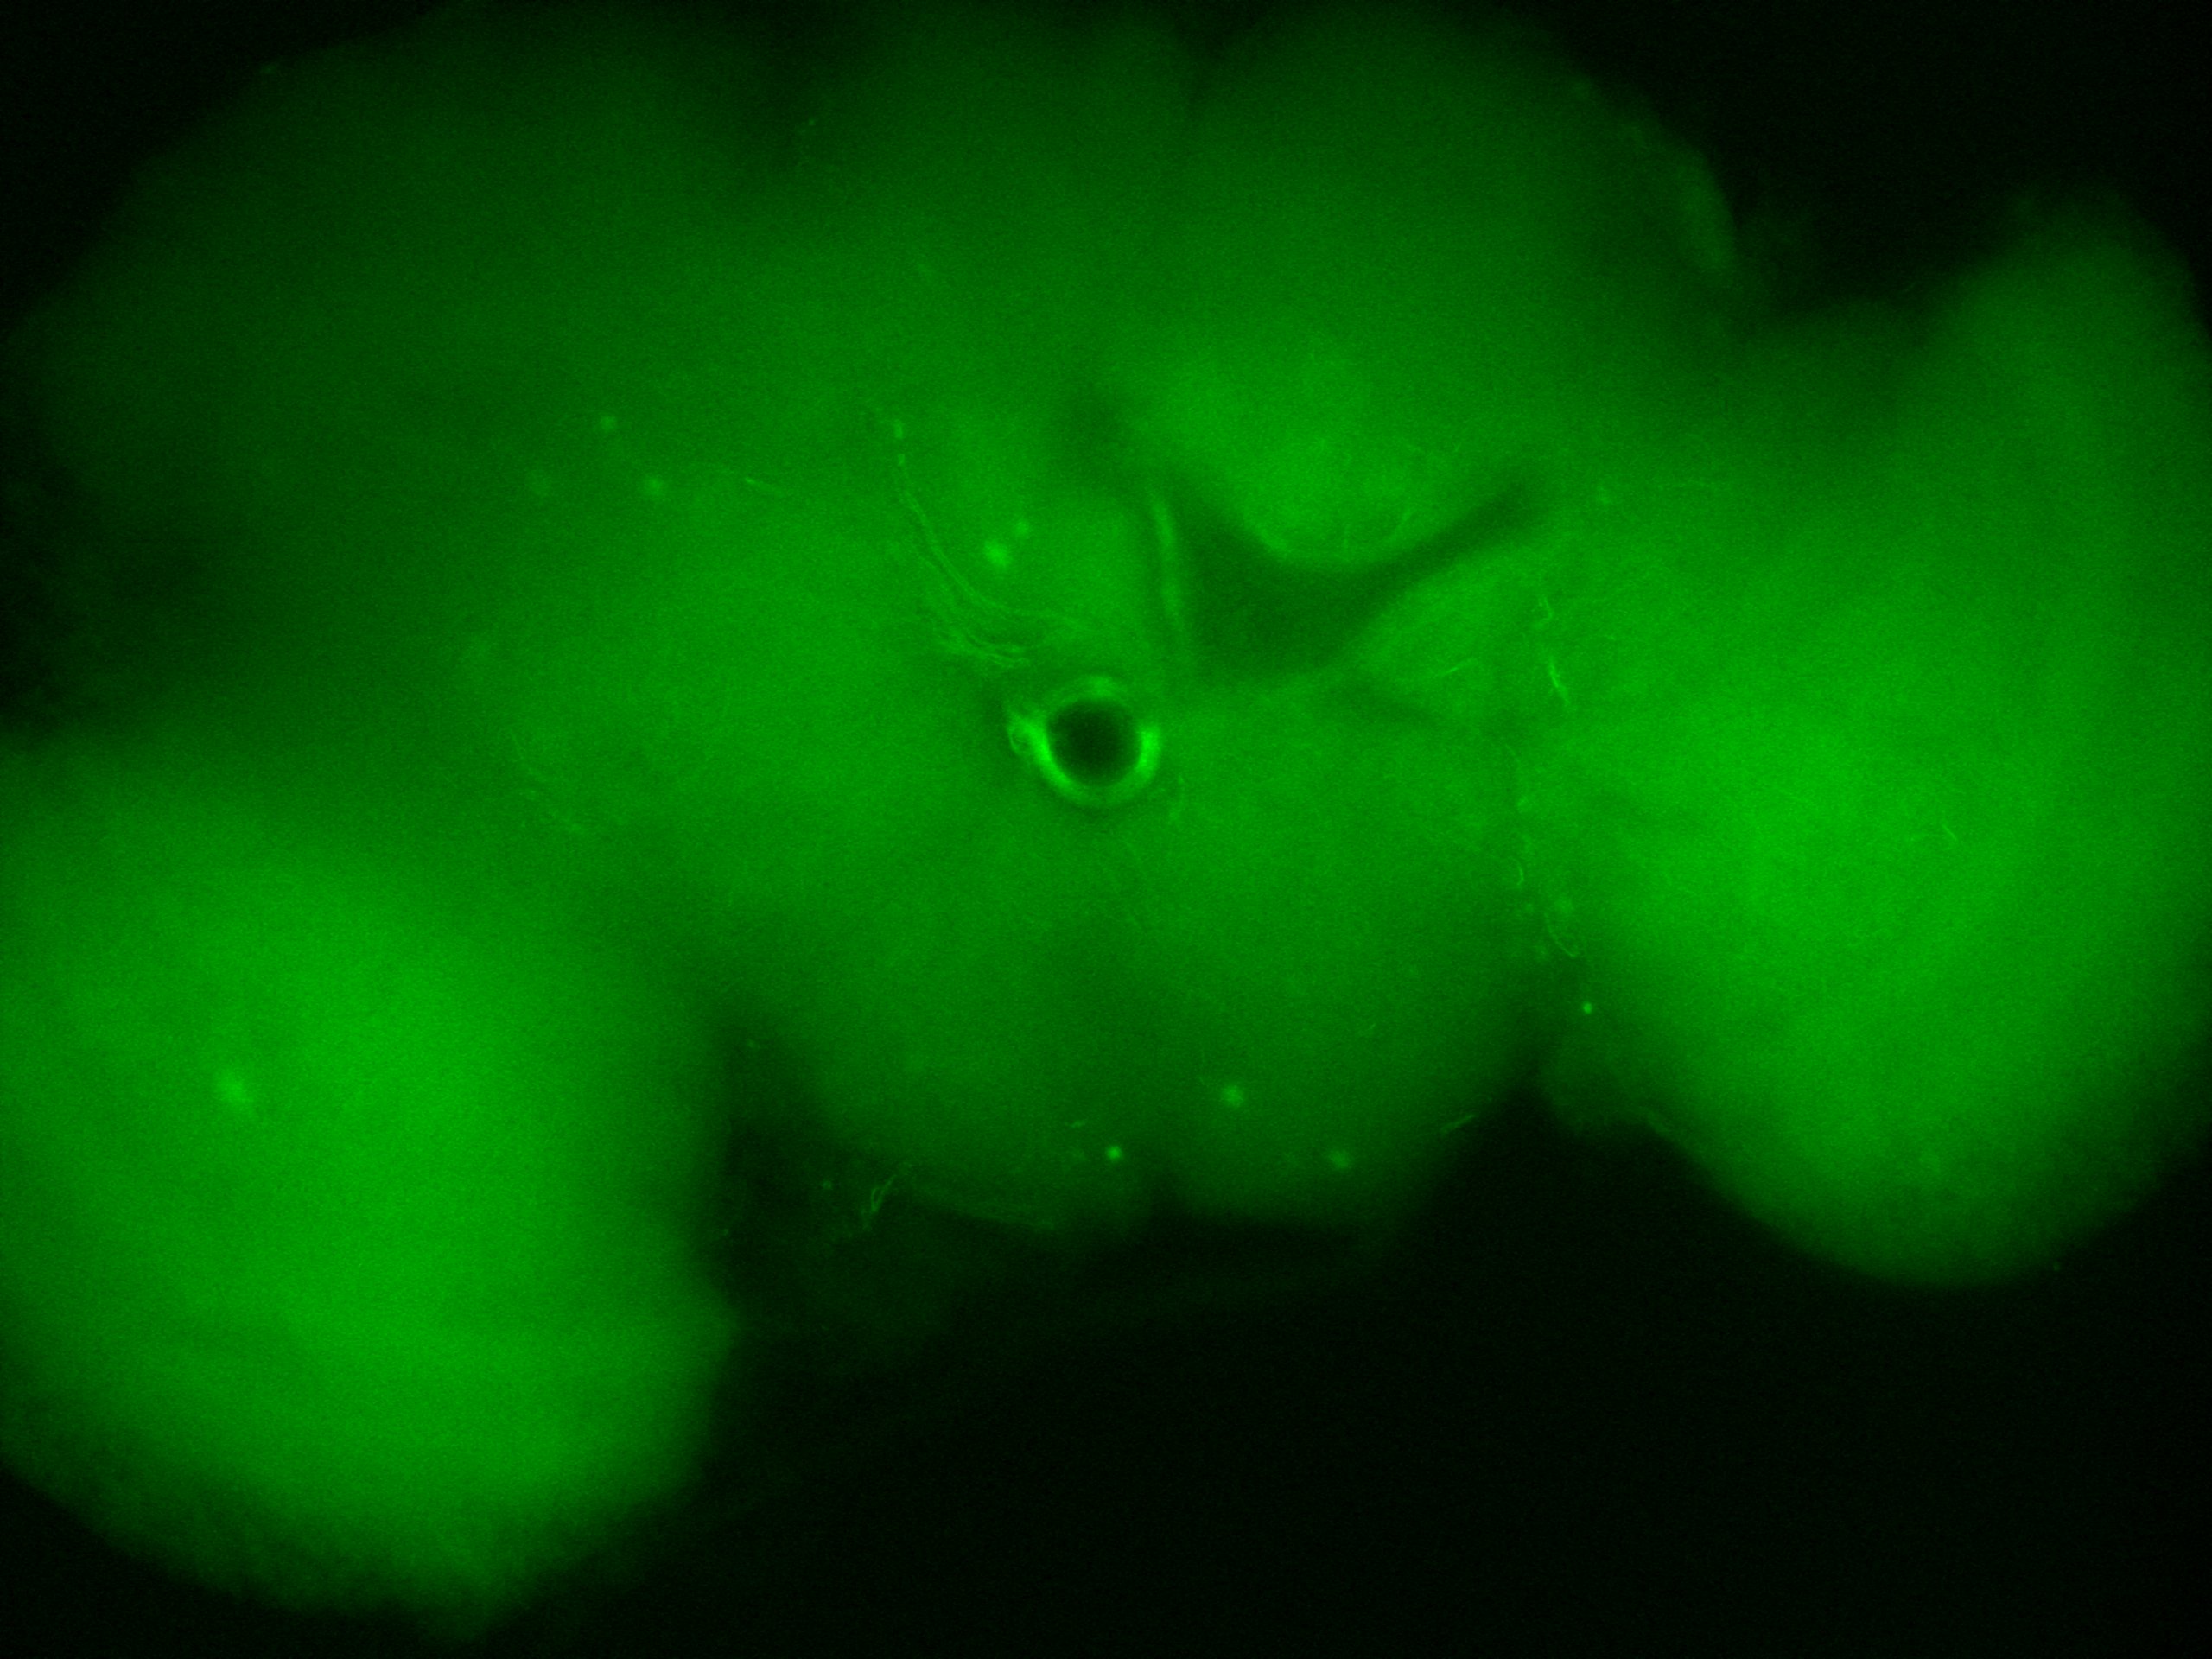
Fig4. tbh-48331 x GFP (nucl)
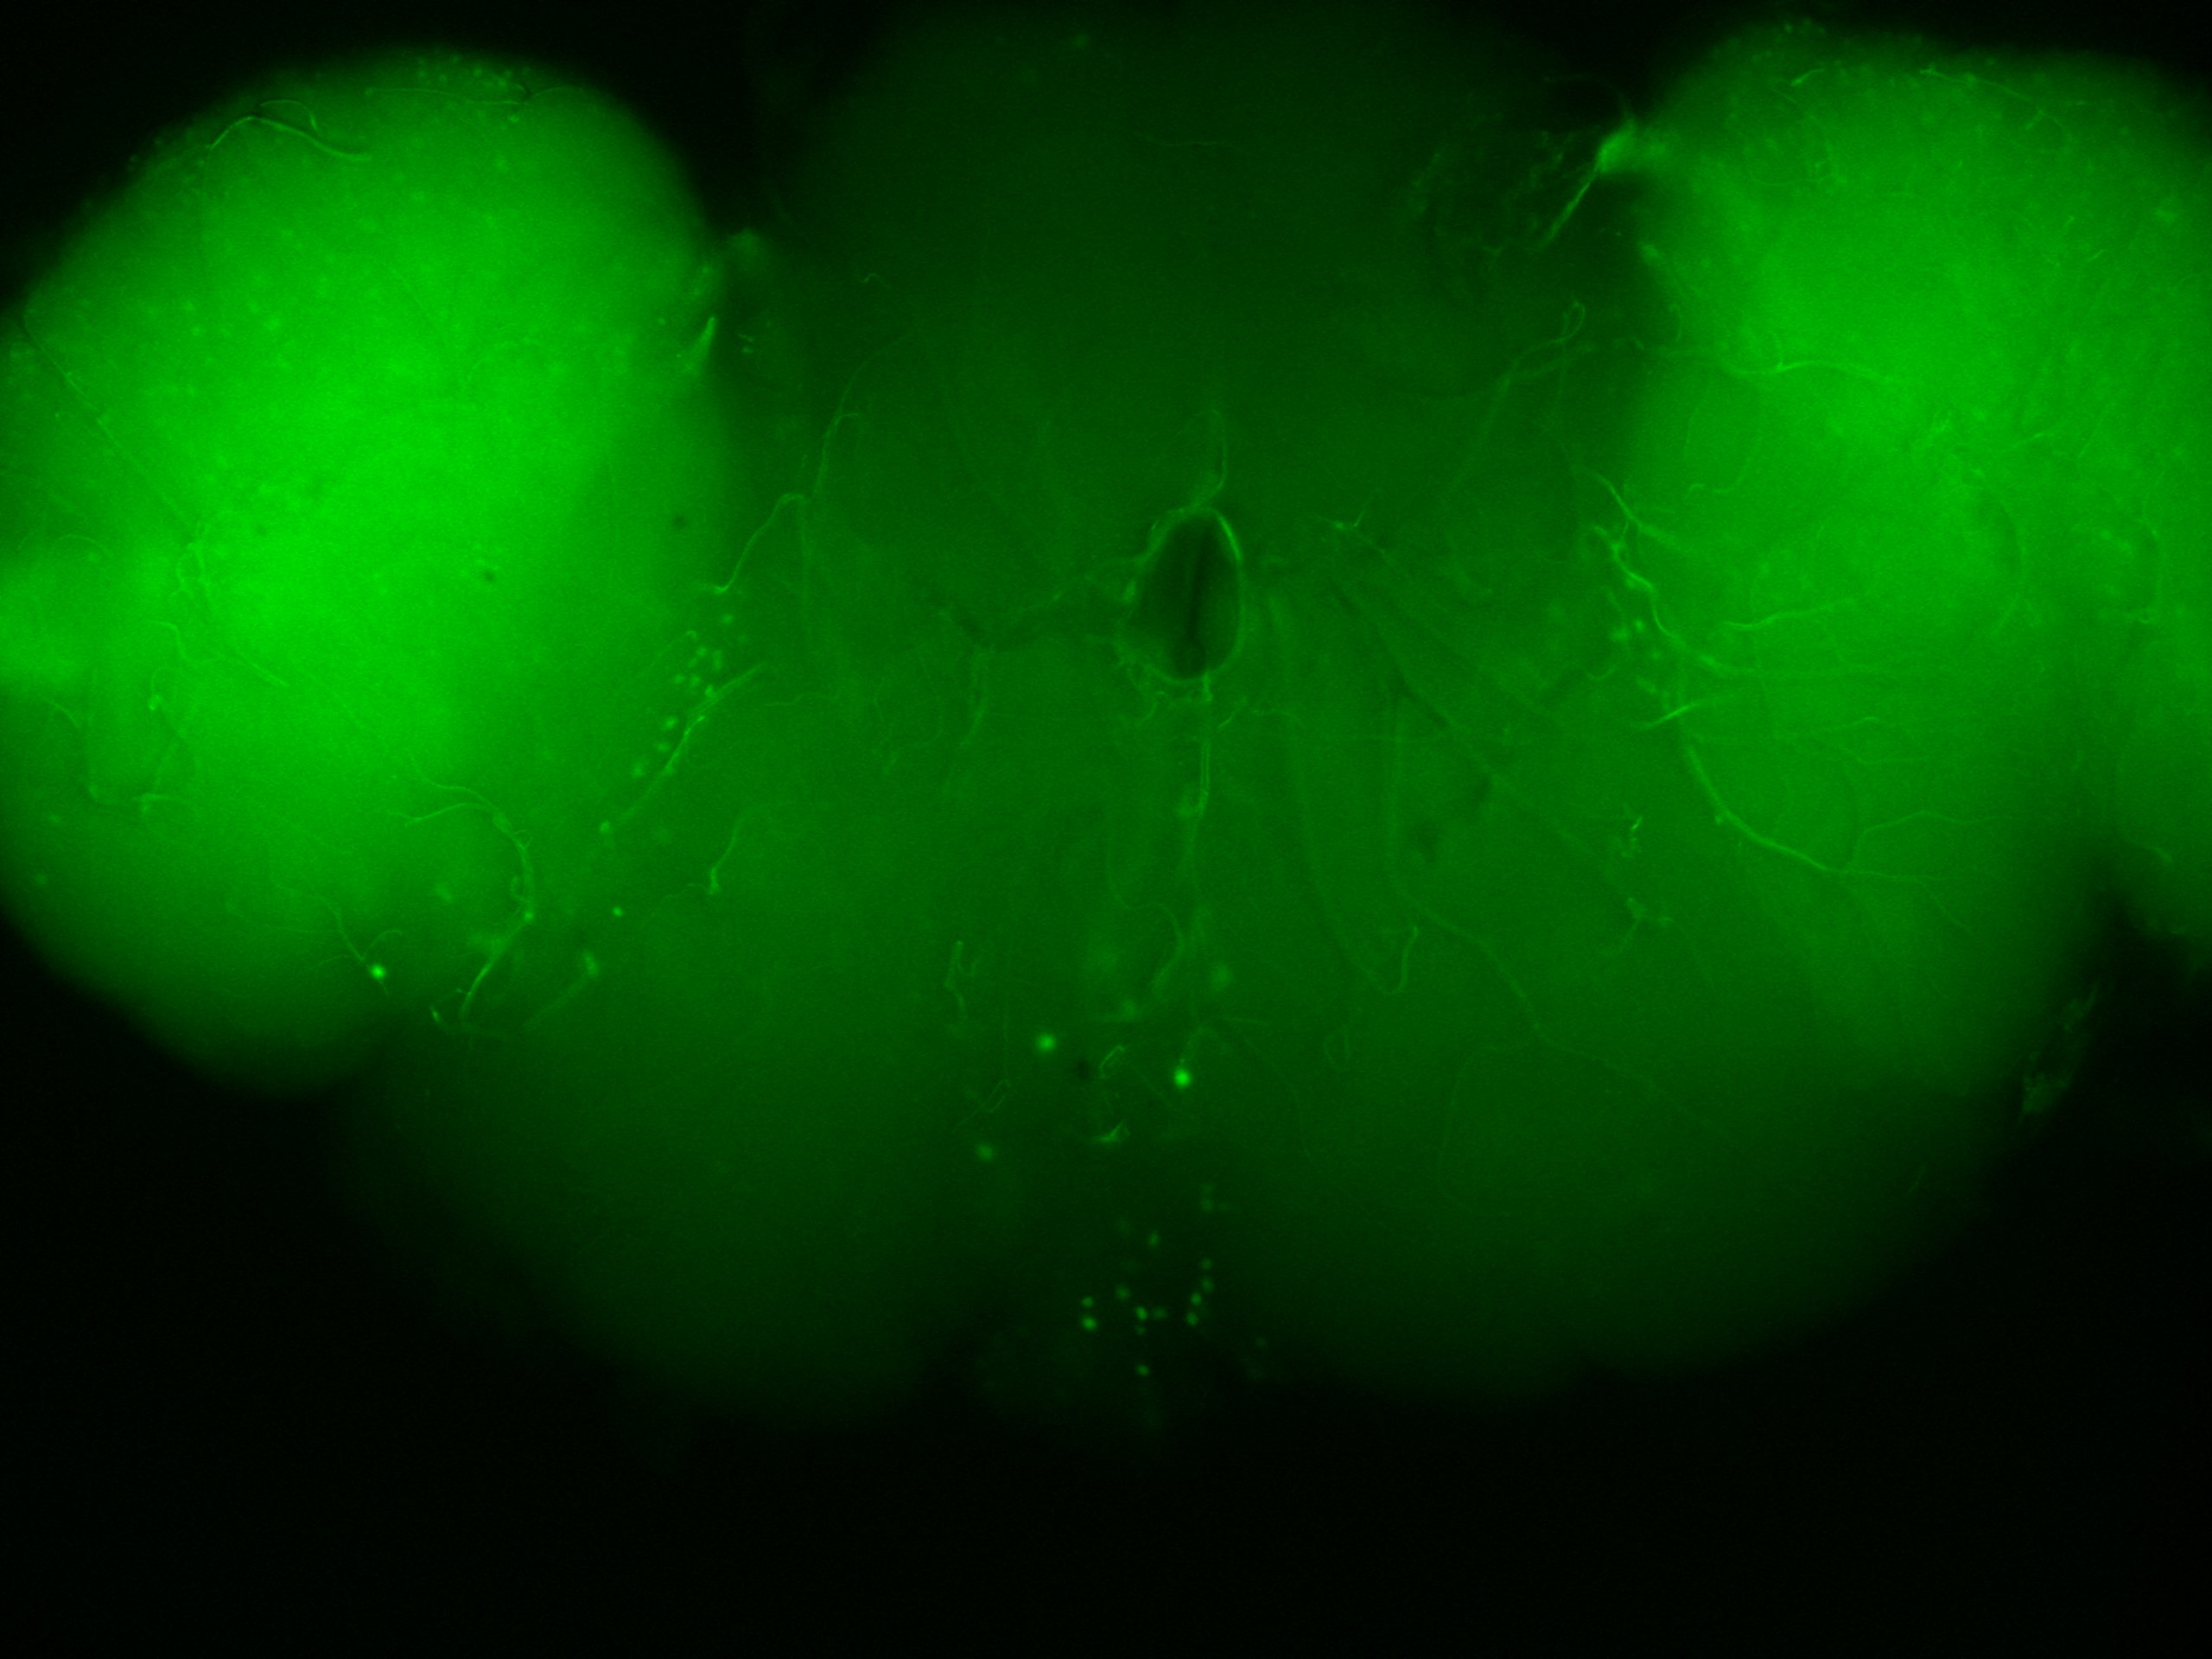
Fig 5. tbh-39941 x GFP (nucl)
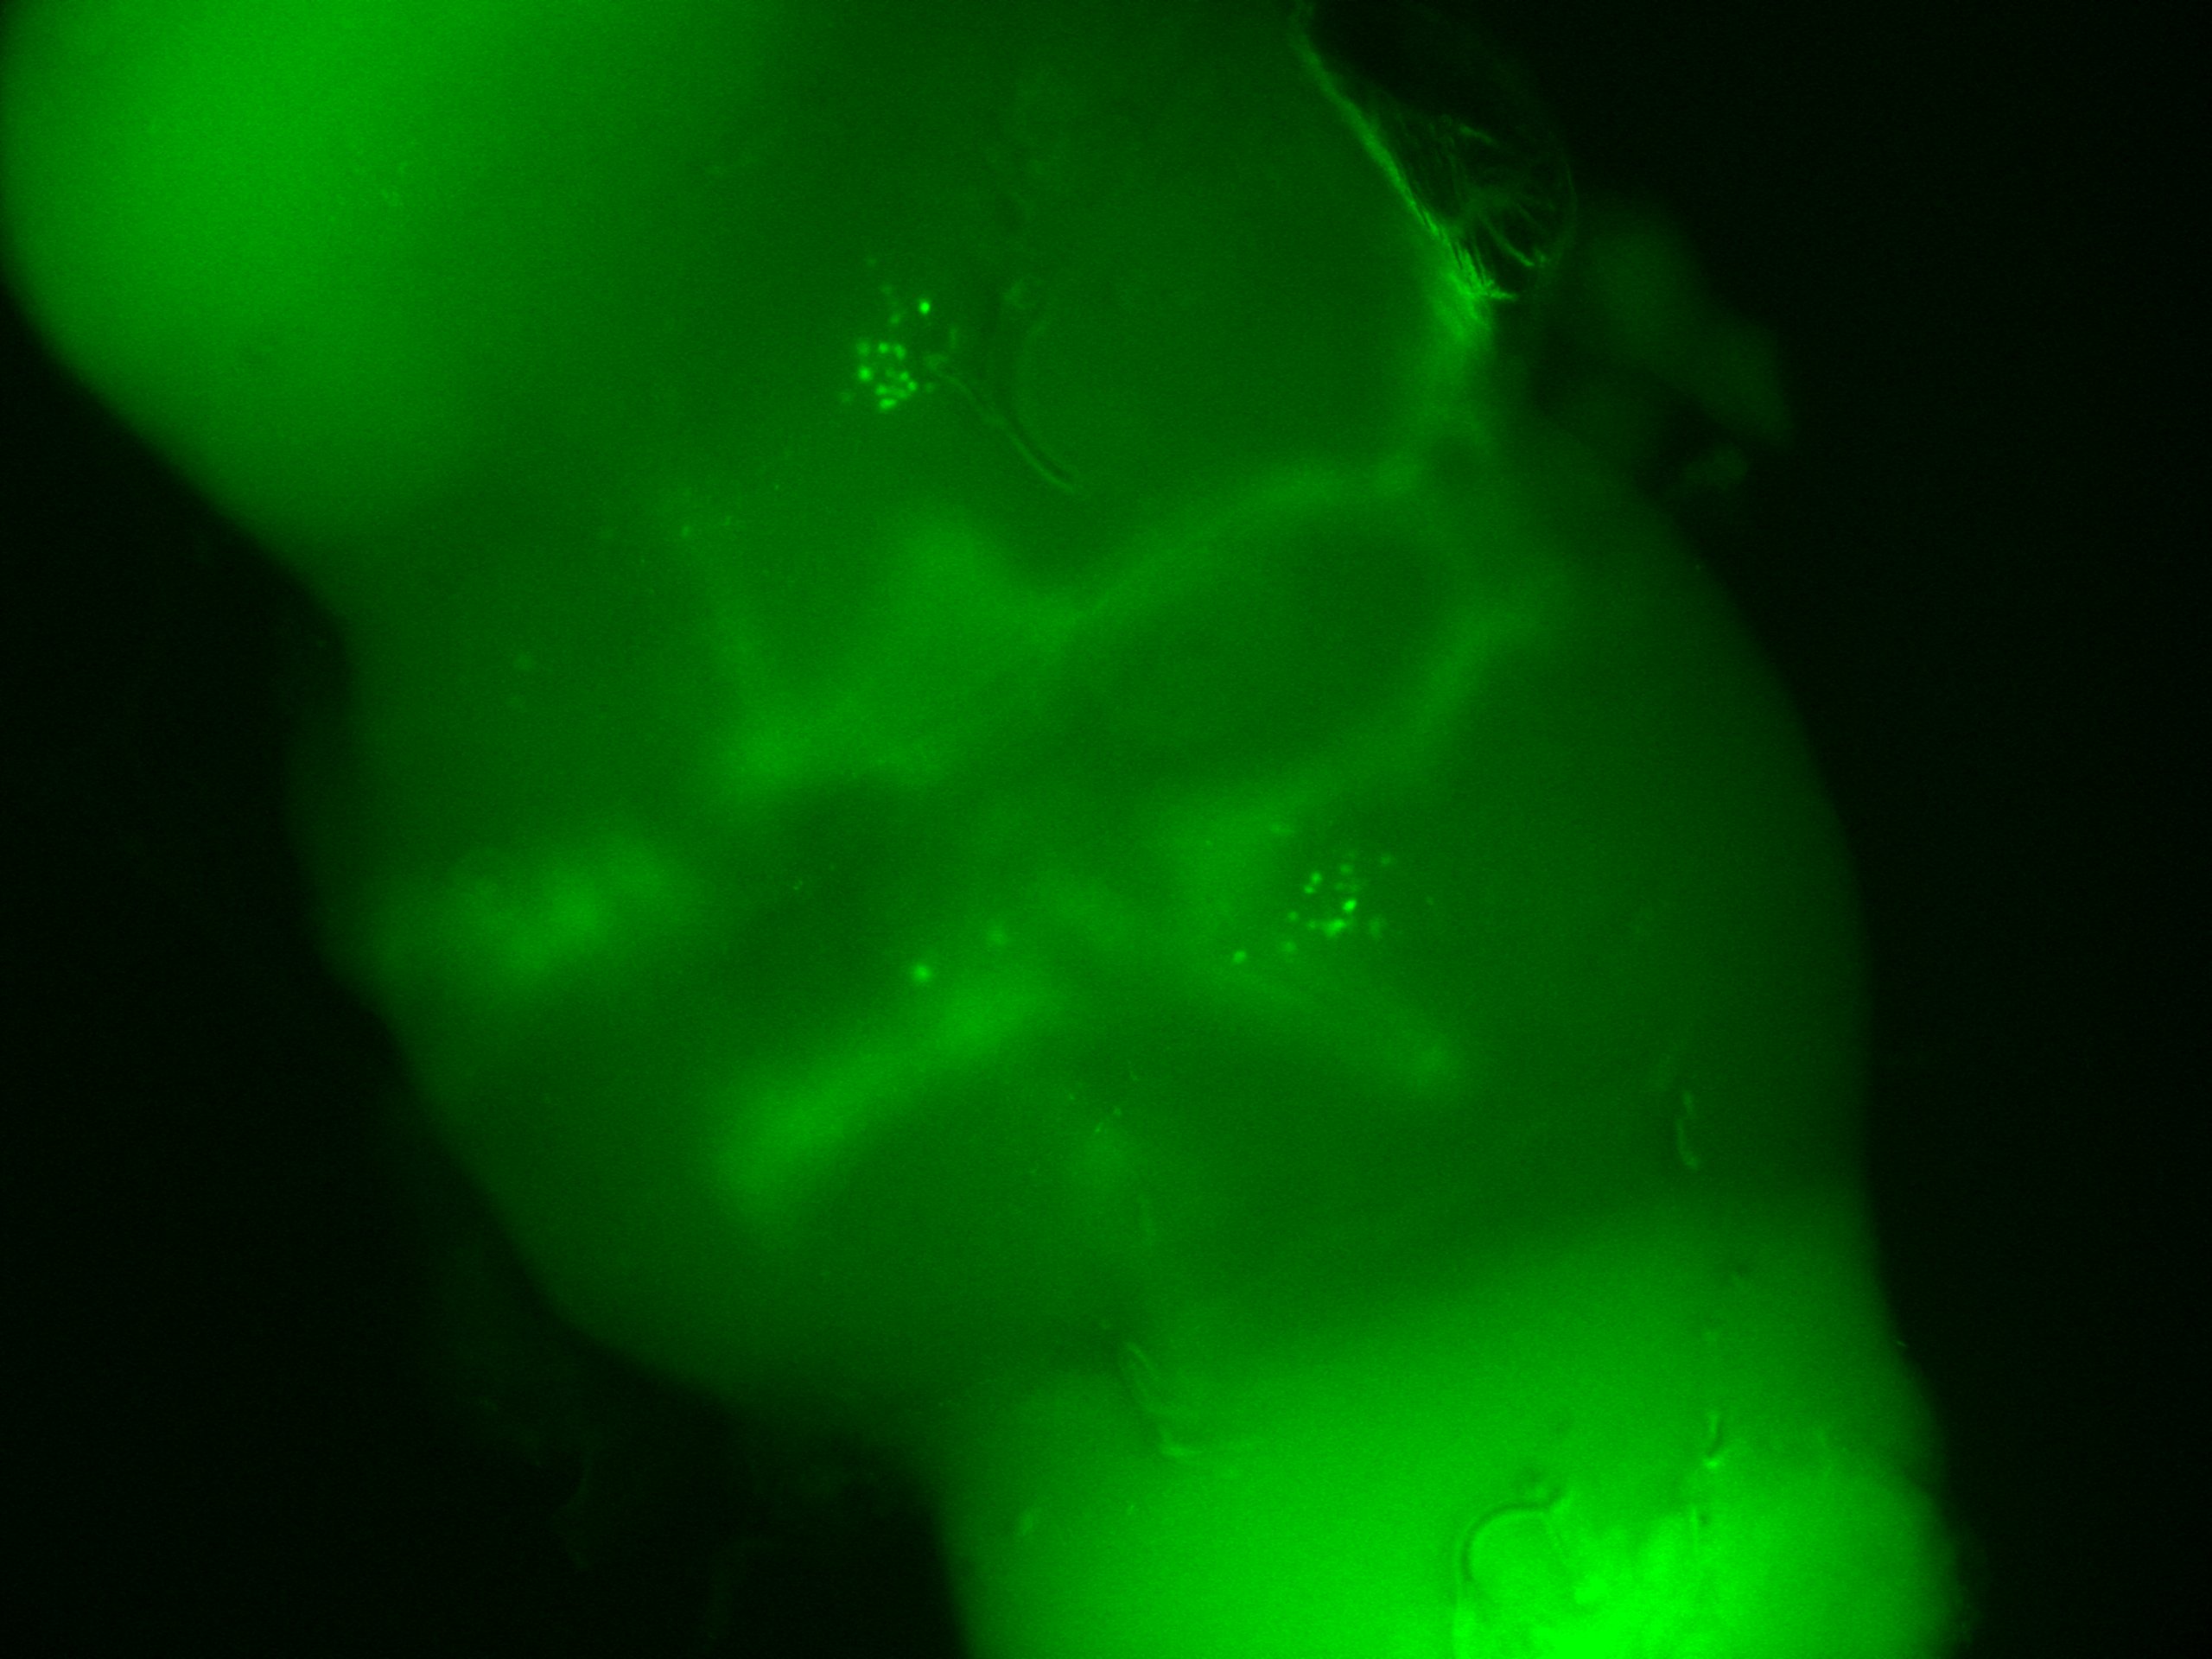
Fig 6. tbh-39939 x GFP (nucl)
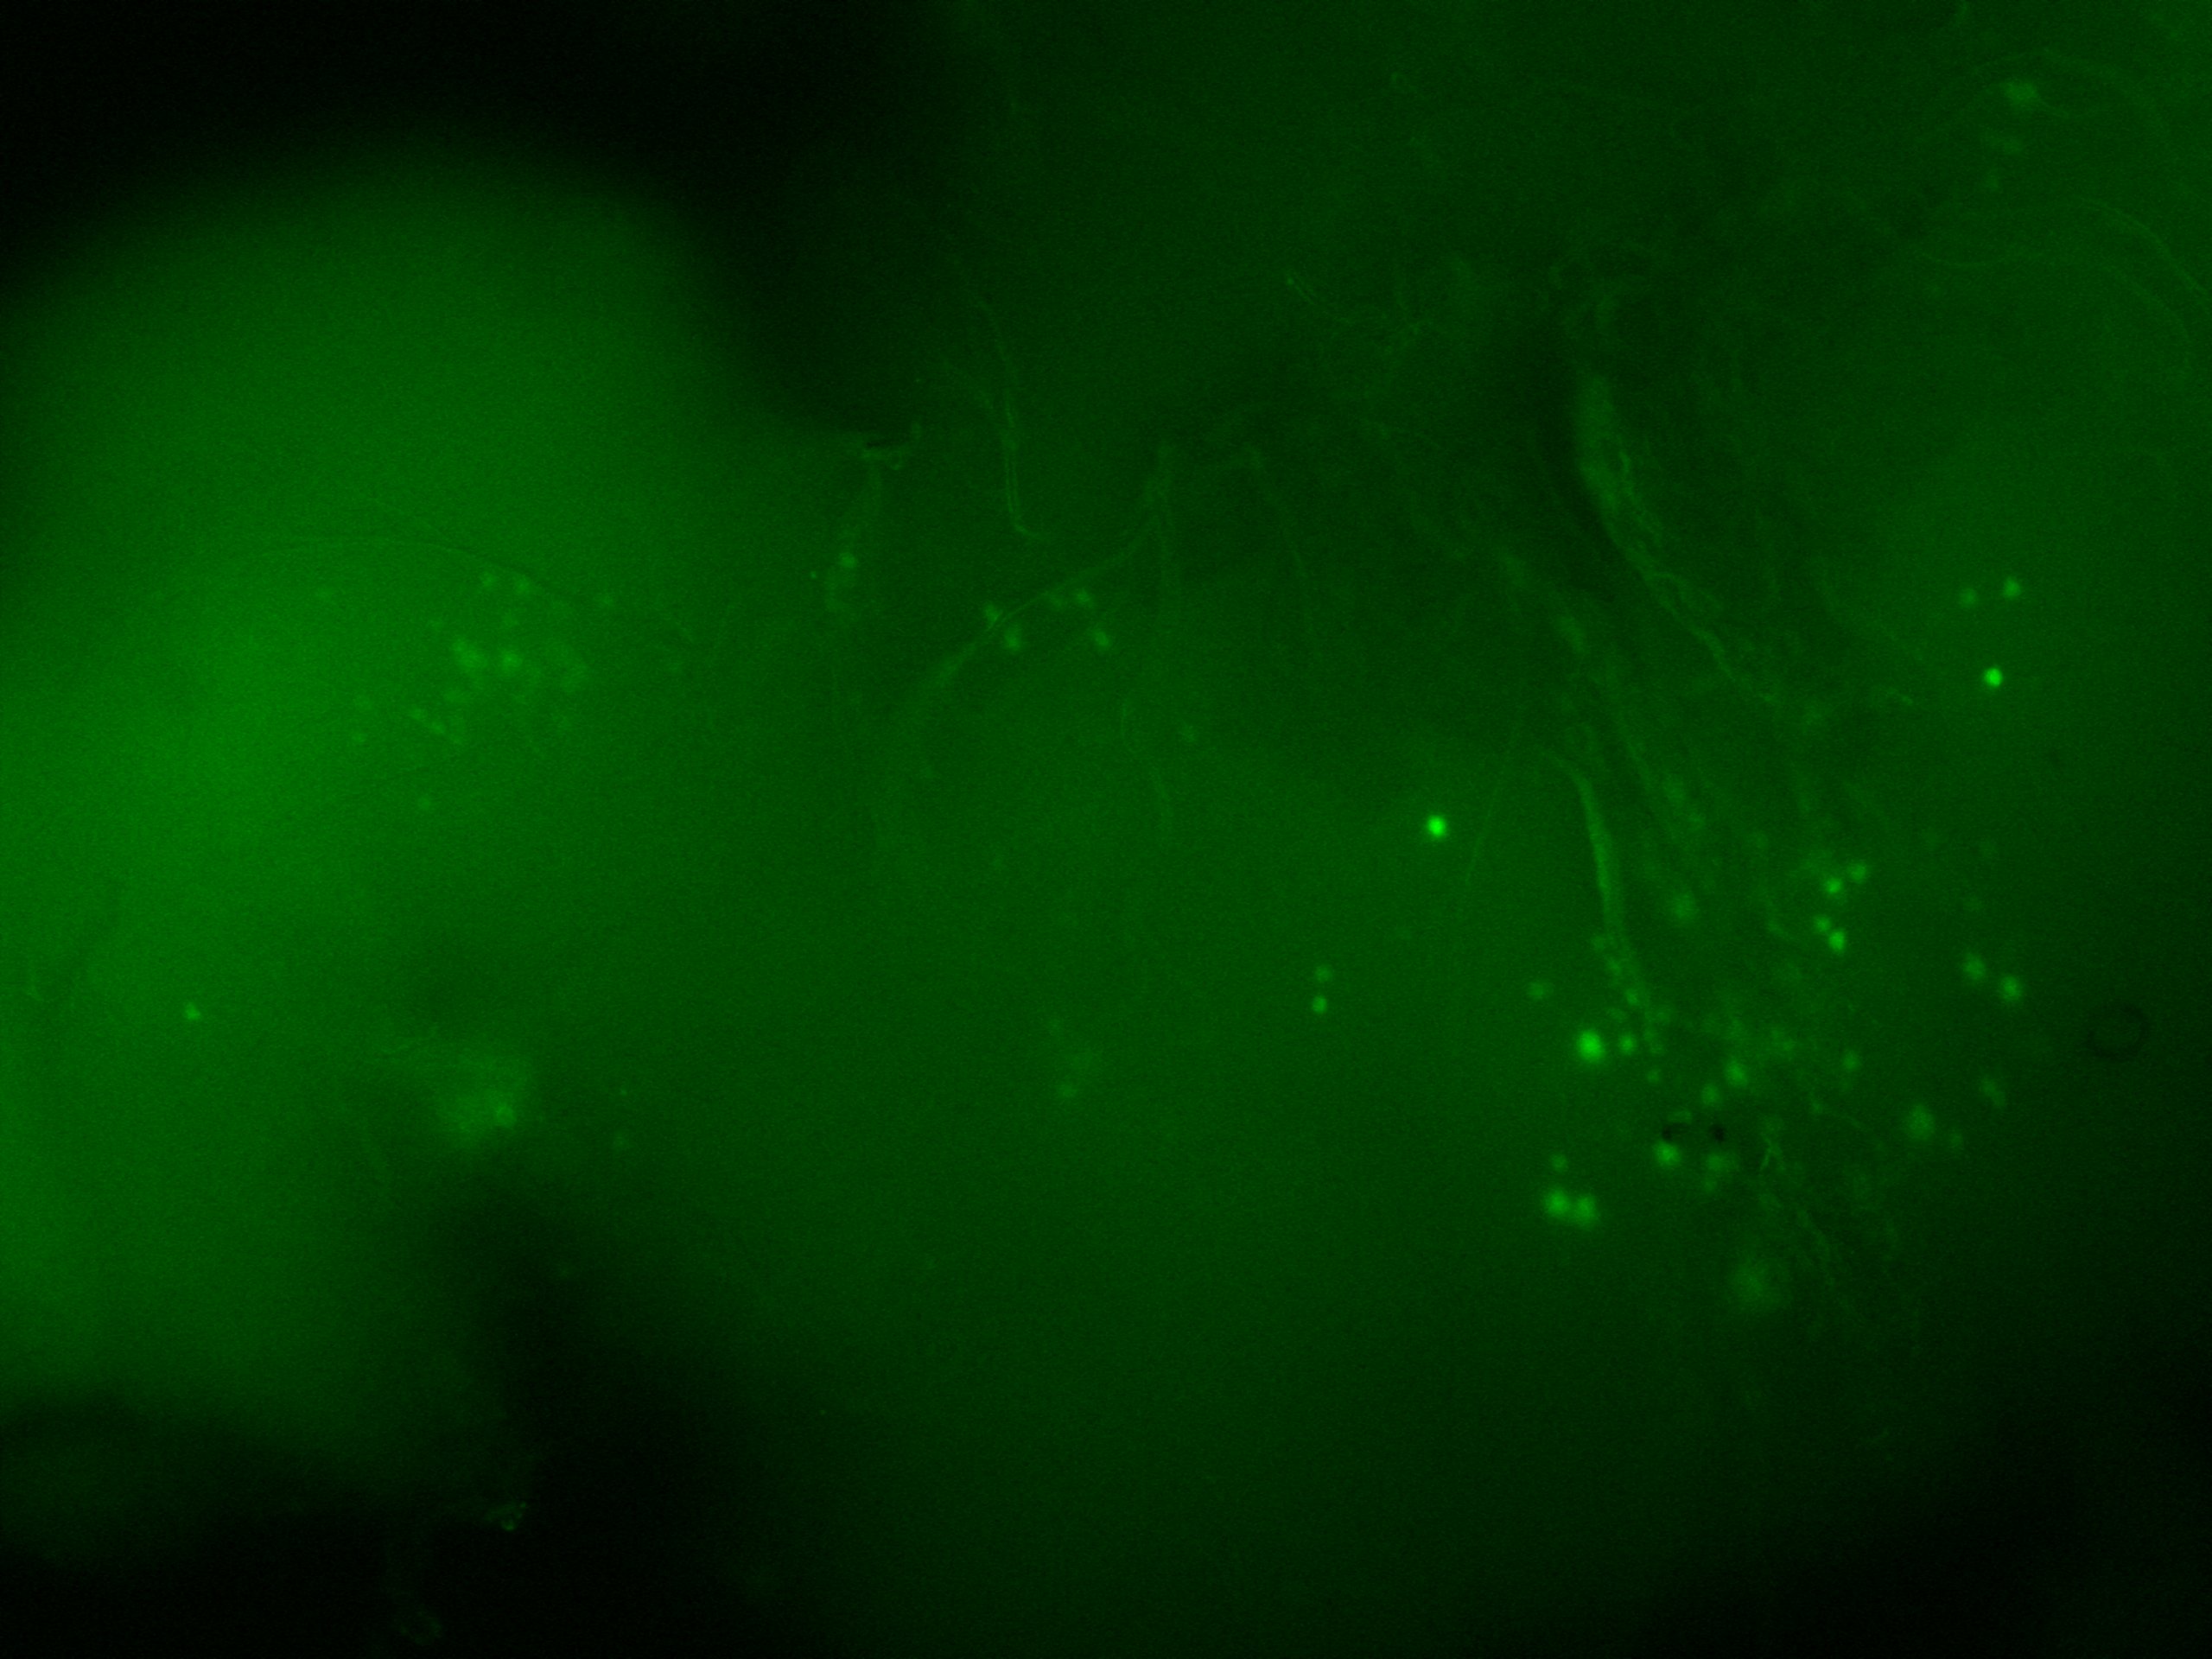
Fig. 7 tbh-39942 x GFP (nucl)
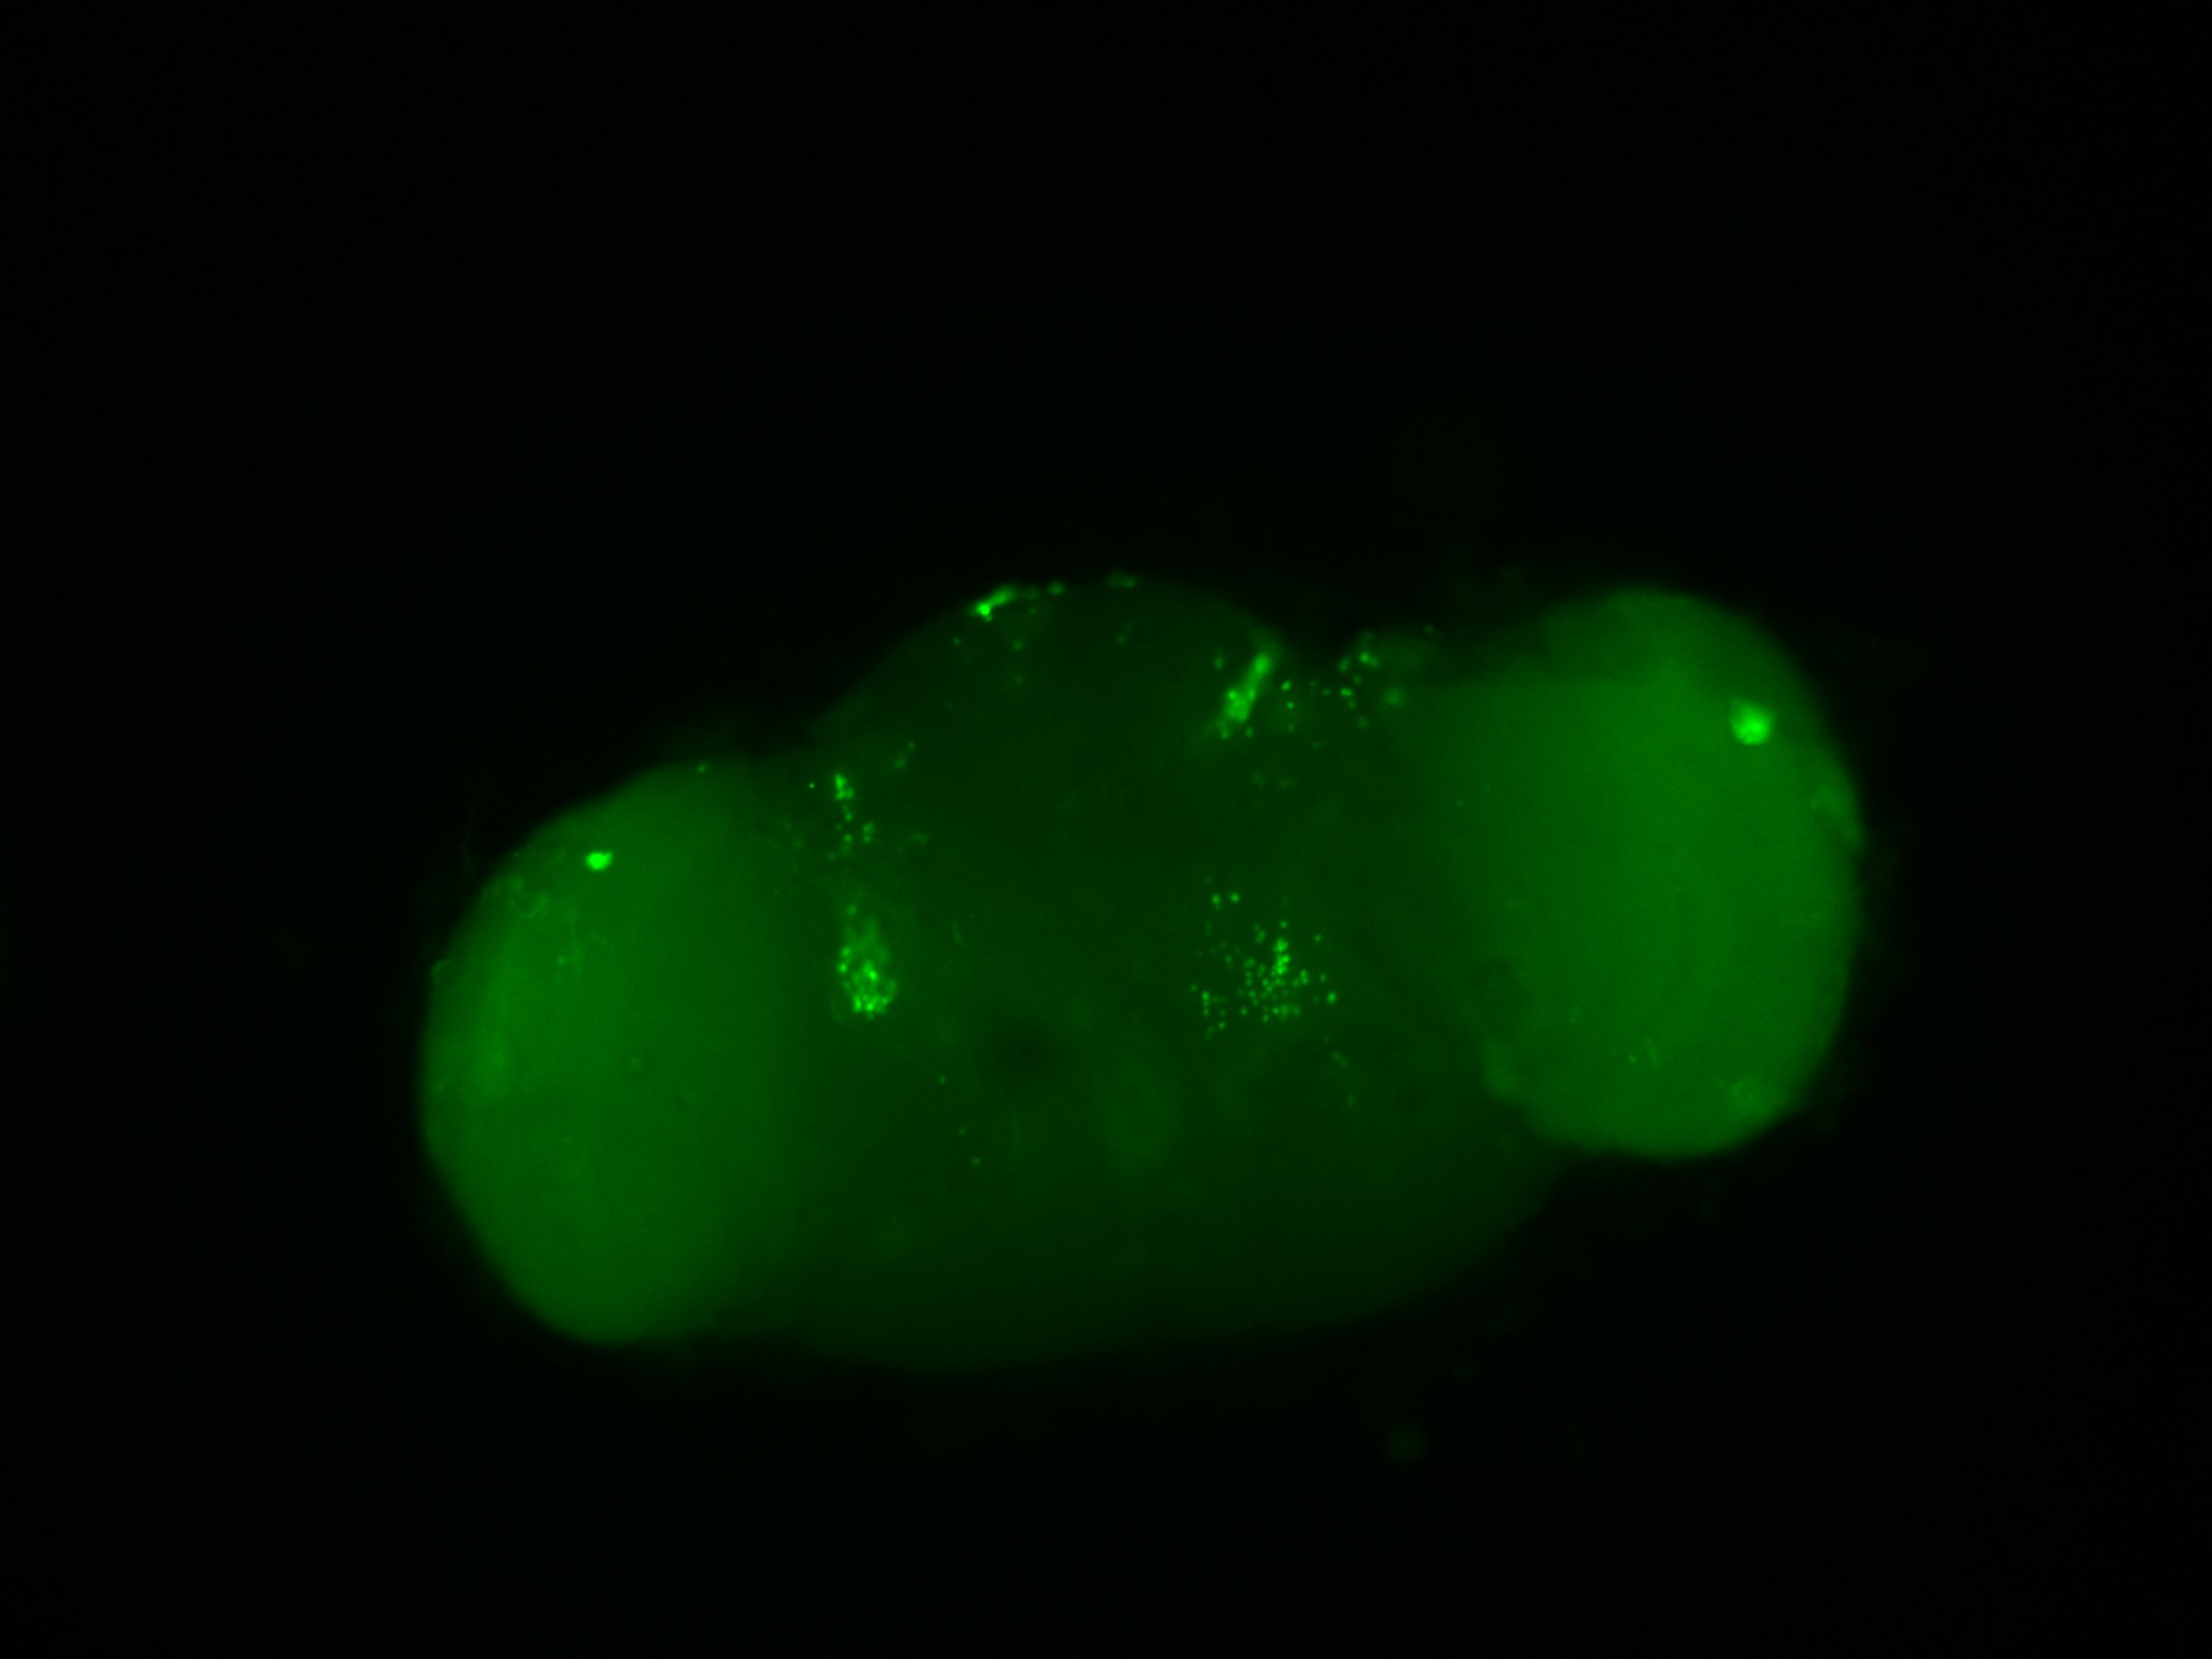
Fig 8. 47756 x GFP (nucl)
Category: wing clipping | No Comments
Update: Temperature Impact on Phototactic Behavior
on Thursday, December 3rd, 2015 11:01 | by Amelie Roedel
I plotted every genotype seperately as a dot plot (Figure 1 – 5).
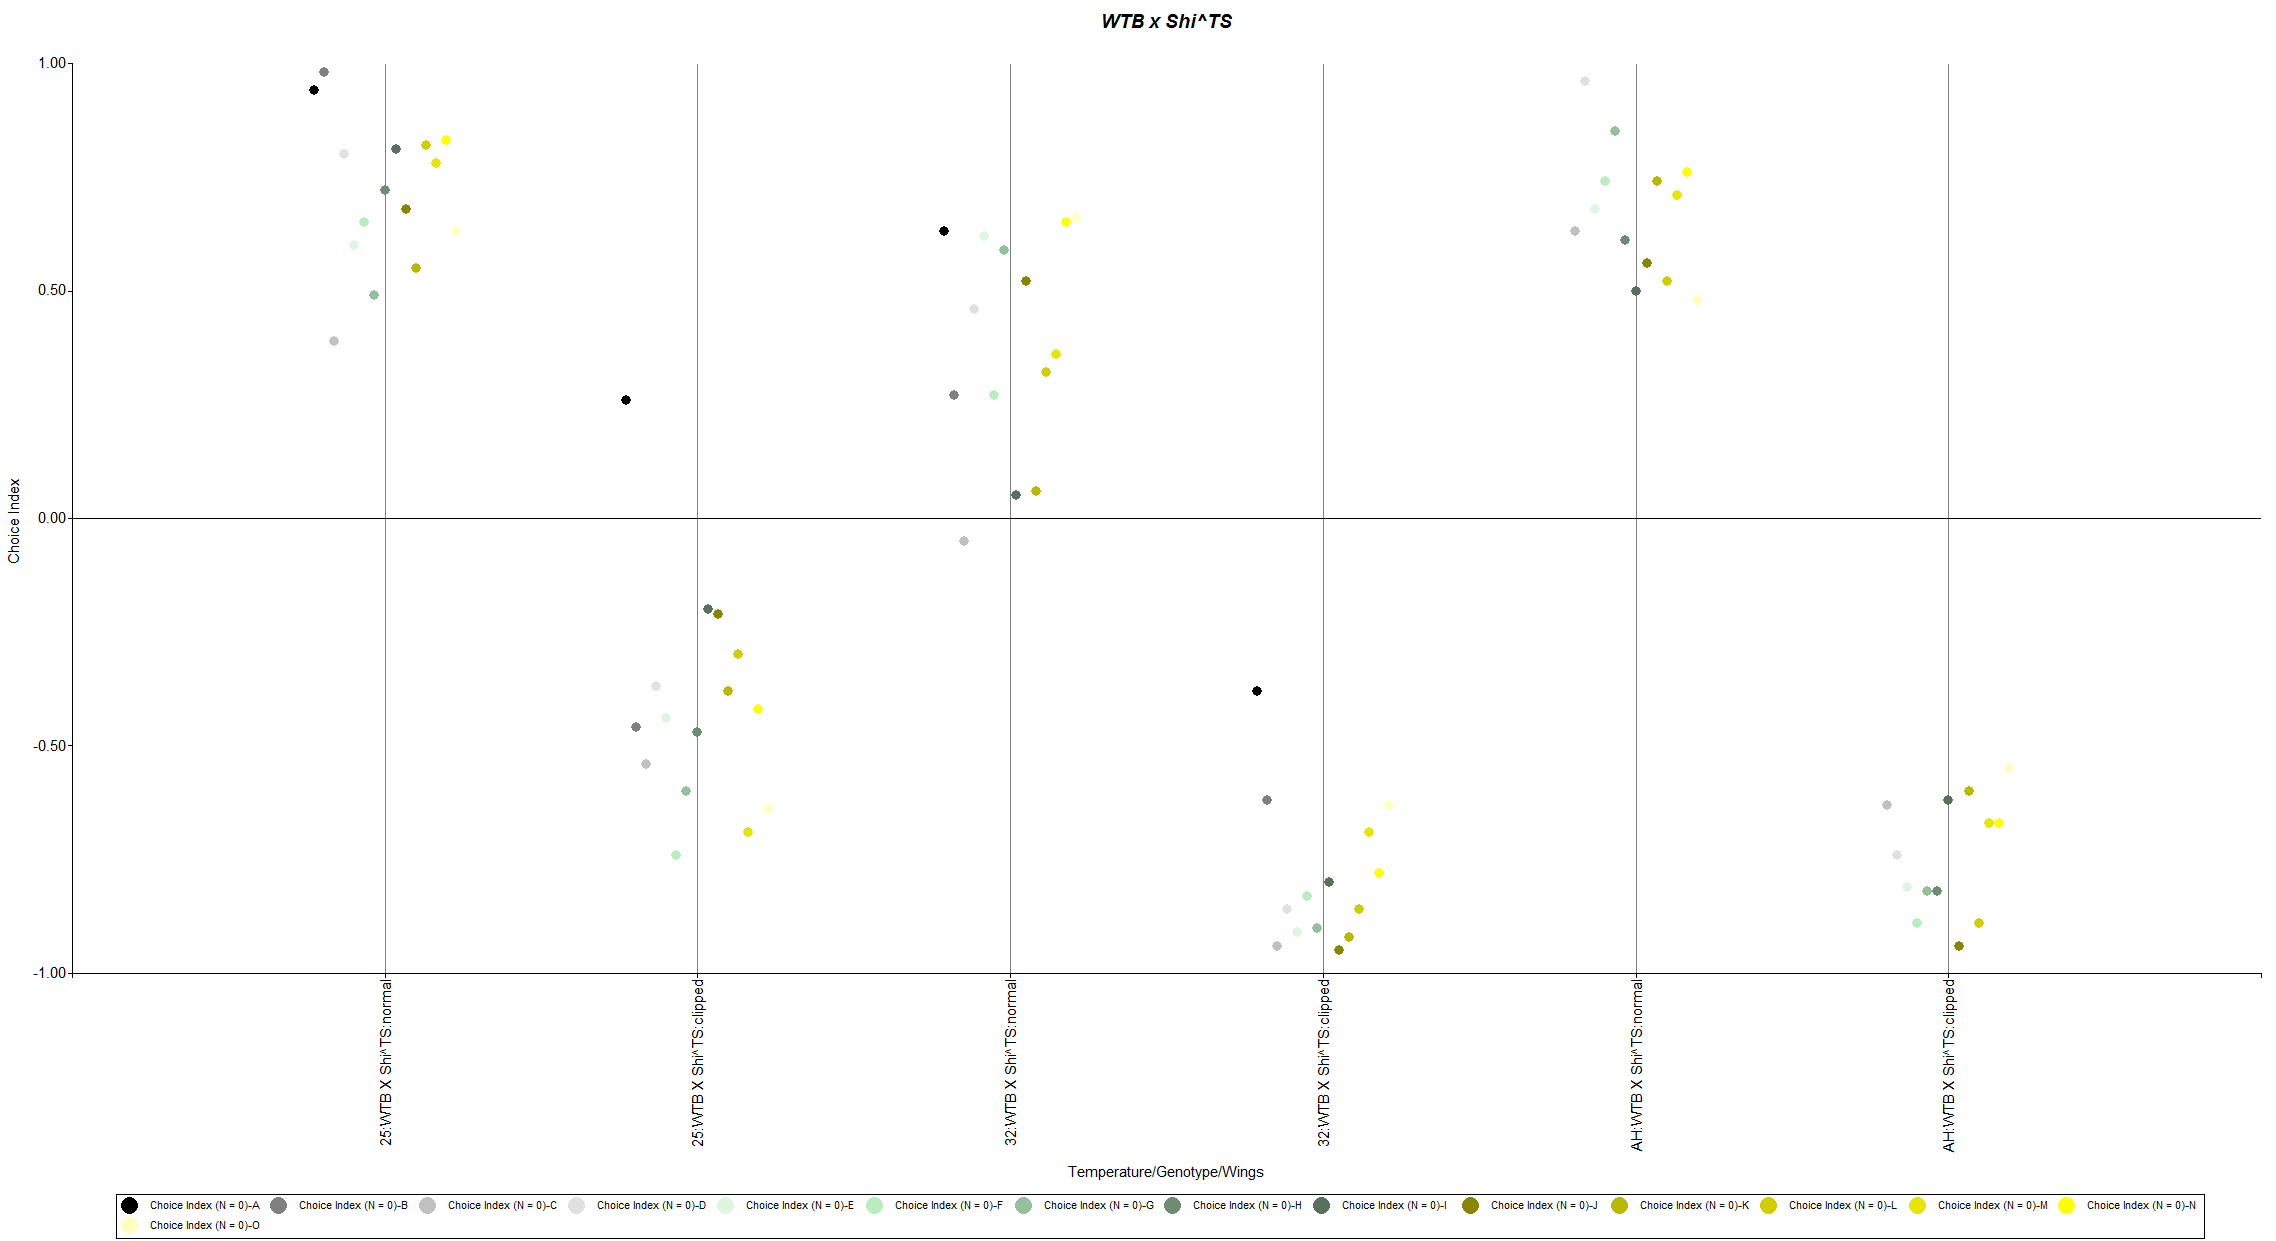
Figure 1: WTB x ShiTS
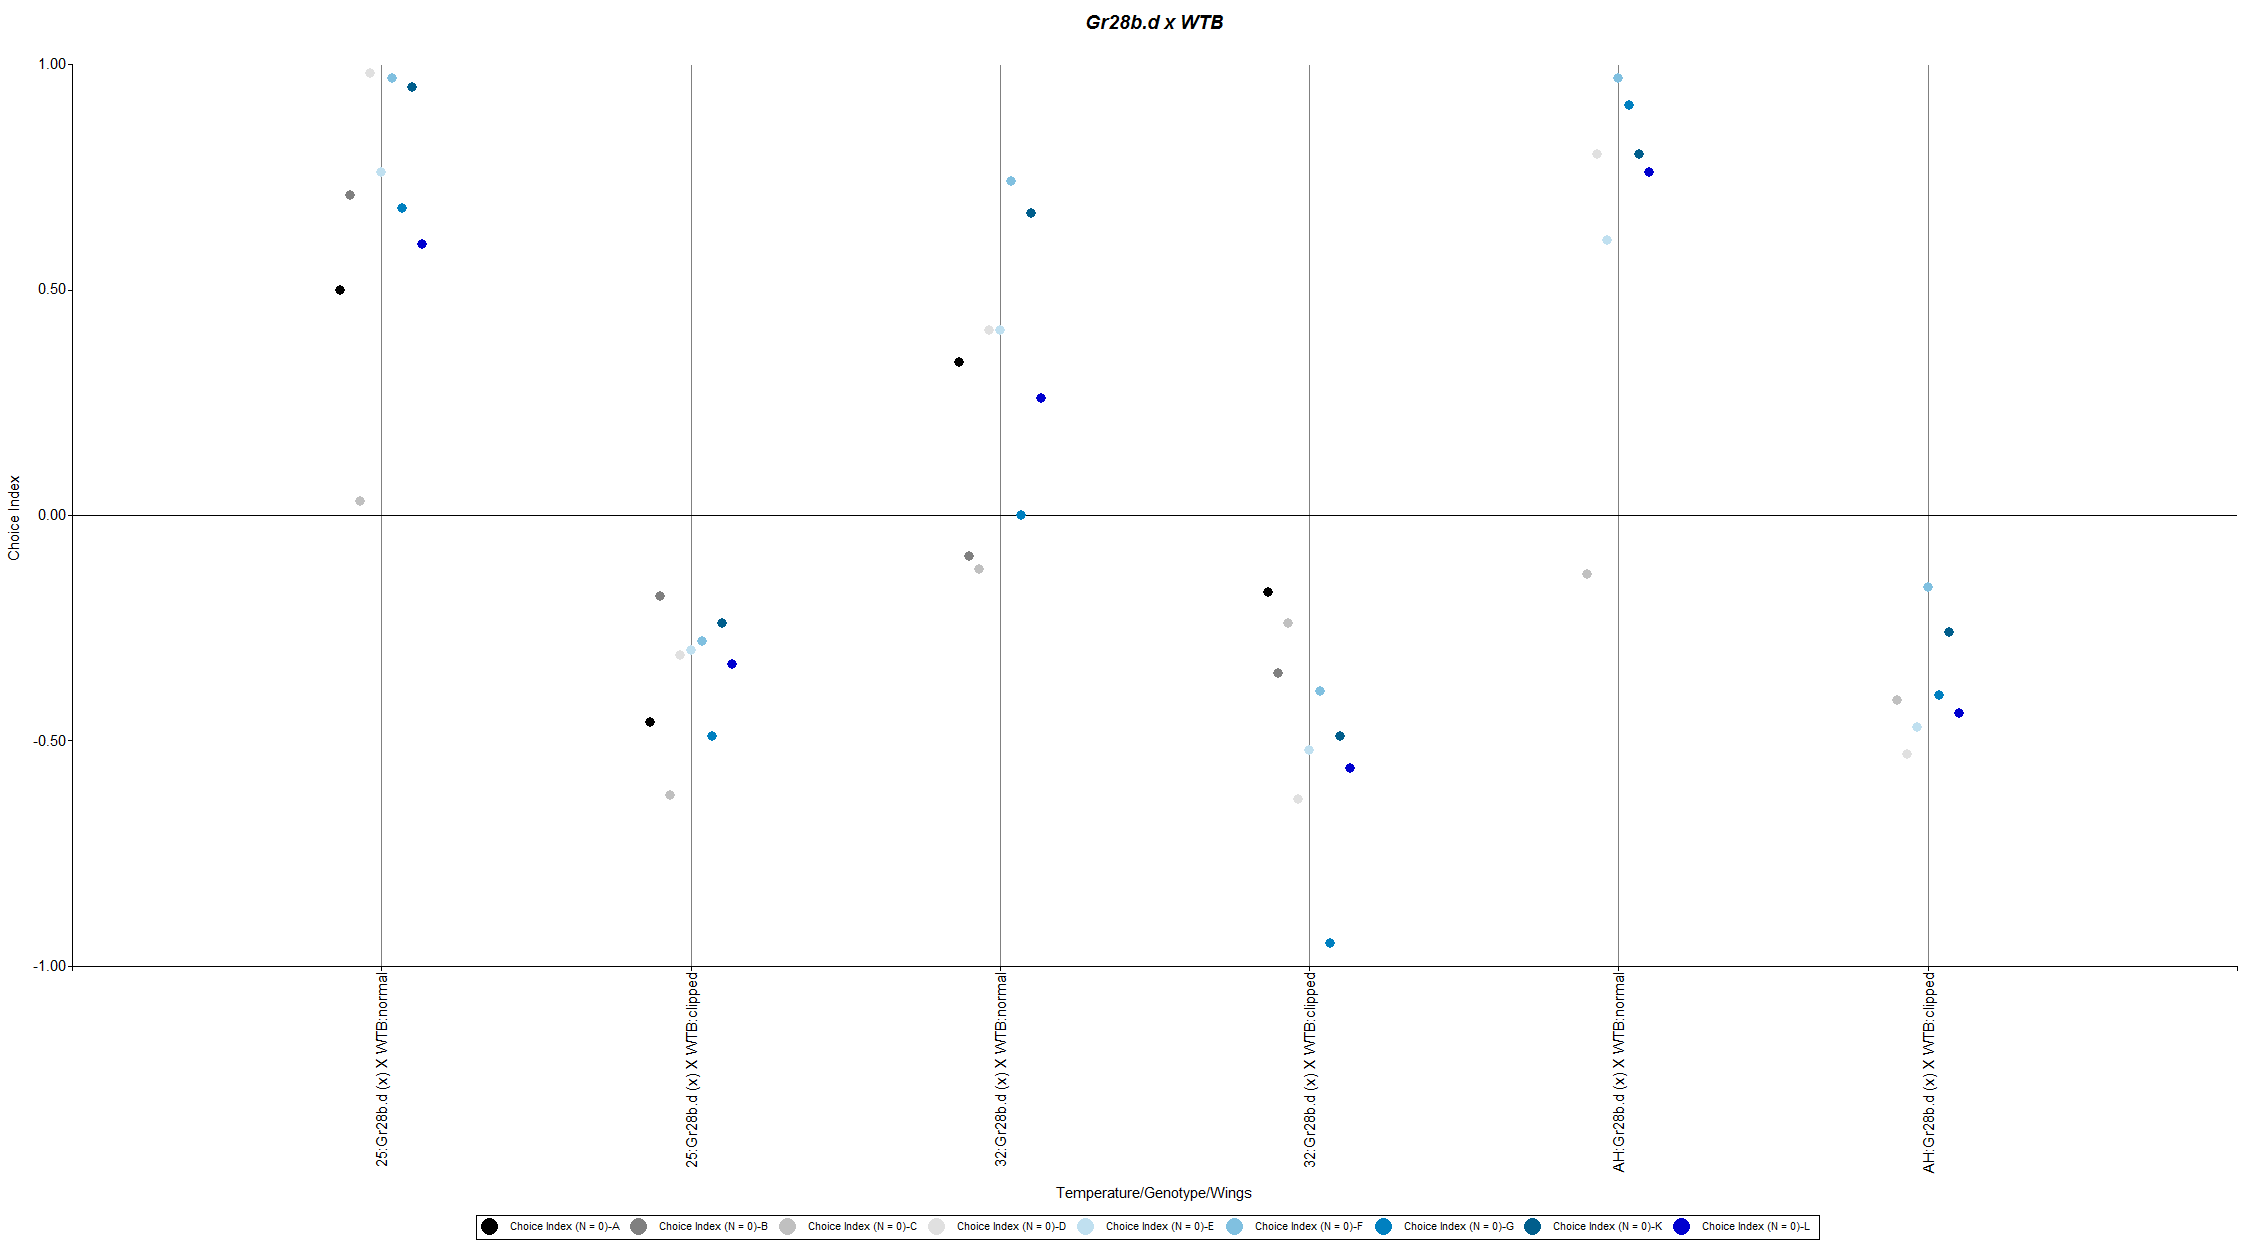
Figure 2: Gr28b.d(X) x WTB
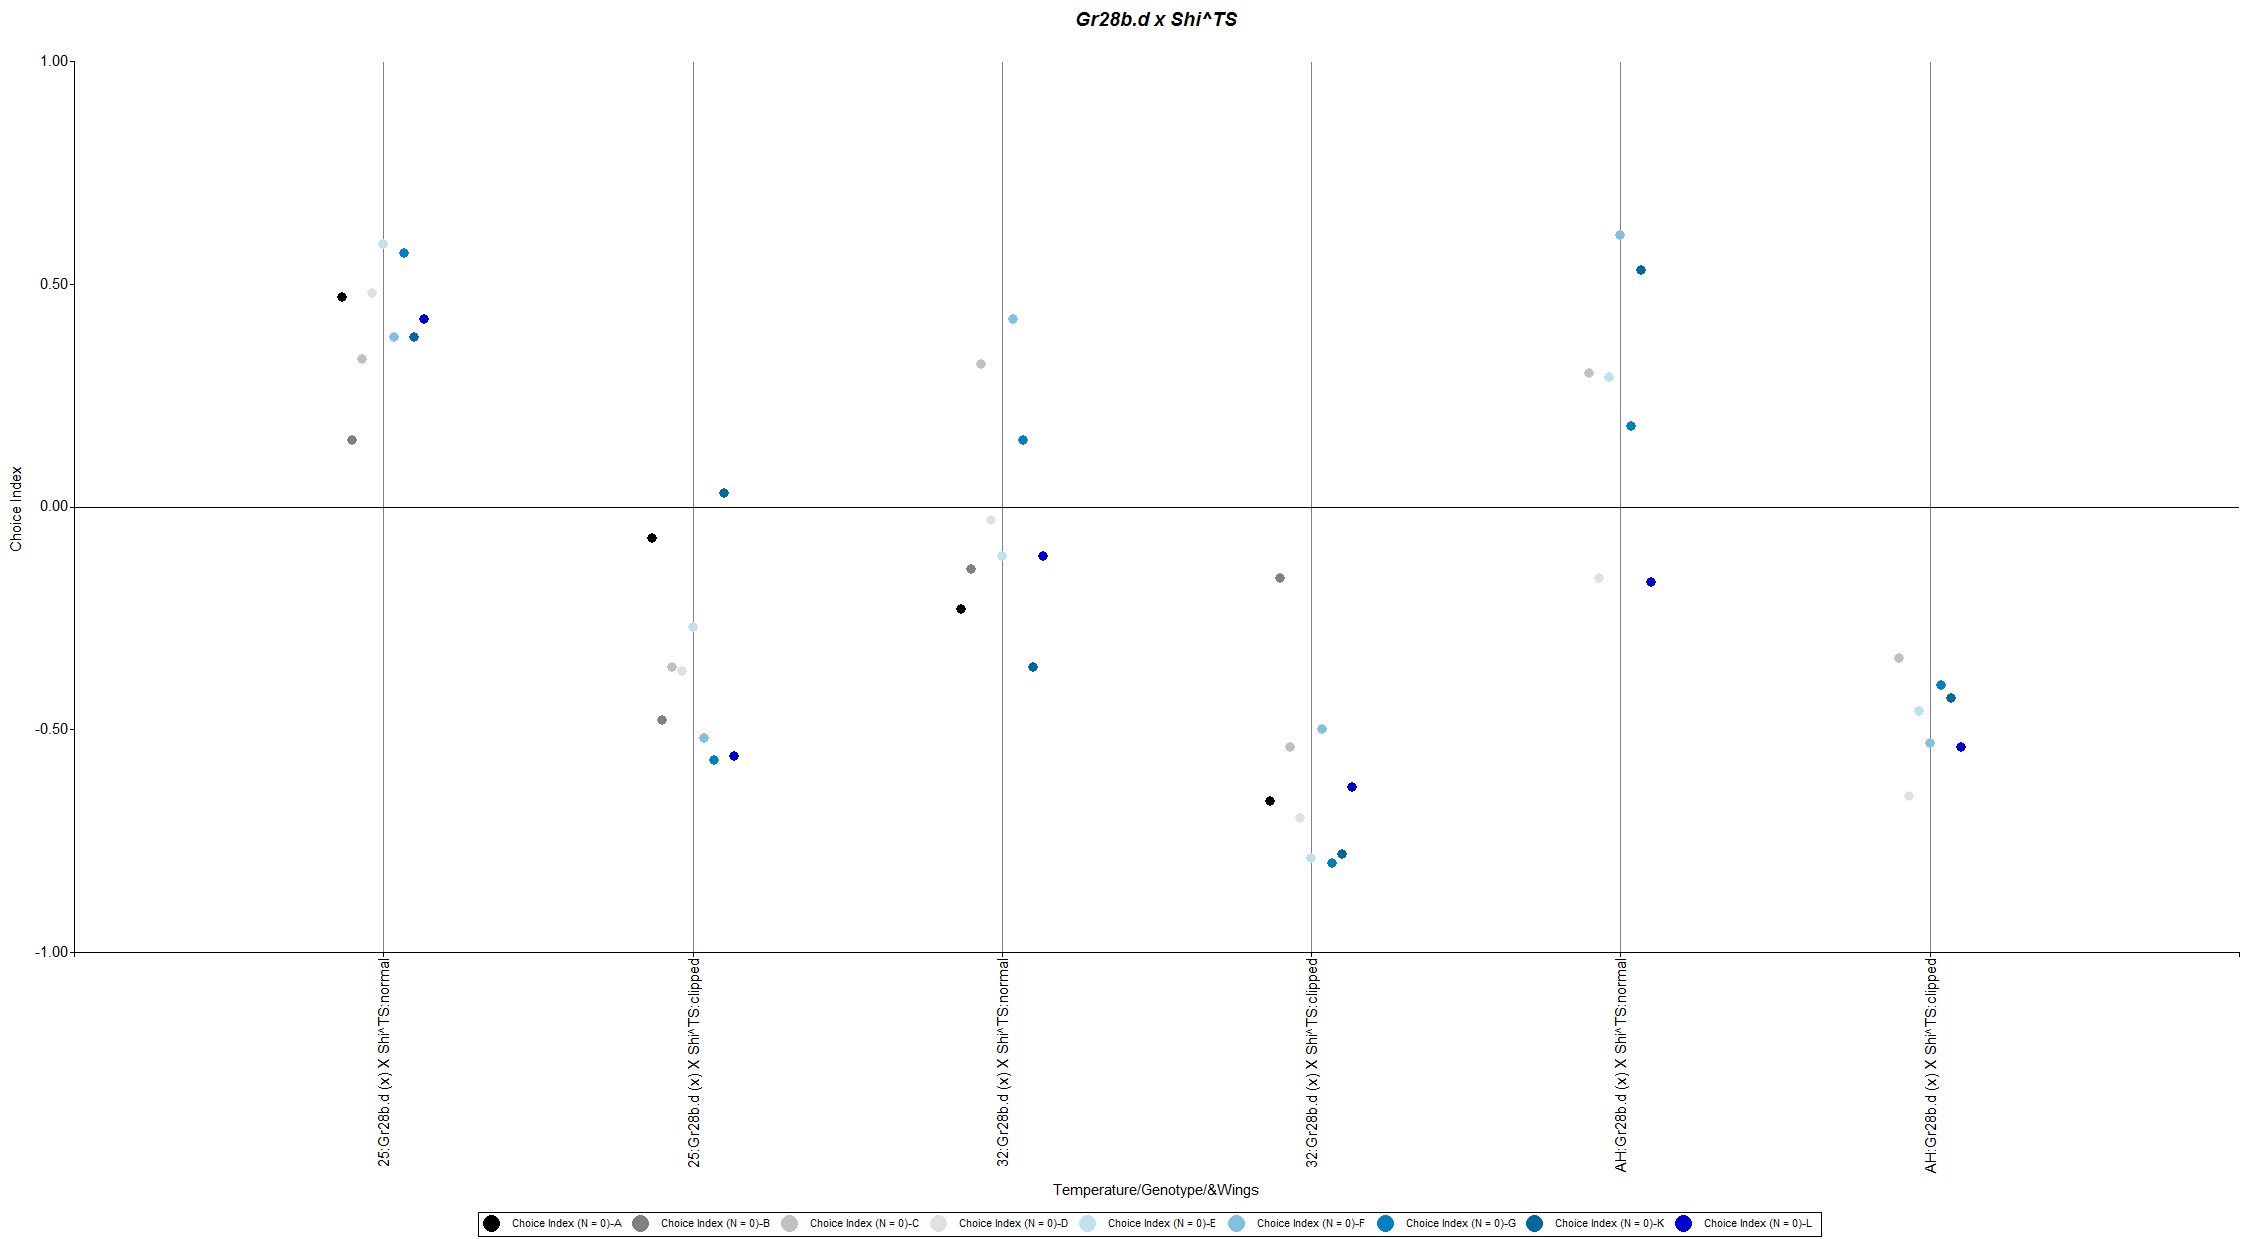
Figure 3: Gr28b.d(X) x ShiTS
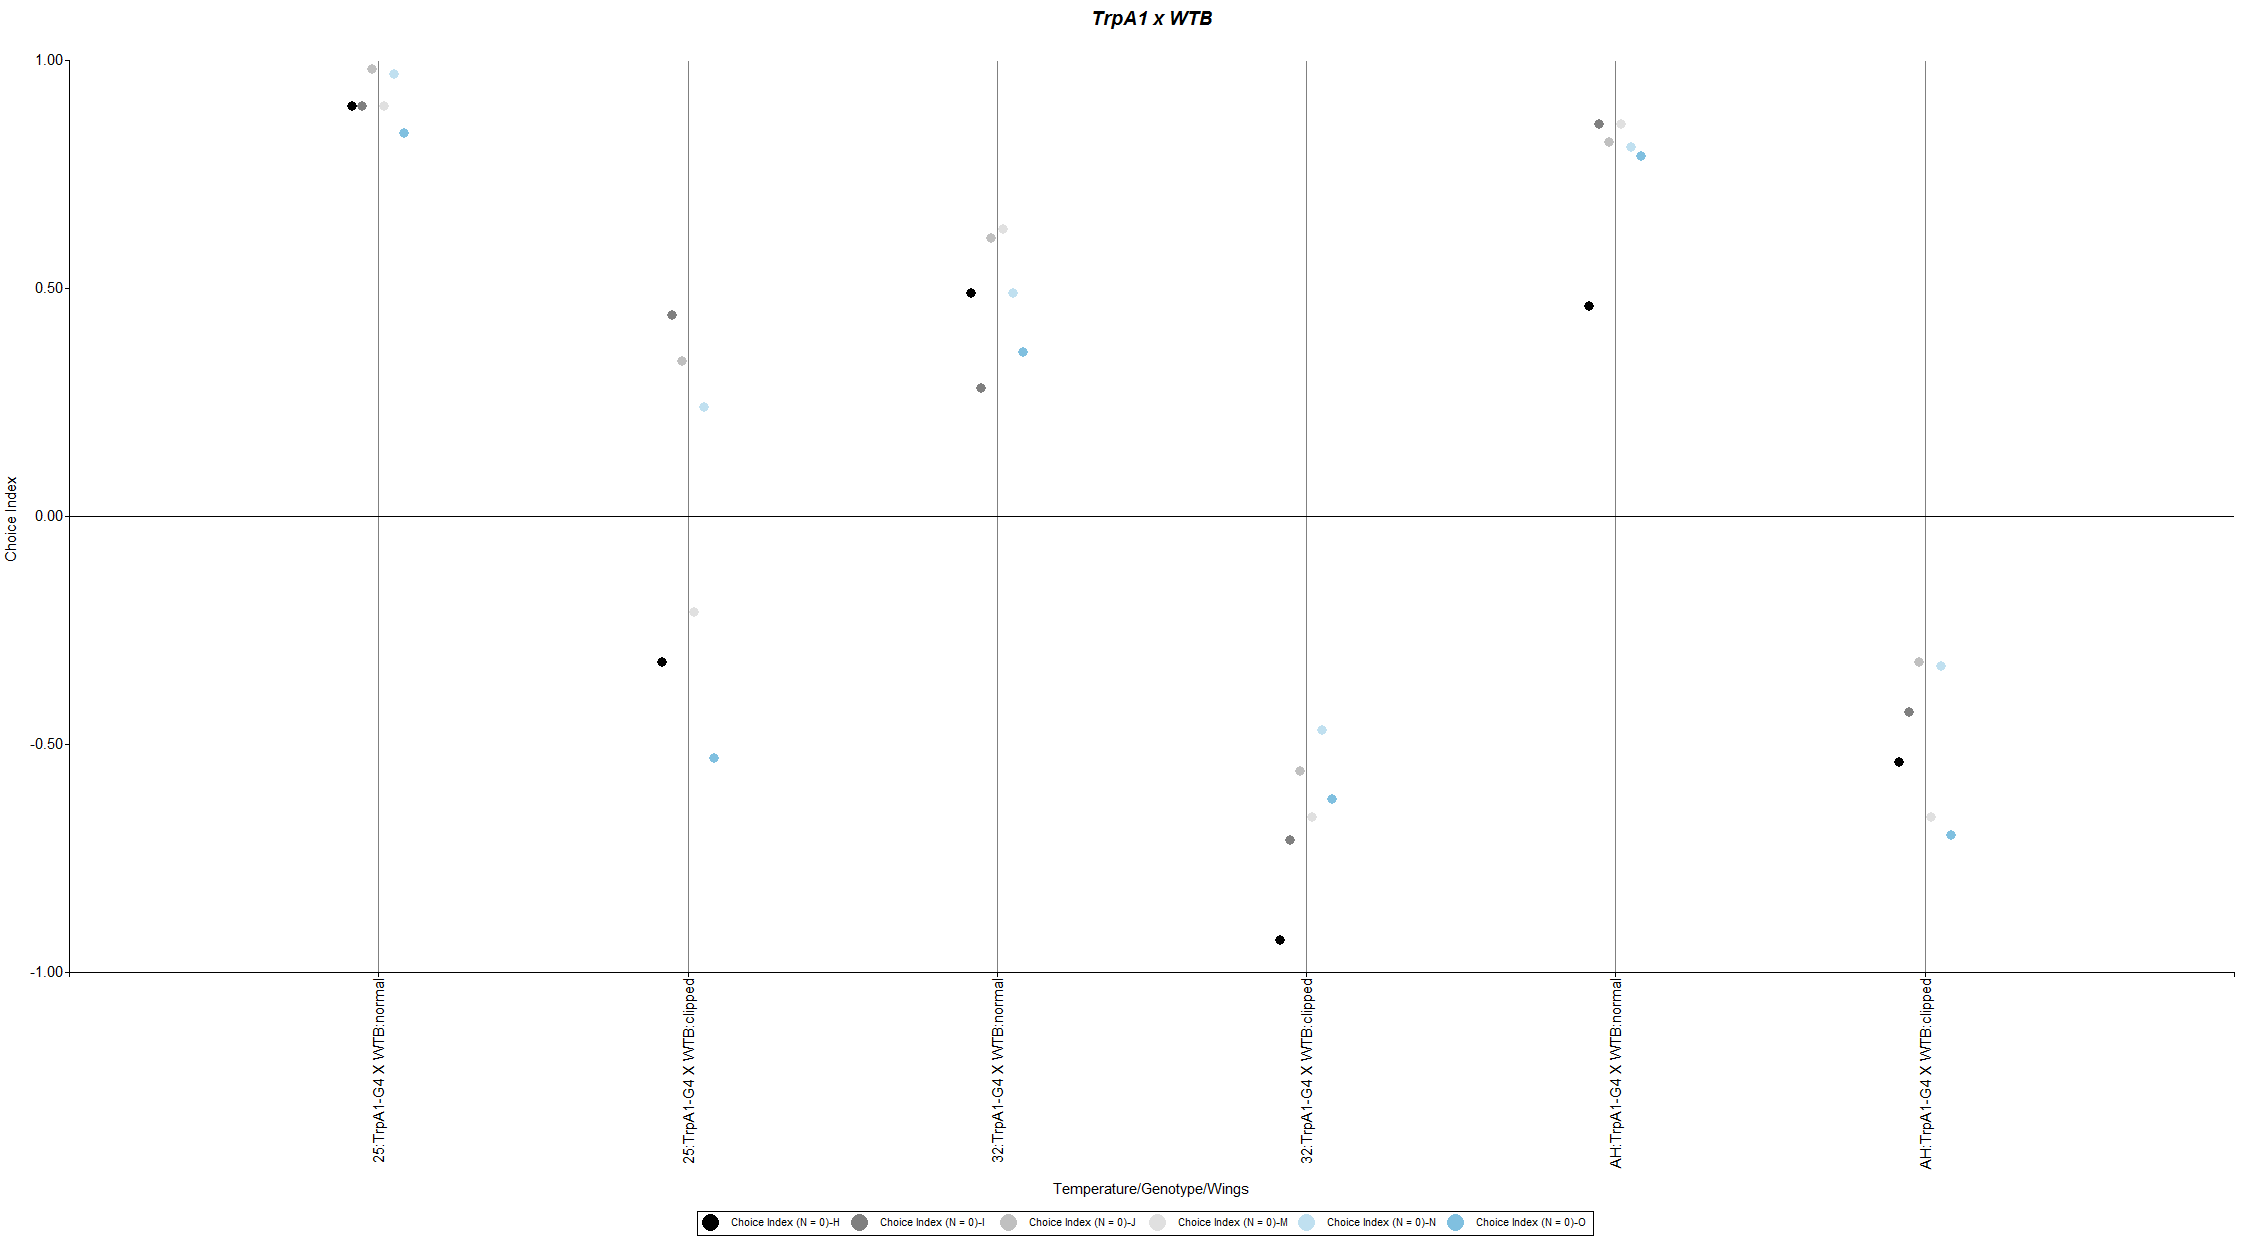
Figure 4: TrpA1 x WTB
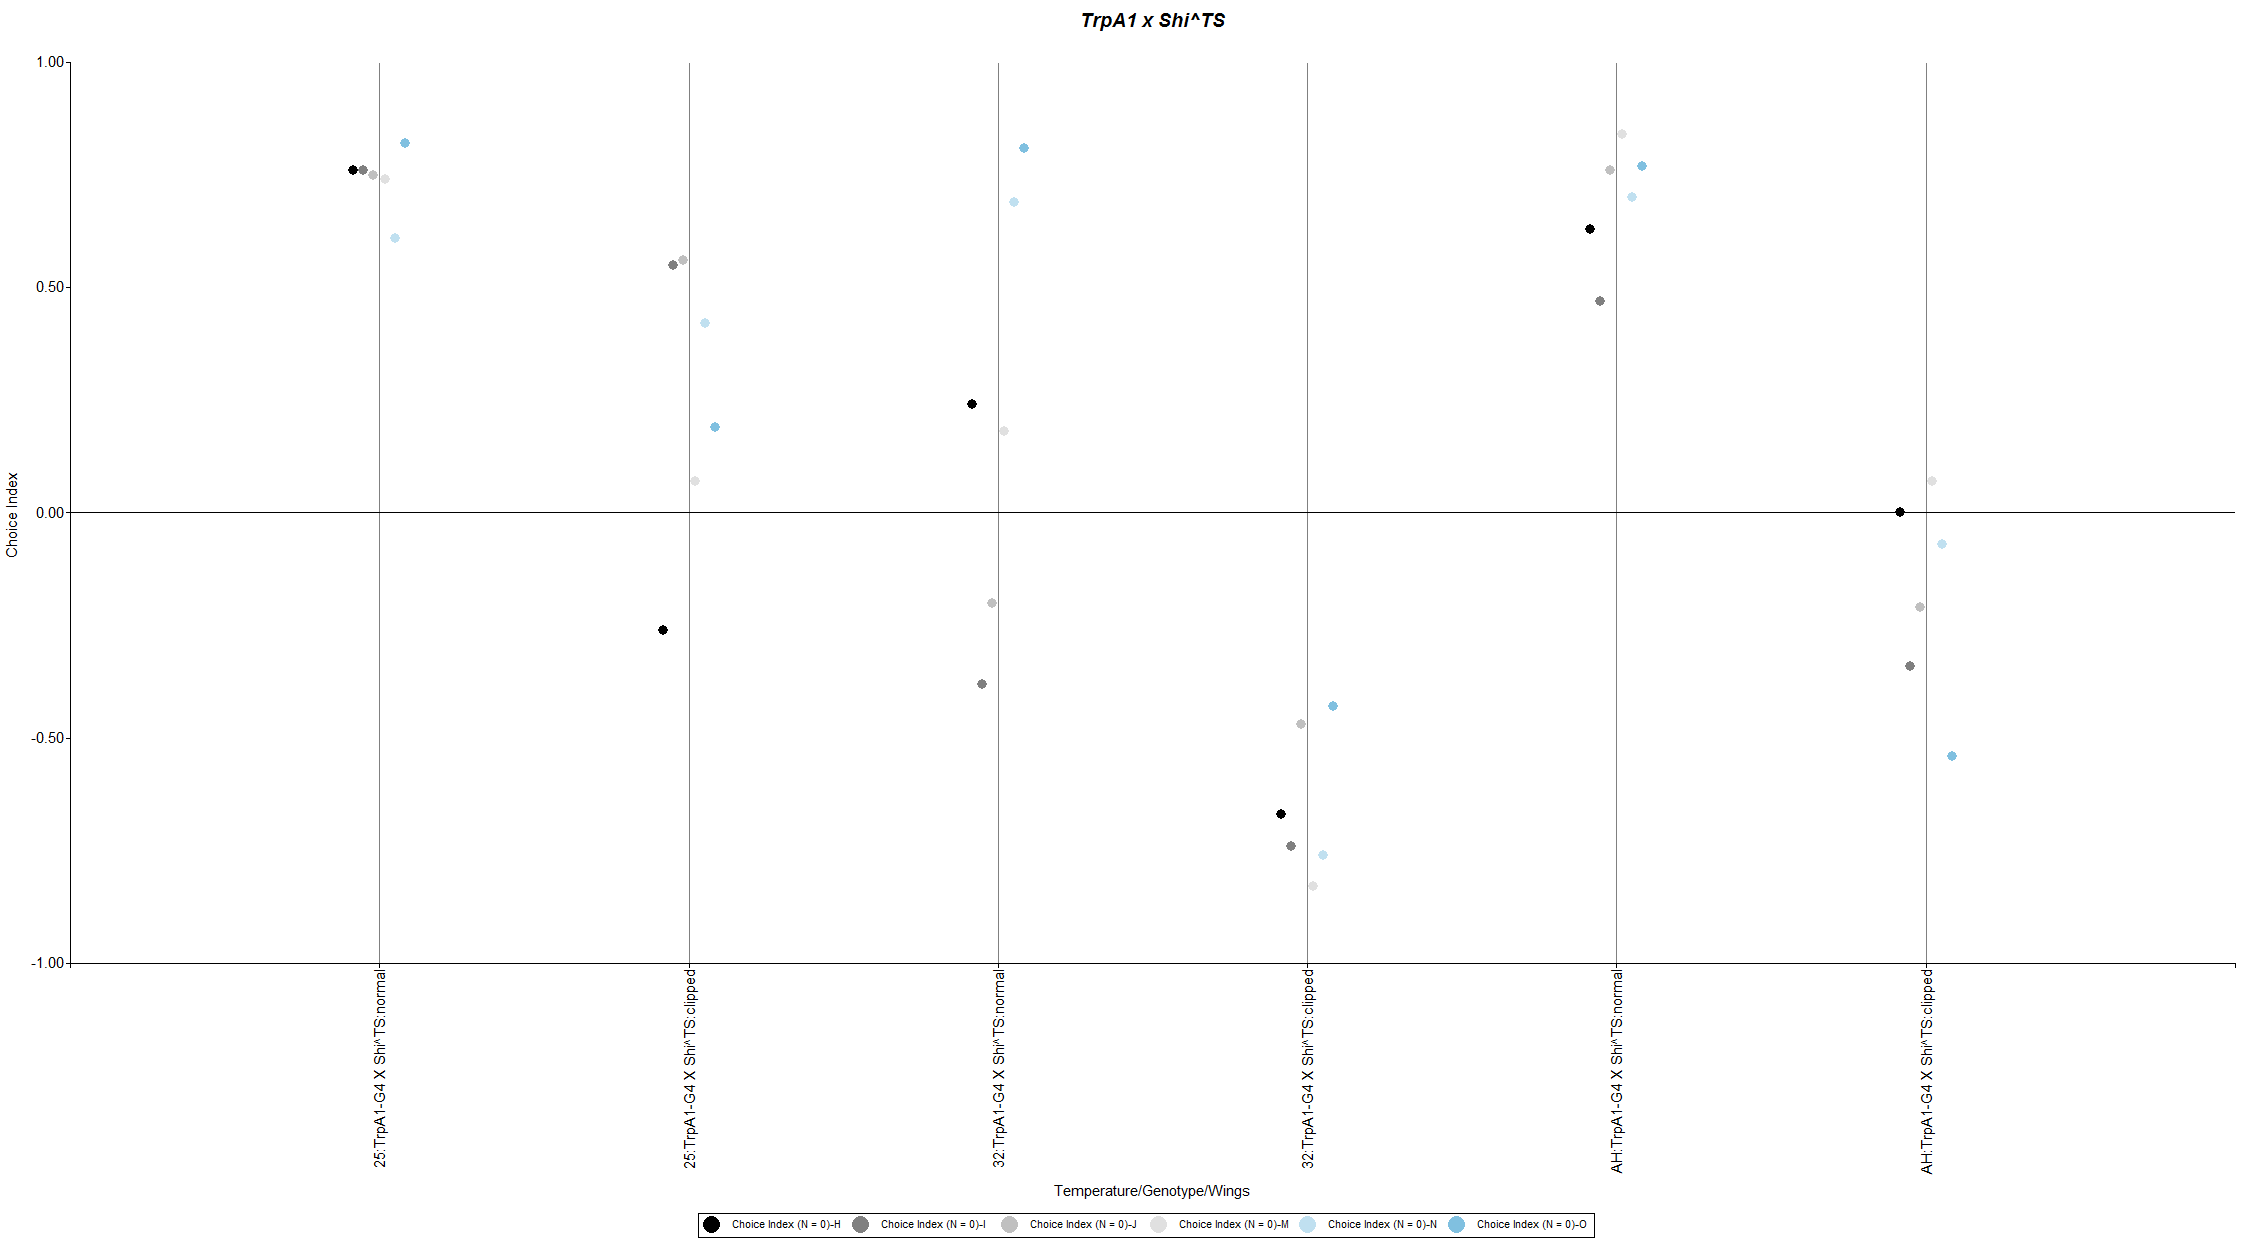
Figure 5: TrpA1 xShiTS
Figure 6 shows the results of the trials for the different WT lines.
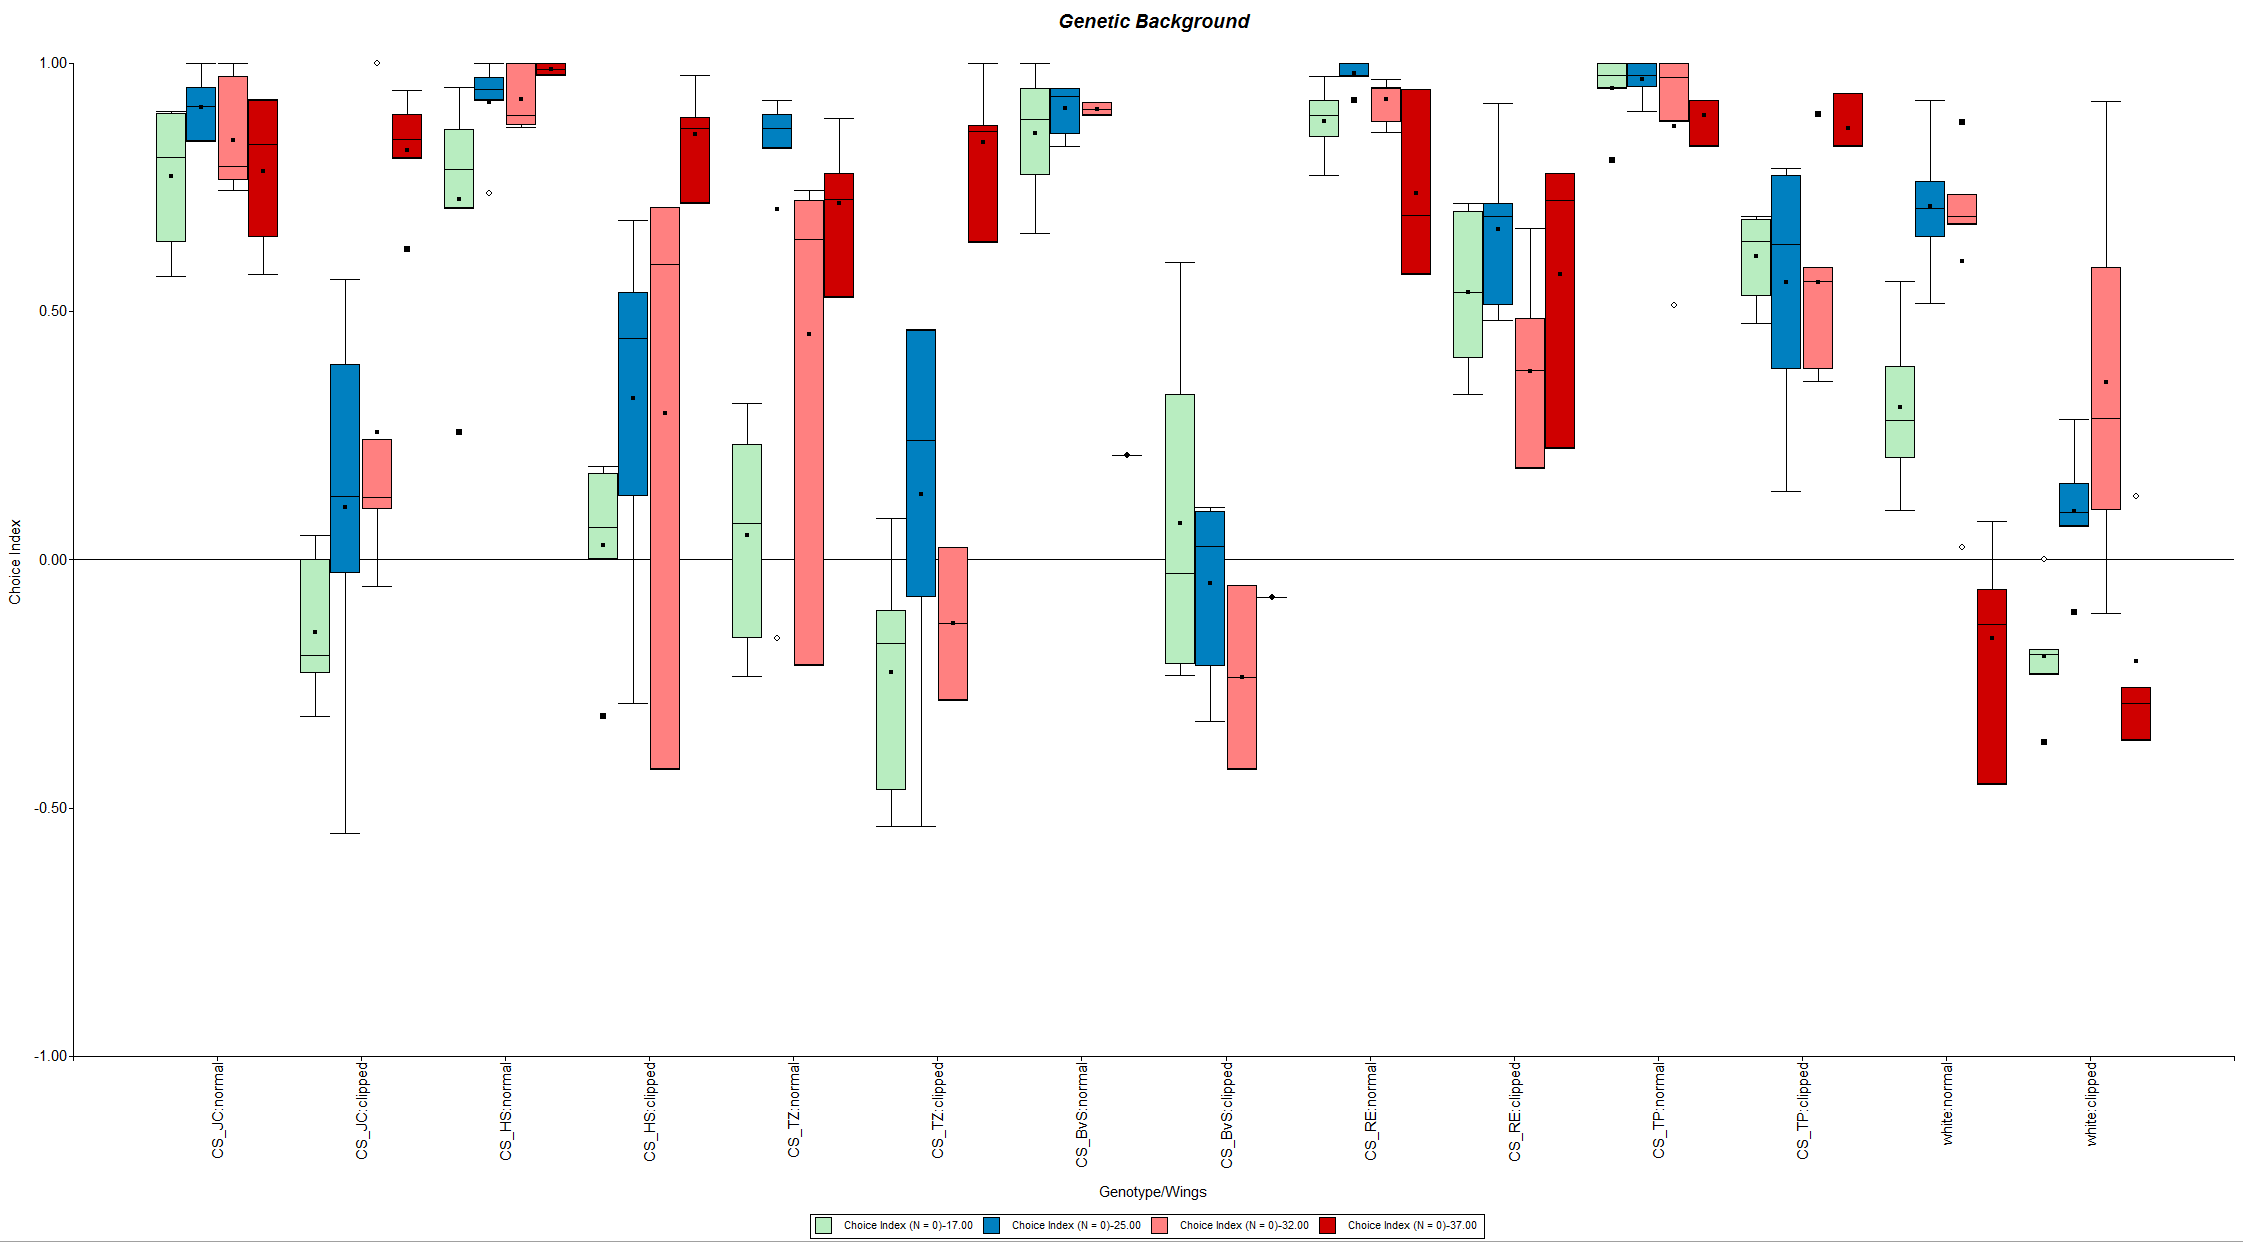
Figure 6: genetic background at four different temperatures (17°C, 25°C, 32°C, 37°C)
Category: temperature_phototaxis, wing clipping | No Comments
Temperature Impact on Phototactic Behavior – Different Dates and the Genetic Background
on Monday, November 23rd, 2015 2:43 | by Amelie Roedel
Here you see the different Experiments. I sorted them by Date (Figure 1)
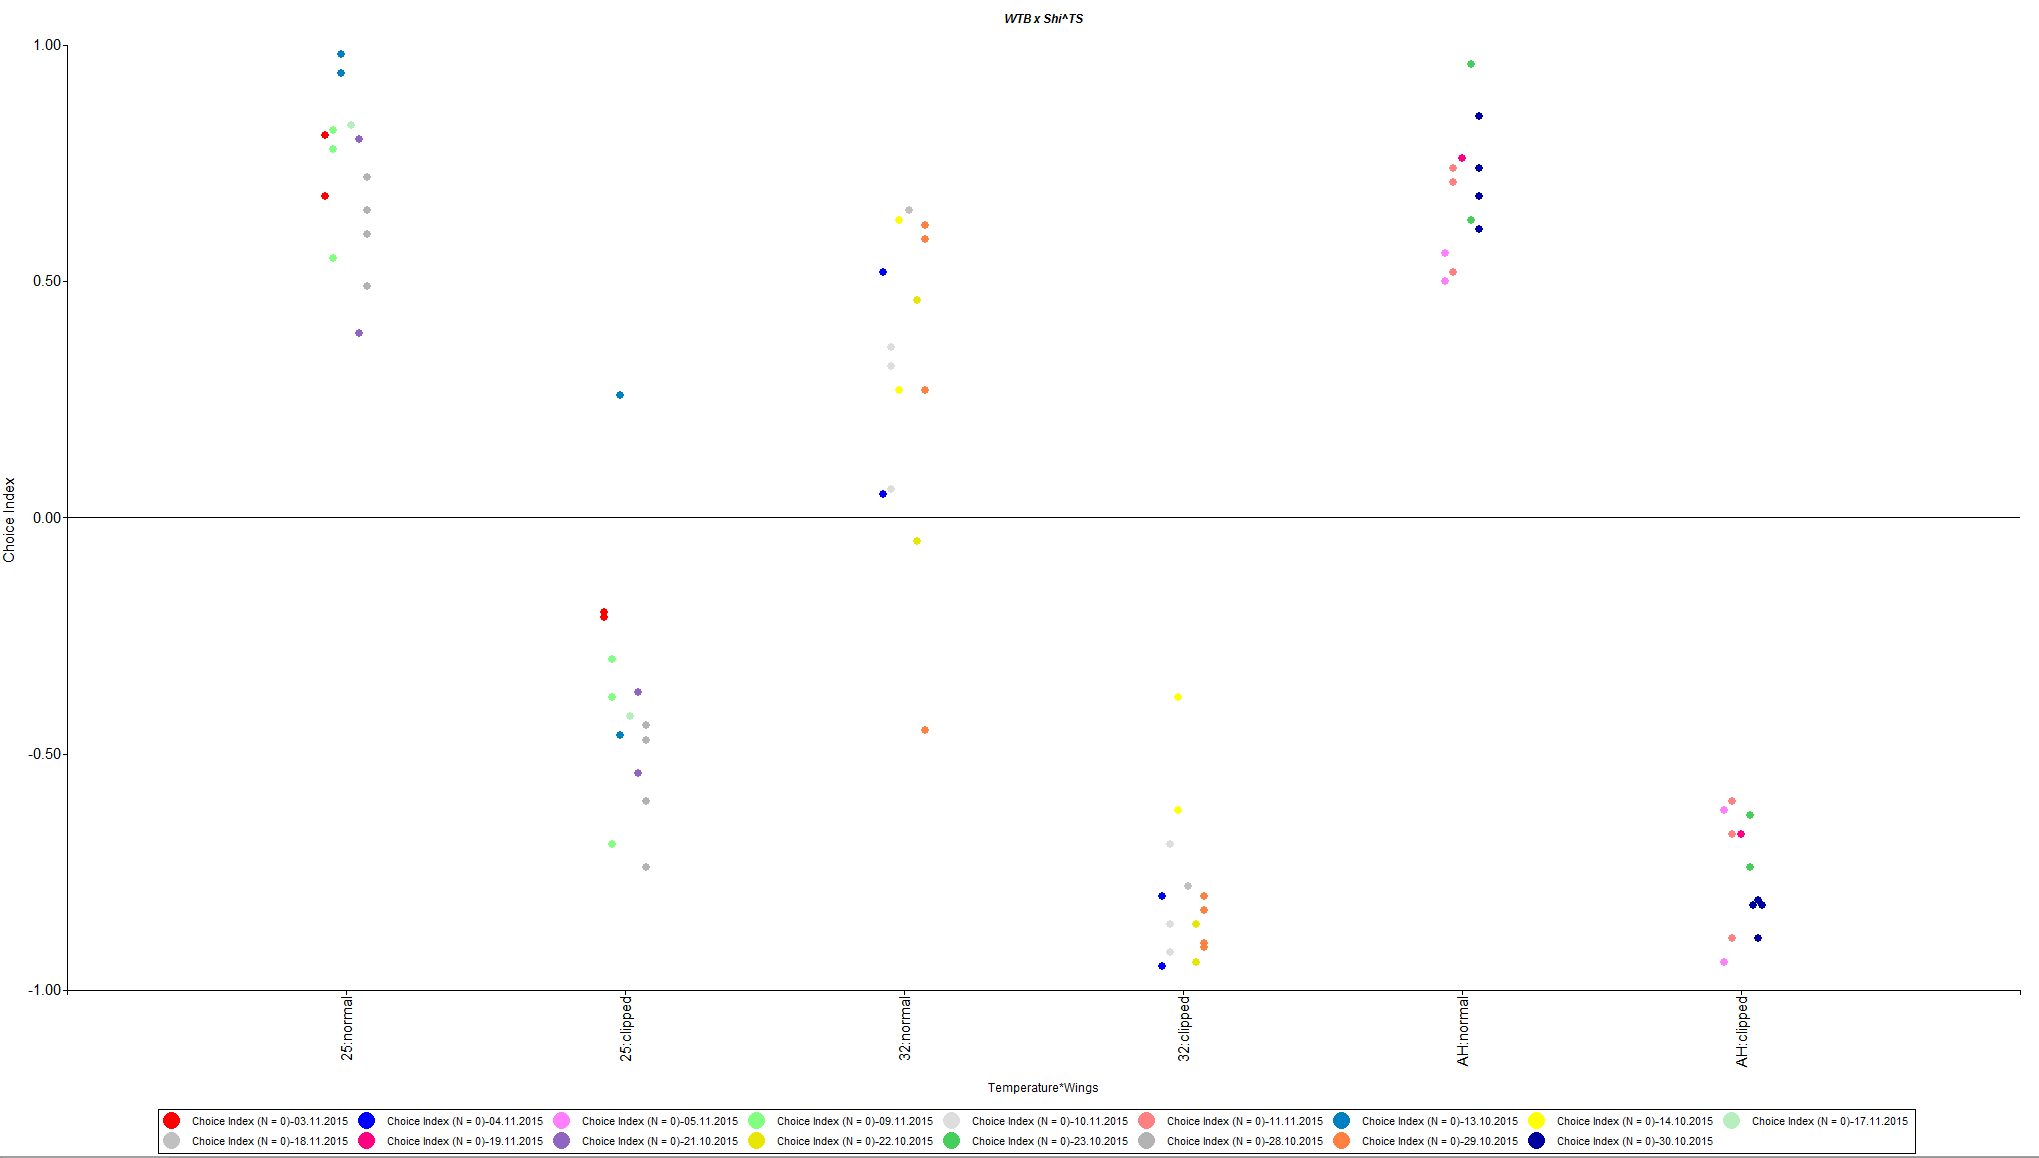
Figure 1: Shi x WTB sorted by date
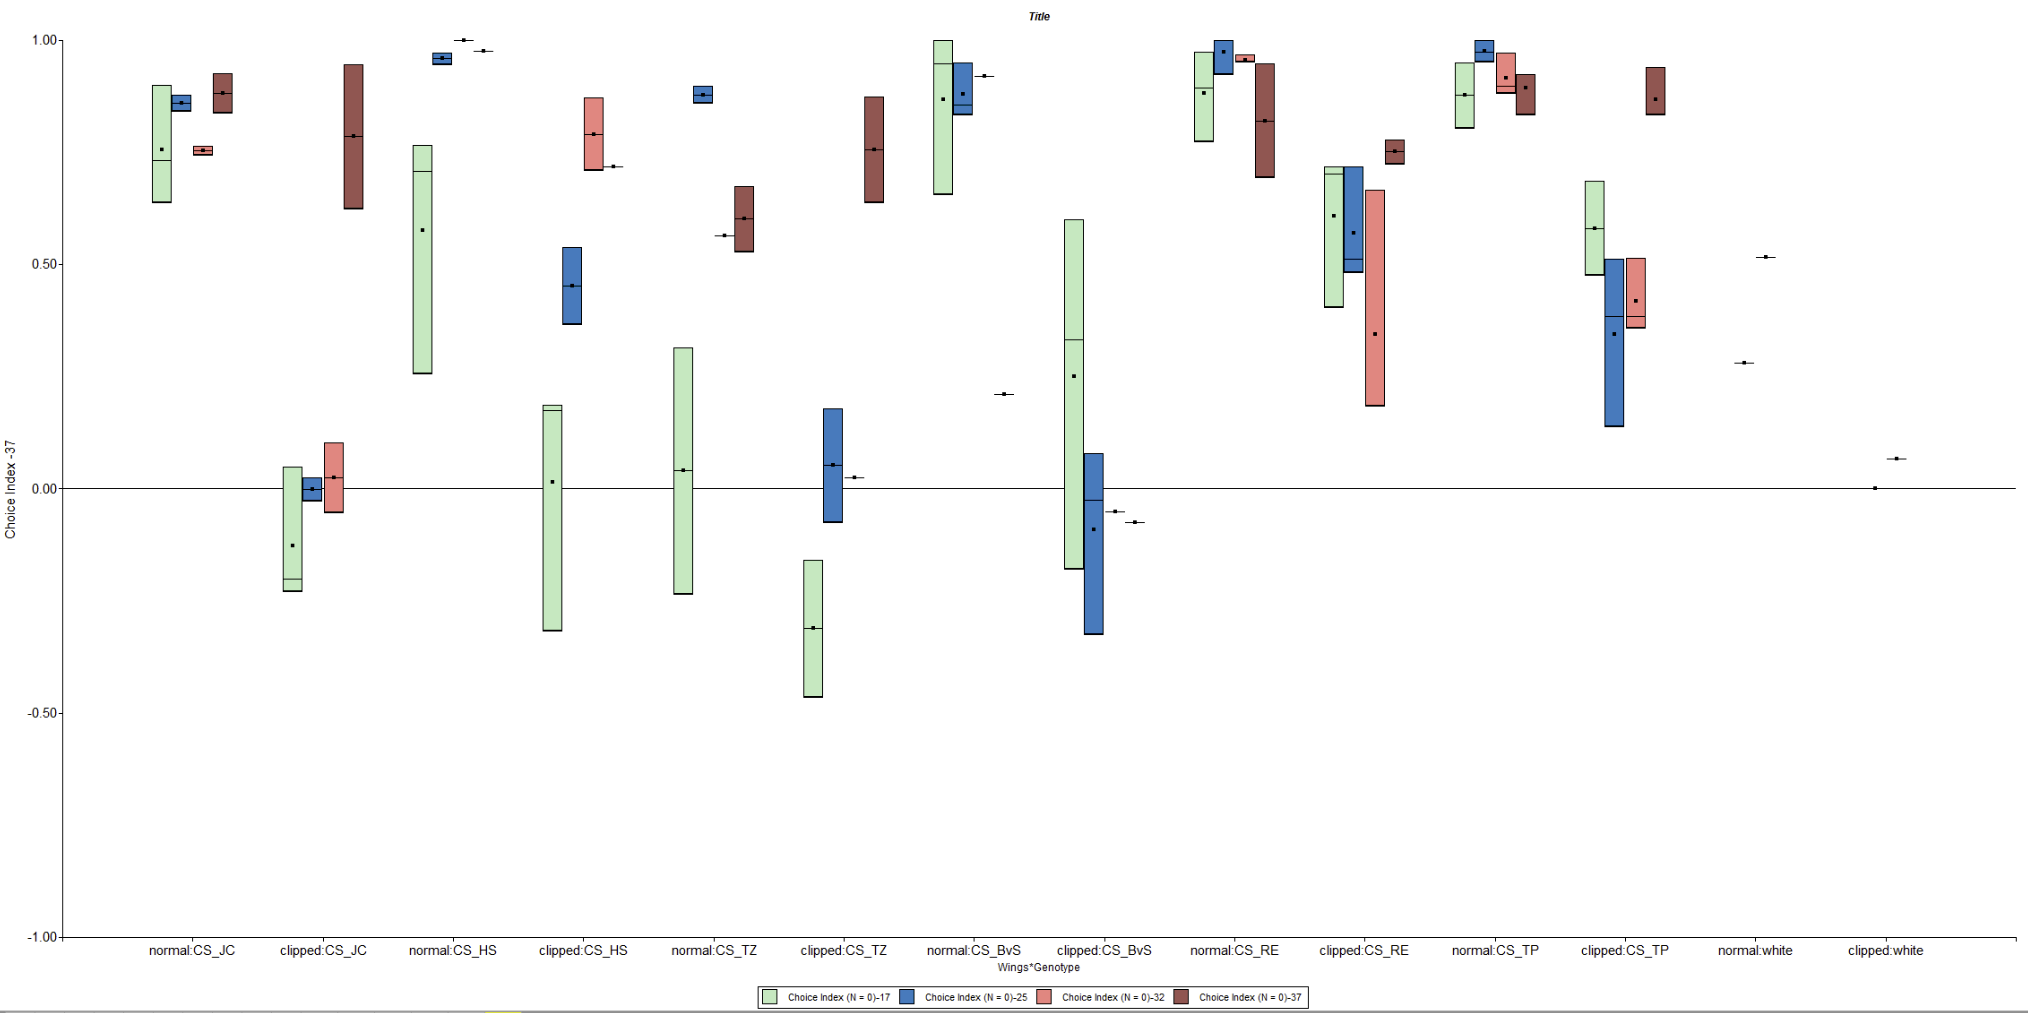
Figure 2: genetic background
Category: temperature_phototaxis, wing clipping | No Comments
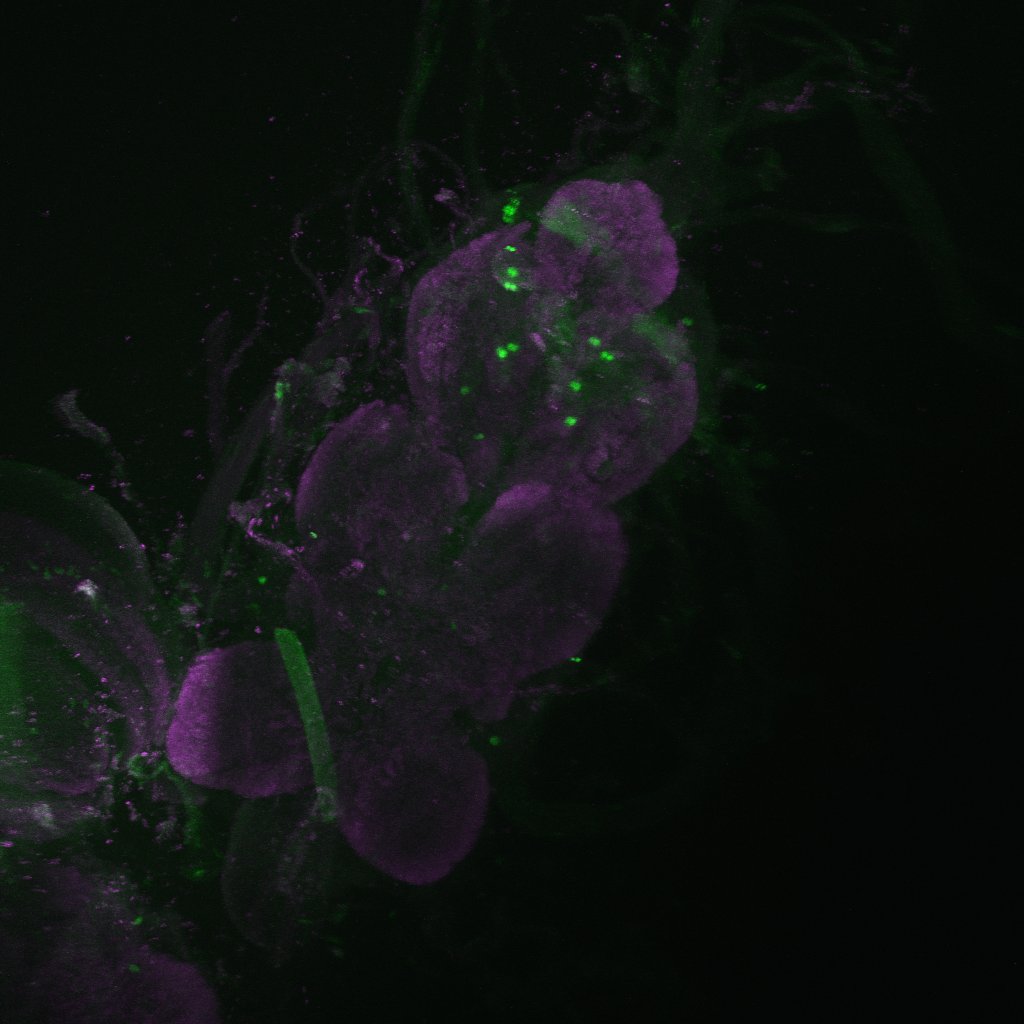
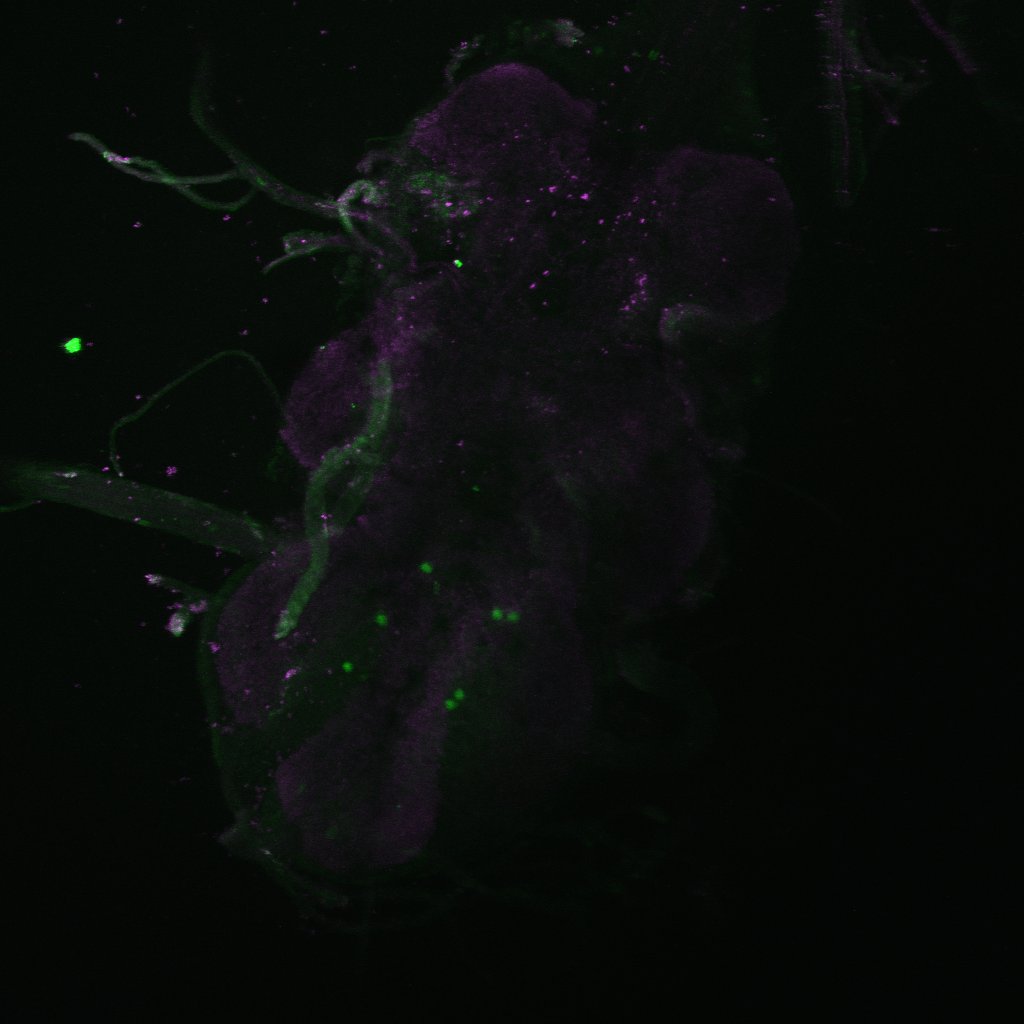
Phototactic flexibility – Neural substrates
on Monday, November 23rd, 2015 2:29 | by Axel Gorostiza
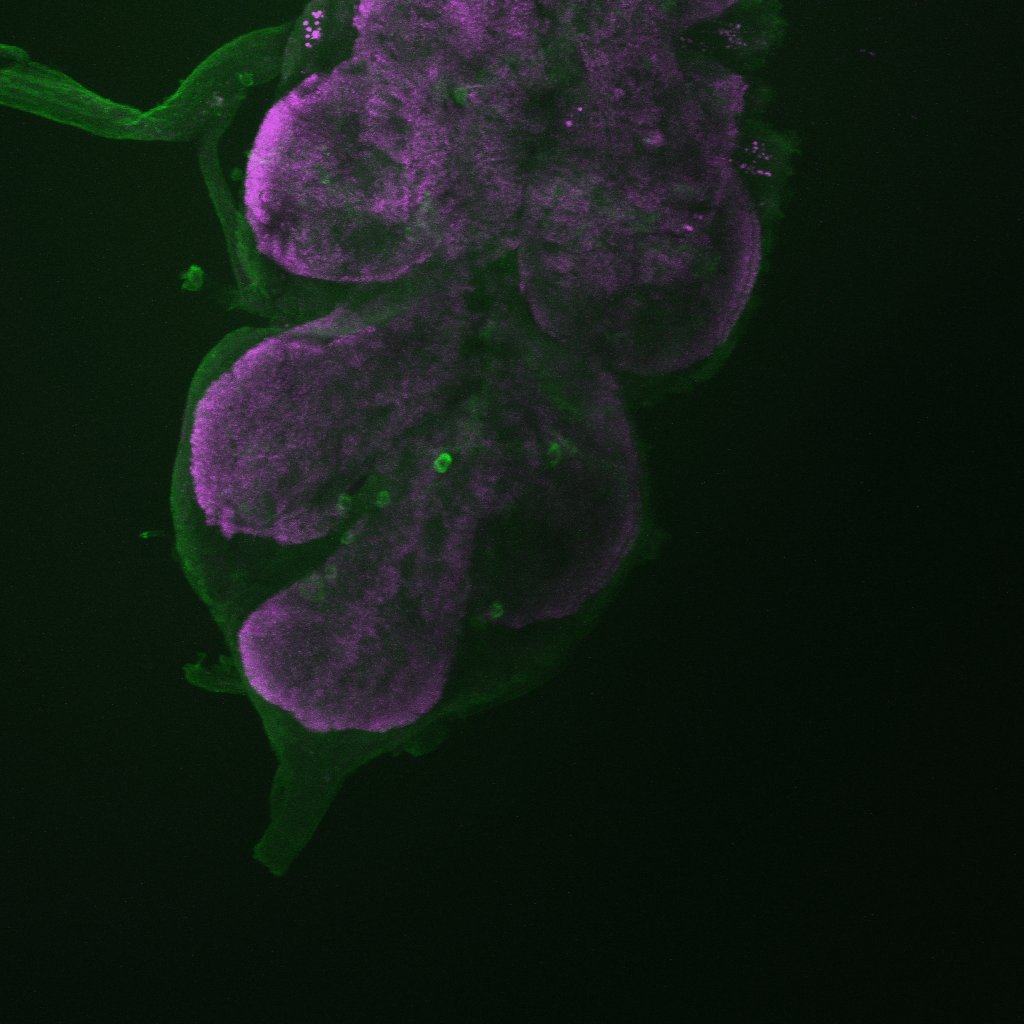
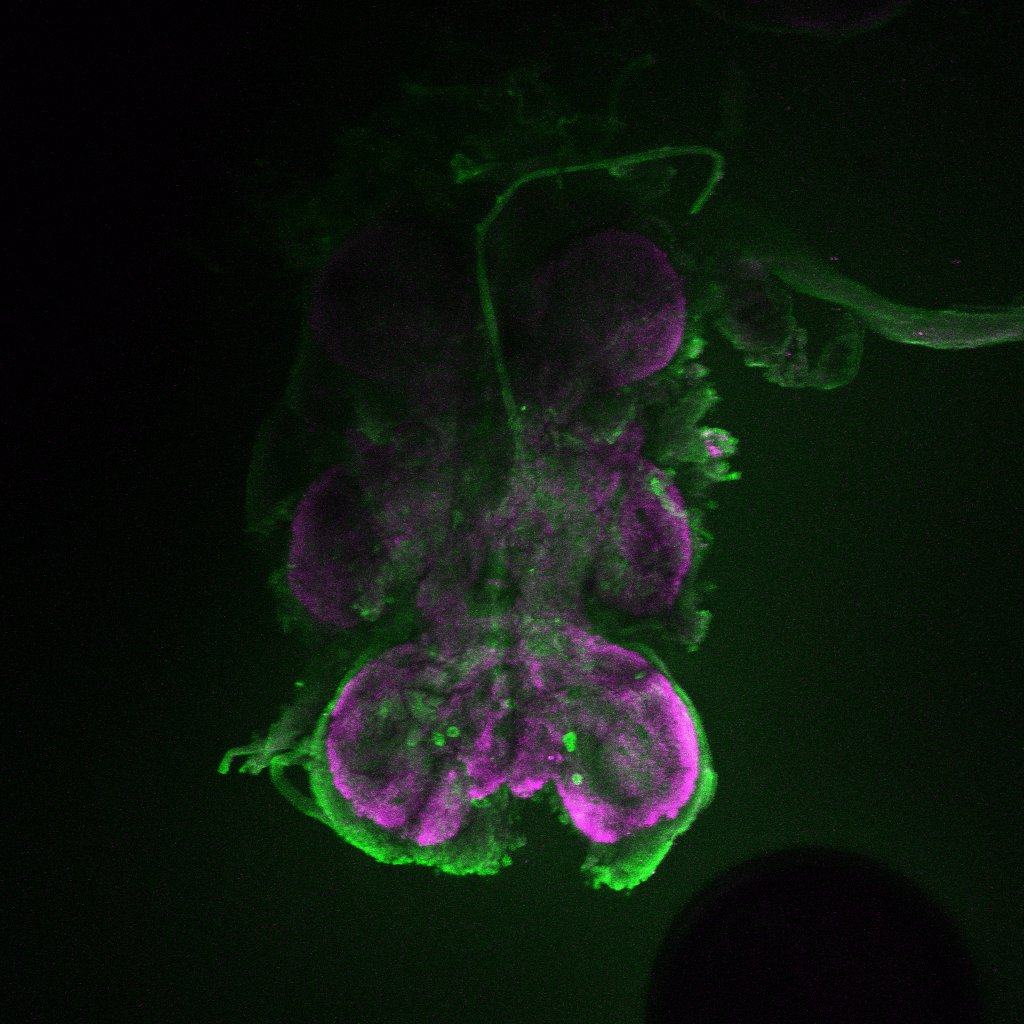
In order to find which dopaminergic and octopaminergic neurons are related to light preference and the switch on it seen after clipping the wings, I decided to use a tool called CaLexA.
Here we can see my first attempt to use it. We can see the CNS from TH>CaLexA flies with and without wings.
I did not see any special signal in the brains, but I still have to play around a little bit more.
With Wings
Without Wings
Category: Anatomy, Biogenic Amines, wing clipping | No Comments