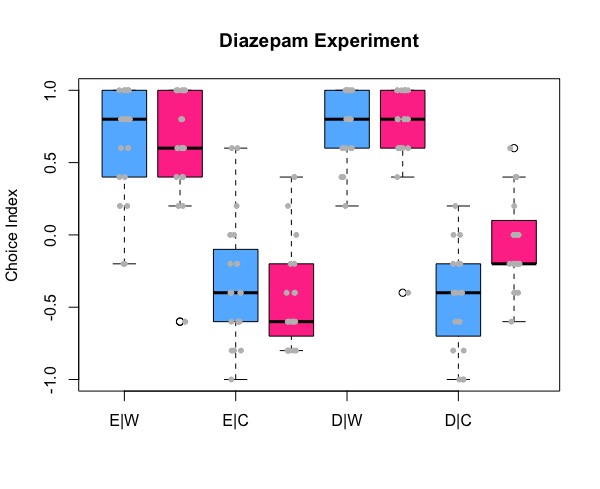
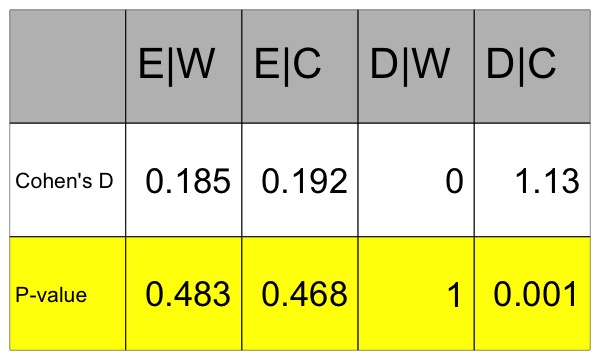
Update on the Diazepam Experiment
on Thursday, June 1st, 2017 4:05 | by Saloni Rose

Category: Uncategorized, wing clipping | No Comments
Updates on R,S,WTB tests
on Friday, May 26th, 2017 1:20 | by Weitian Sun
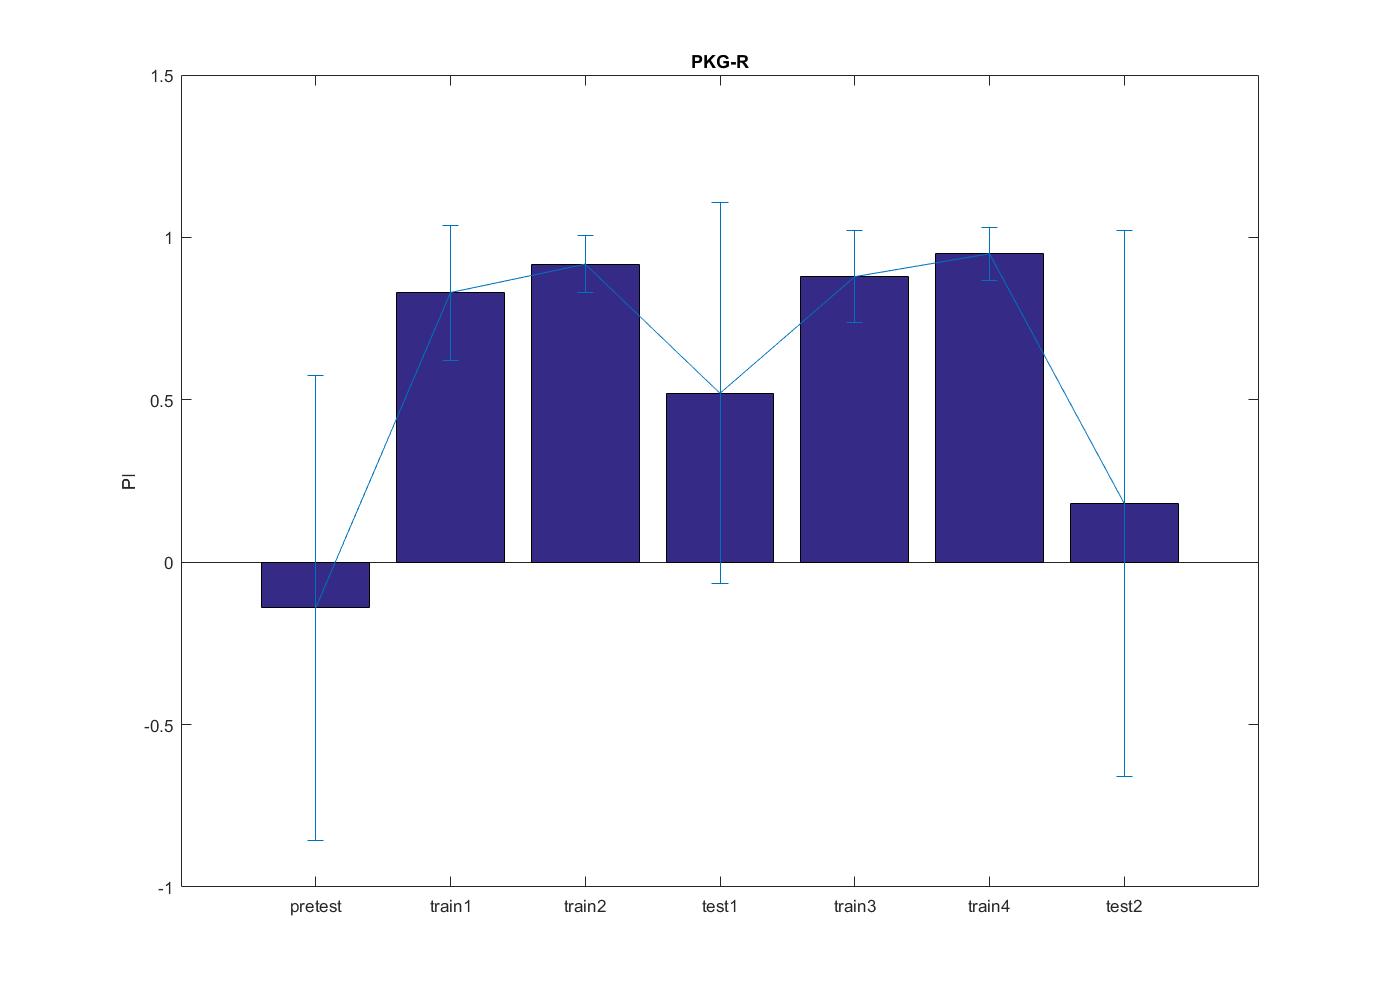
Rover, N=3
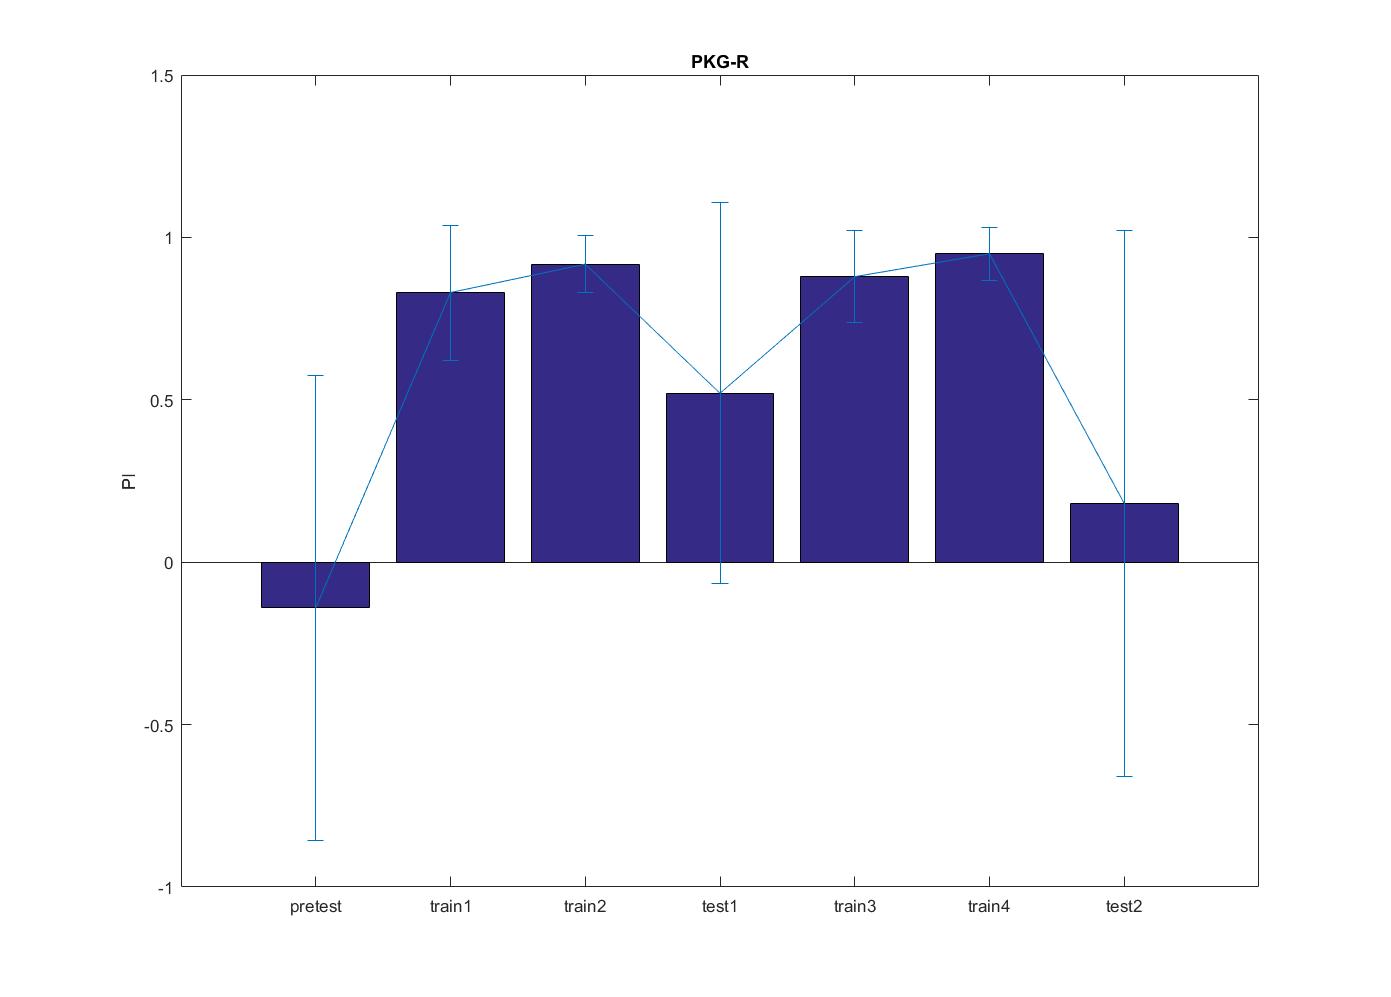
sitter, N=2
wtb, N=4
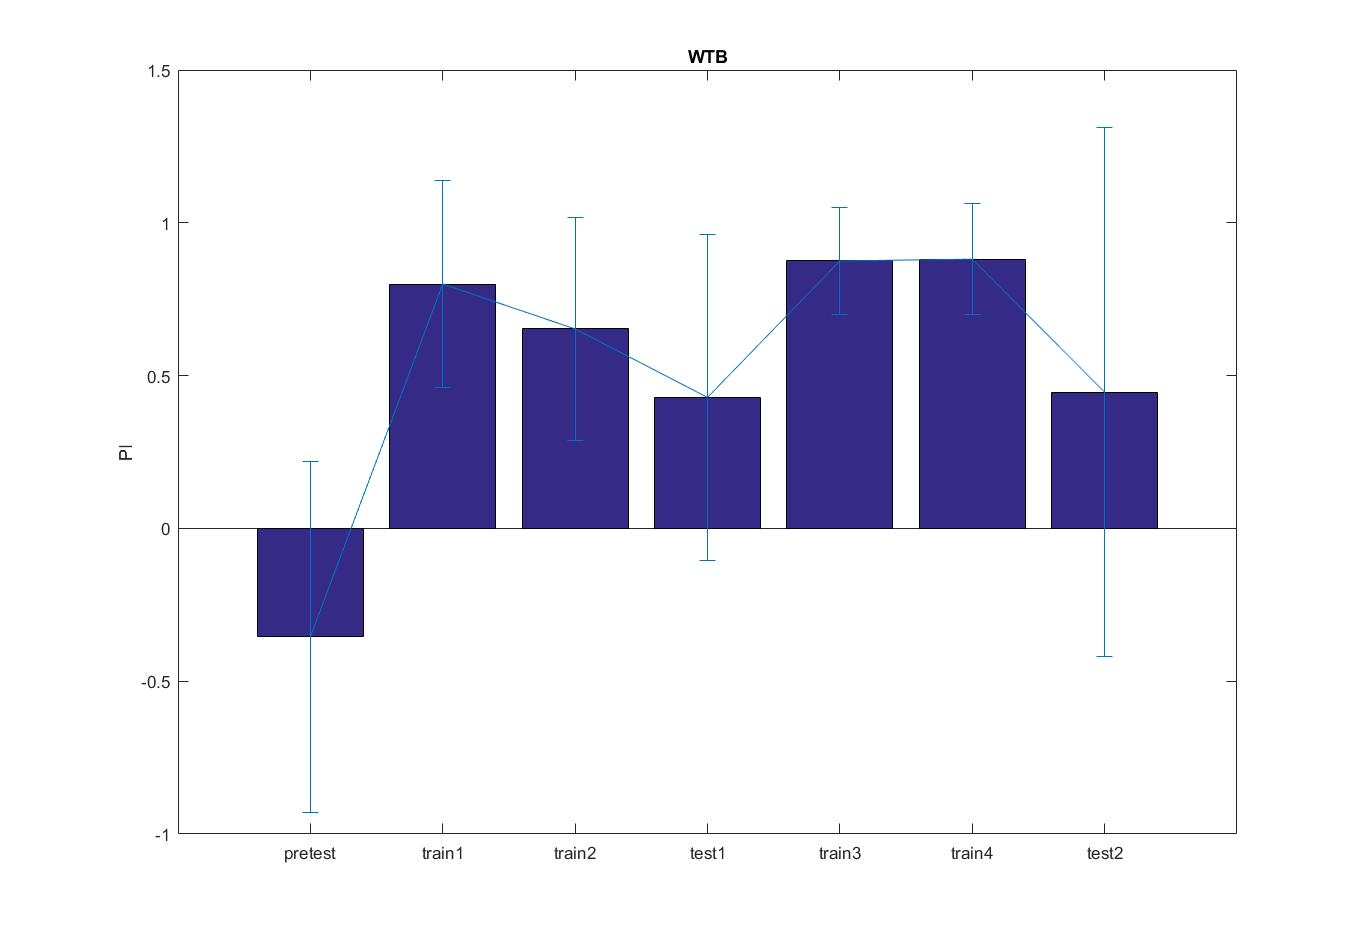
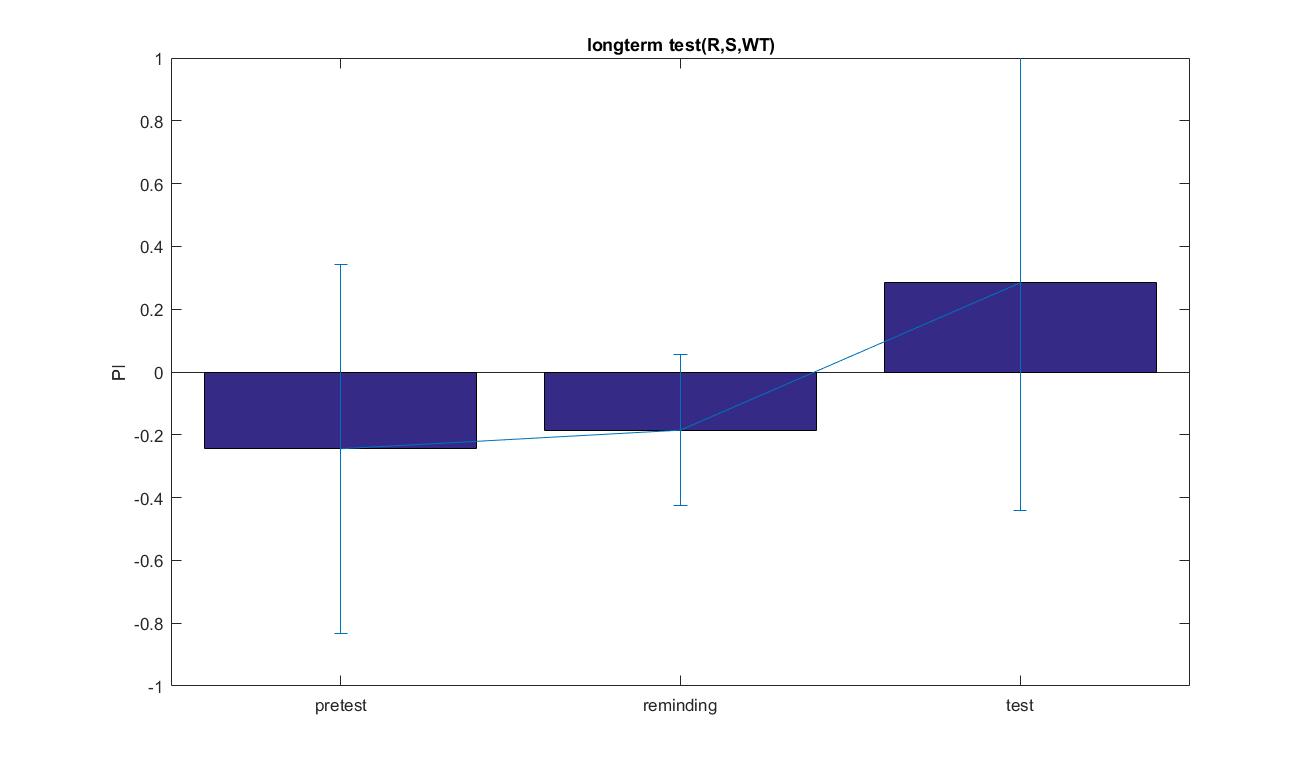
longterm, N=13 (old WTB excluded)
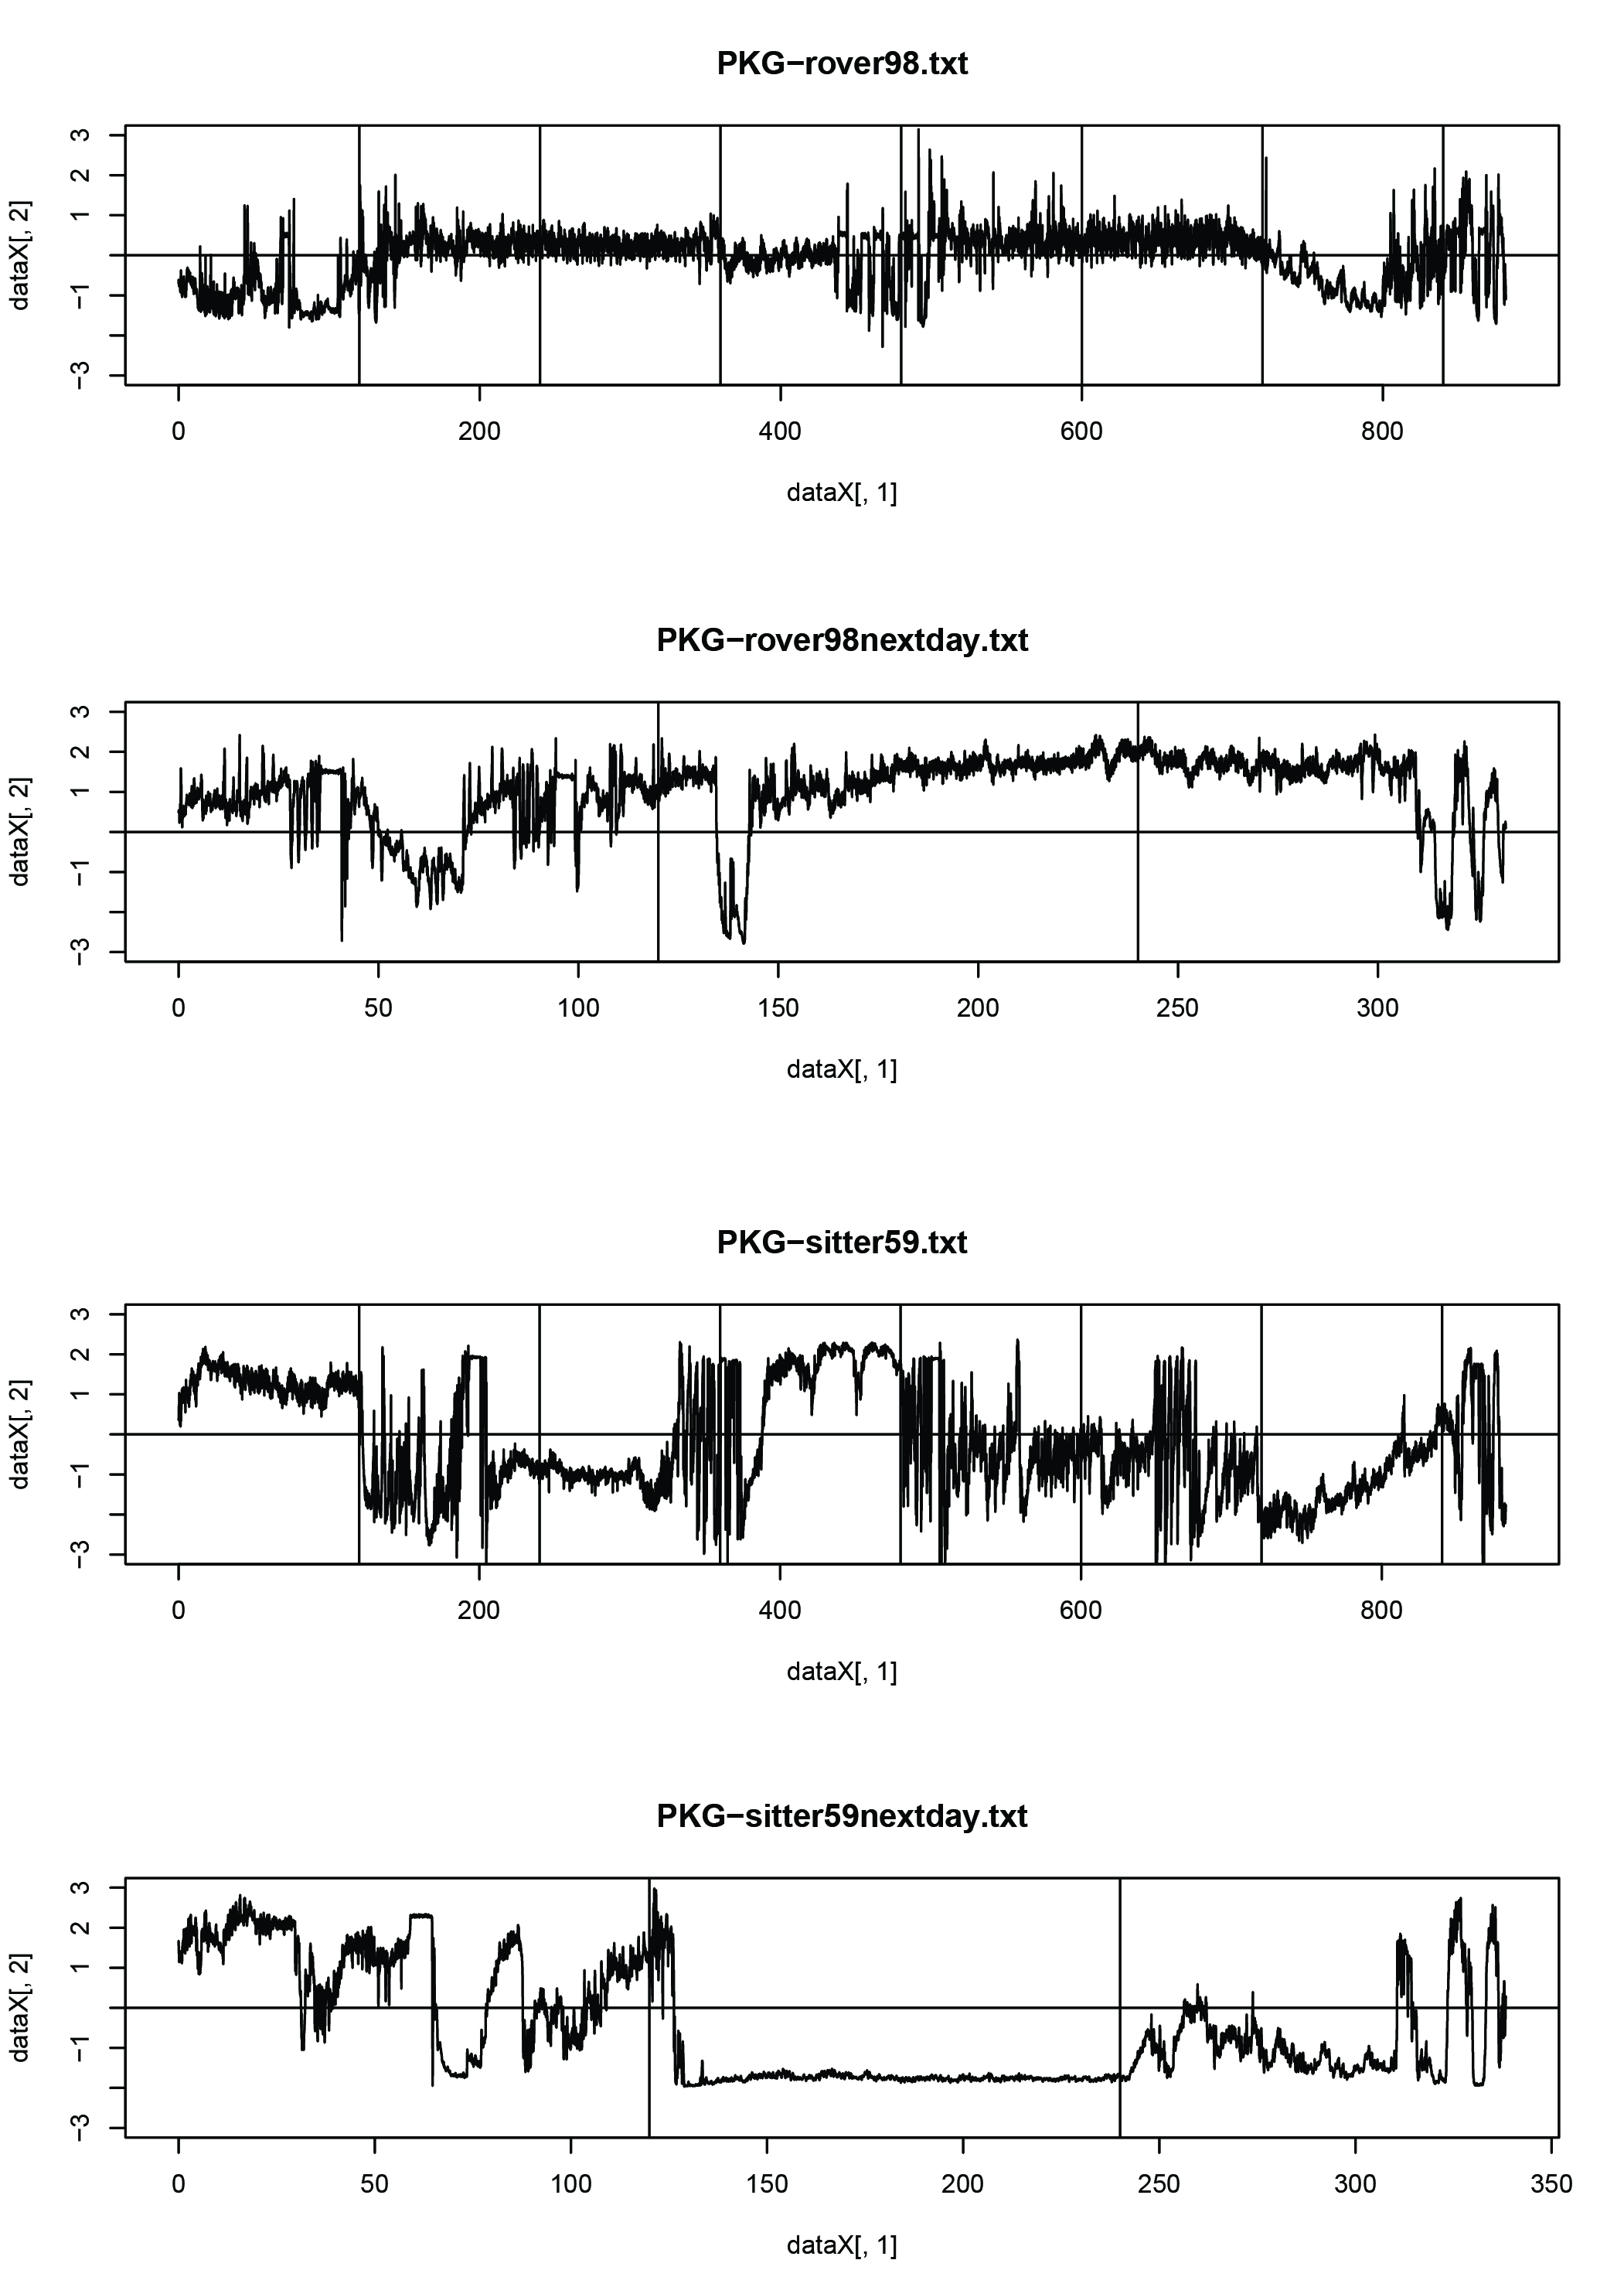
R,S self learning traces, and longterm memory trace
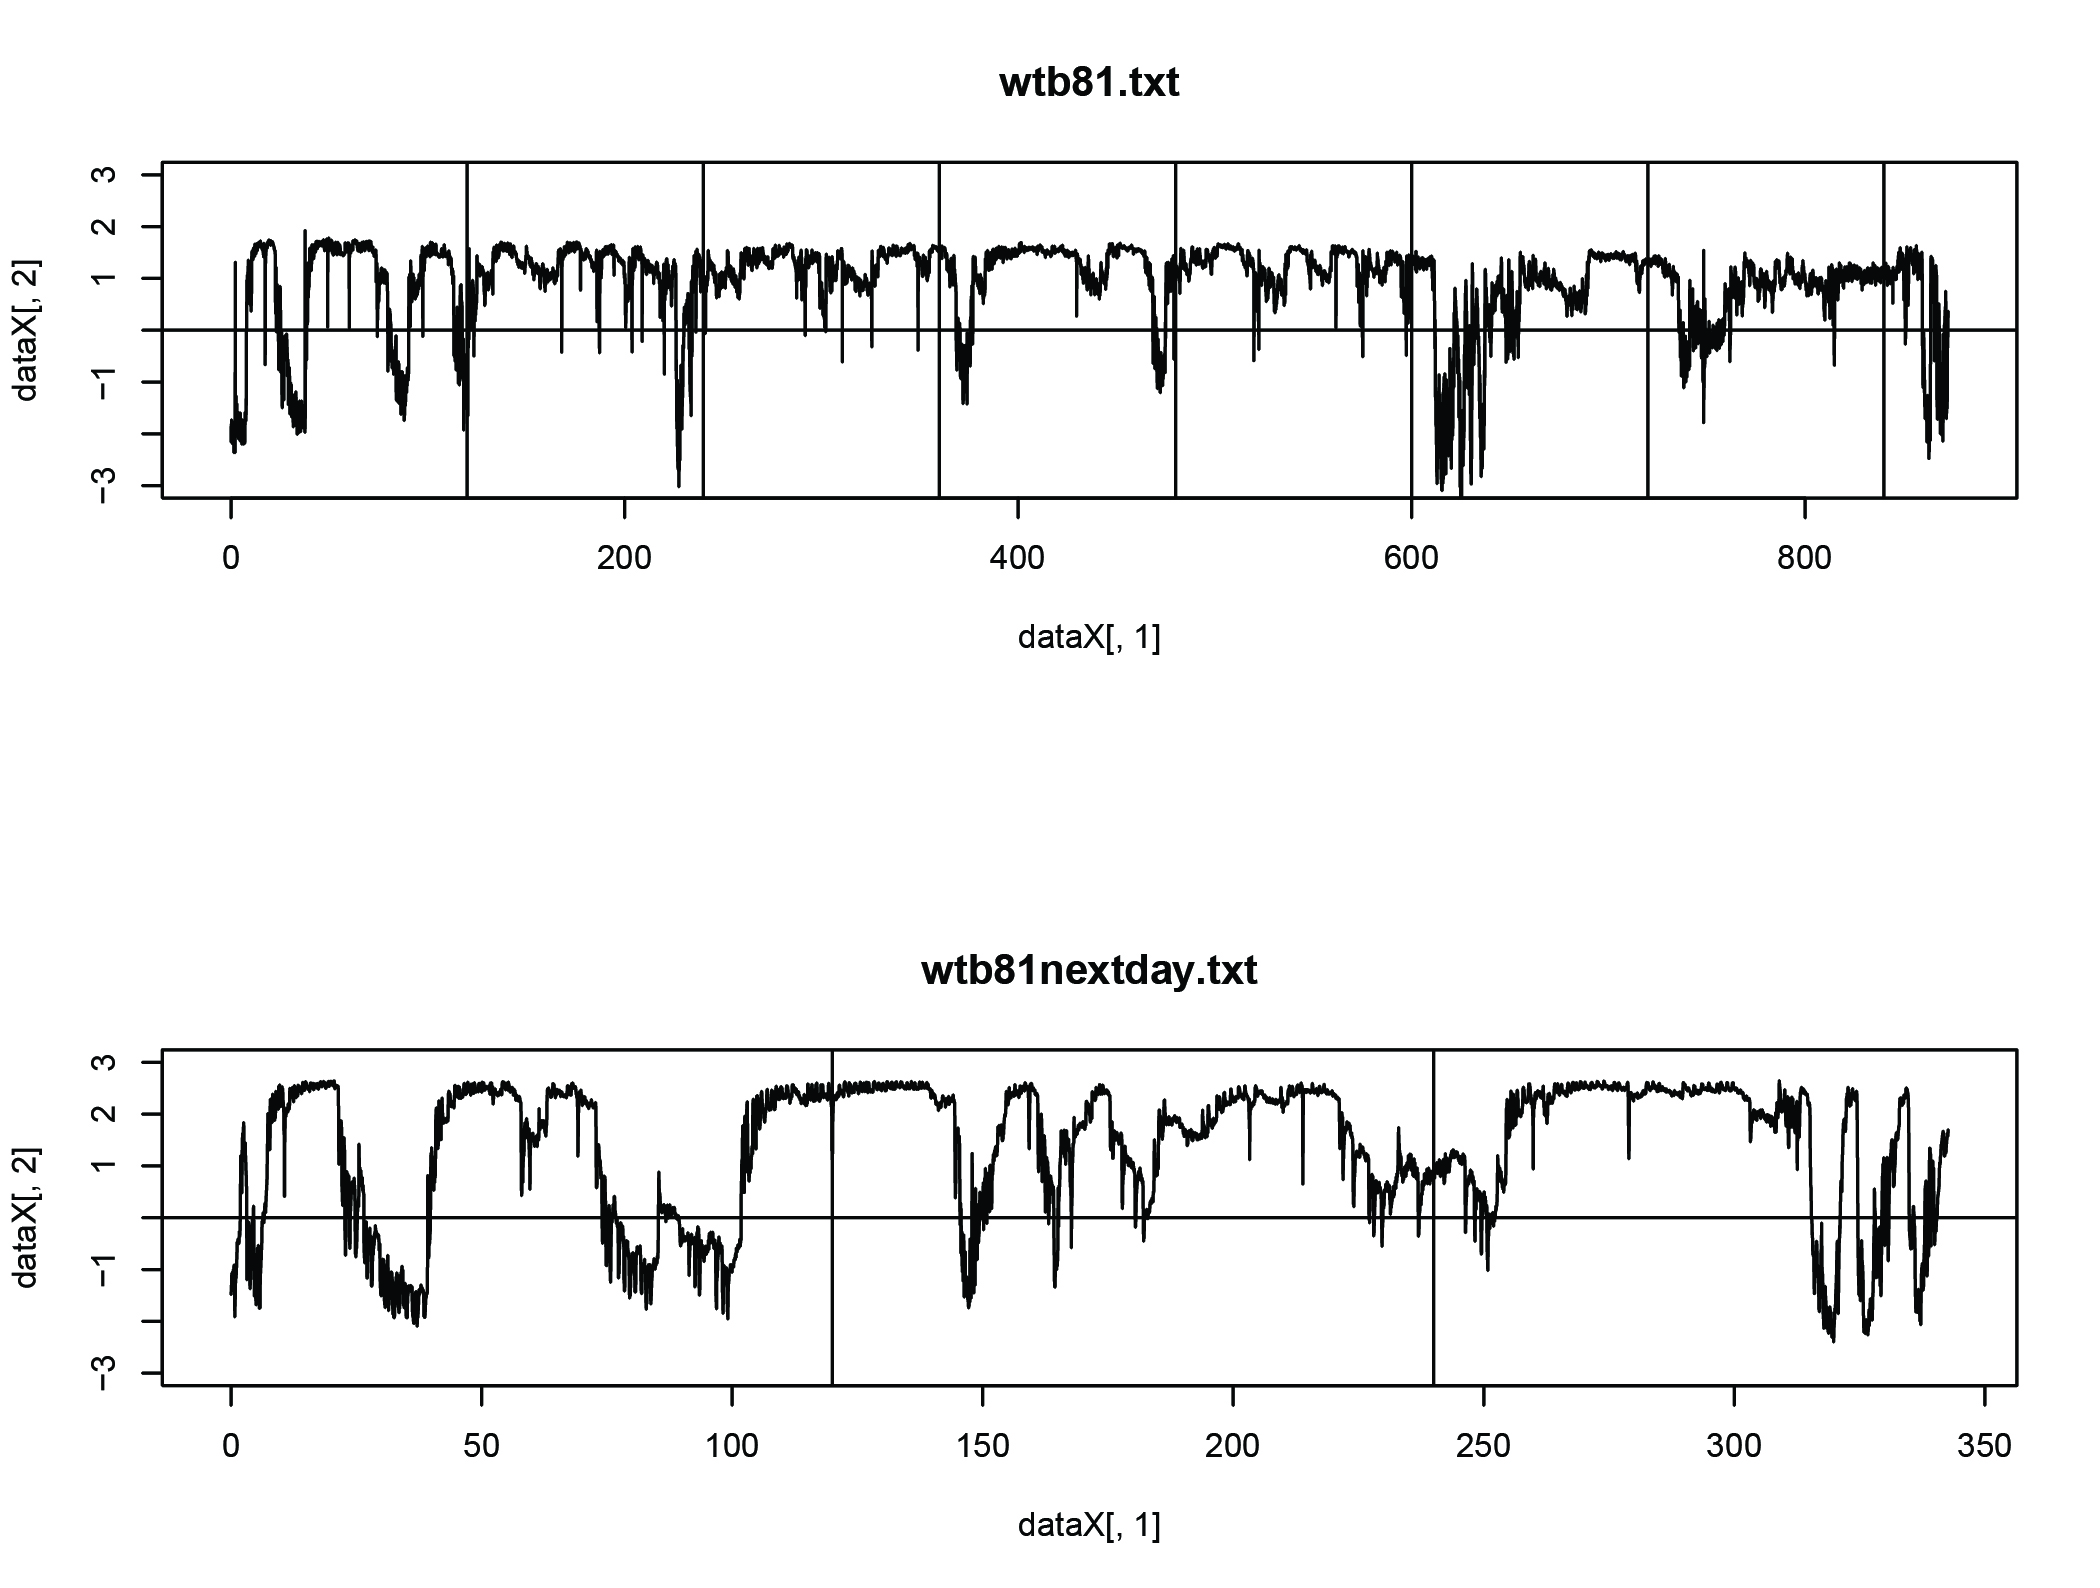
WTB self learning traces, longterm memory trace
Category: operant self-learning, Uncategorized | No Comments
update on self learning and longterm memory
on Monday, March 27th, 2017 2:07 | by Weitian Sun
5 measurements on self learning from rover:
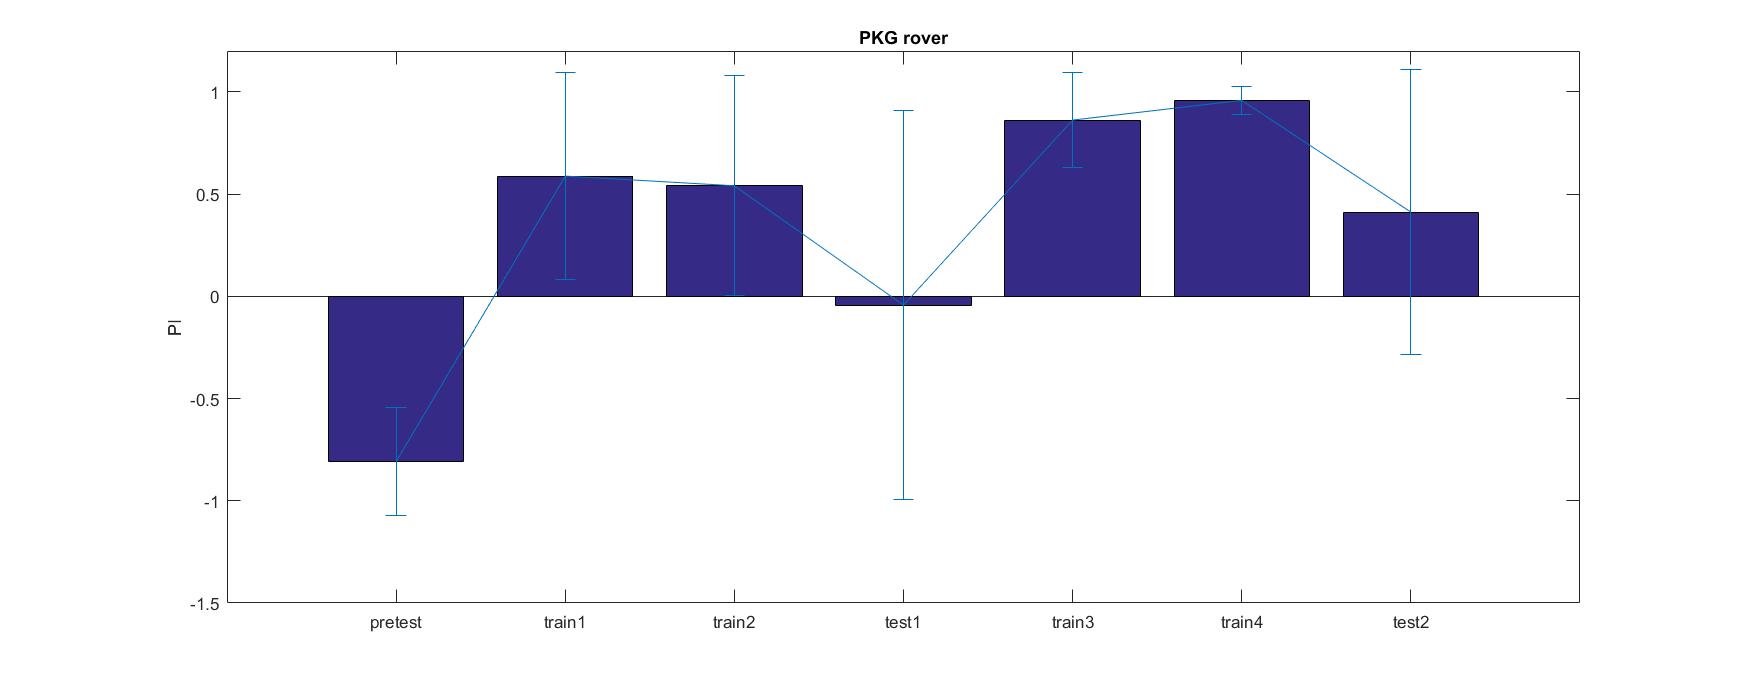
6 measurements on self learning form sitter:
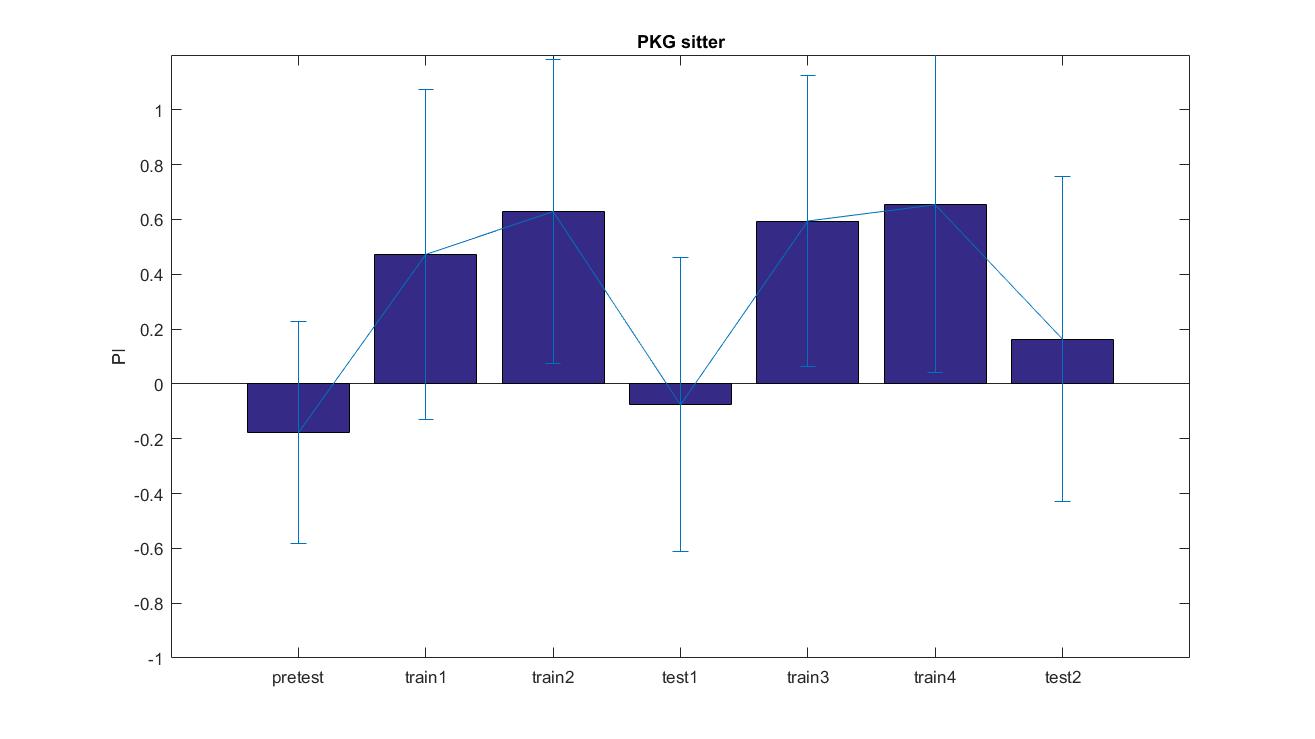
10 measurements on self learning from wtb:
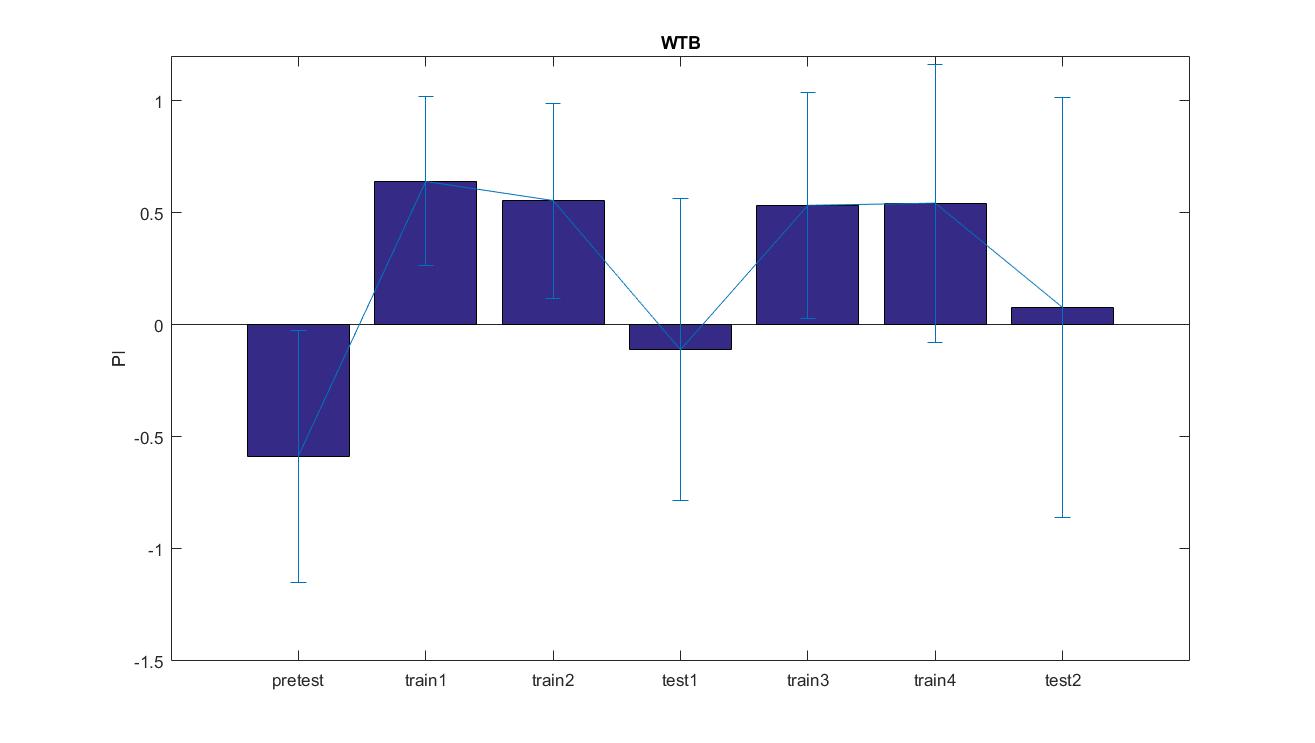
4 measrements on long term test from rover:
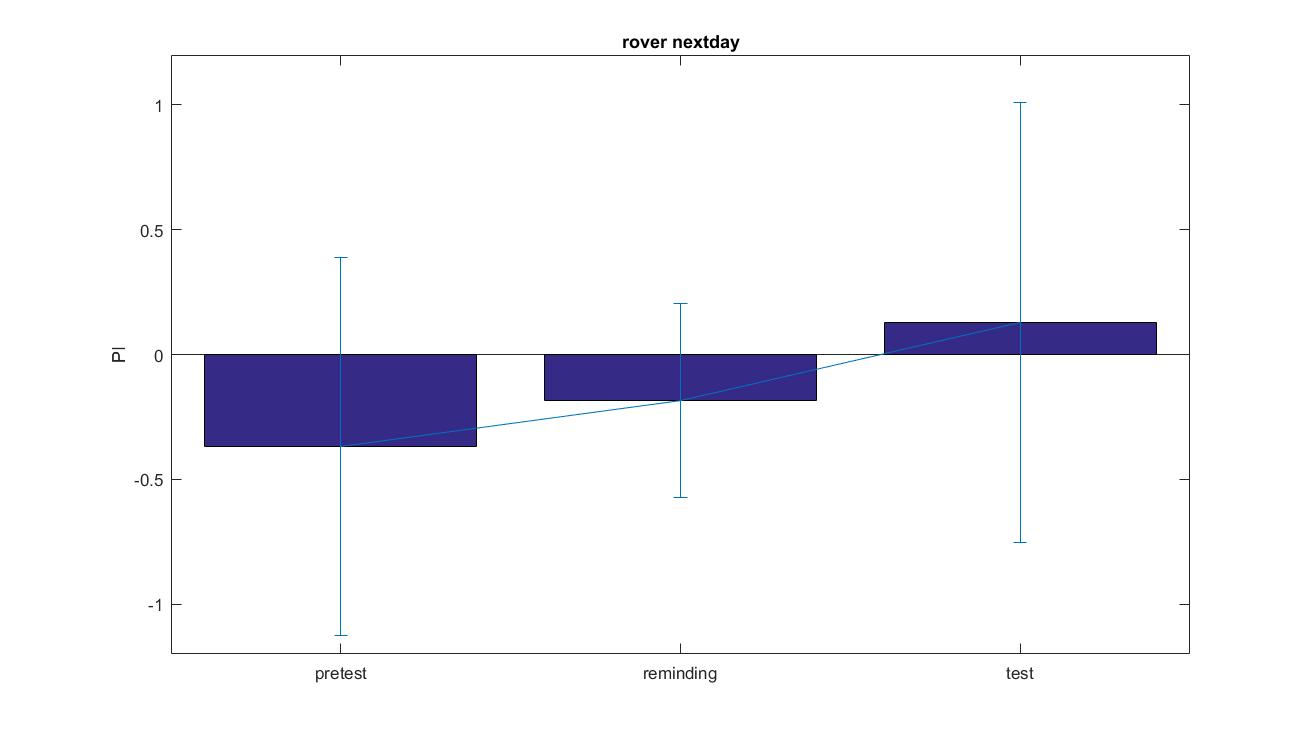
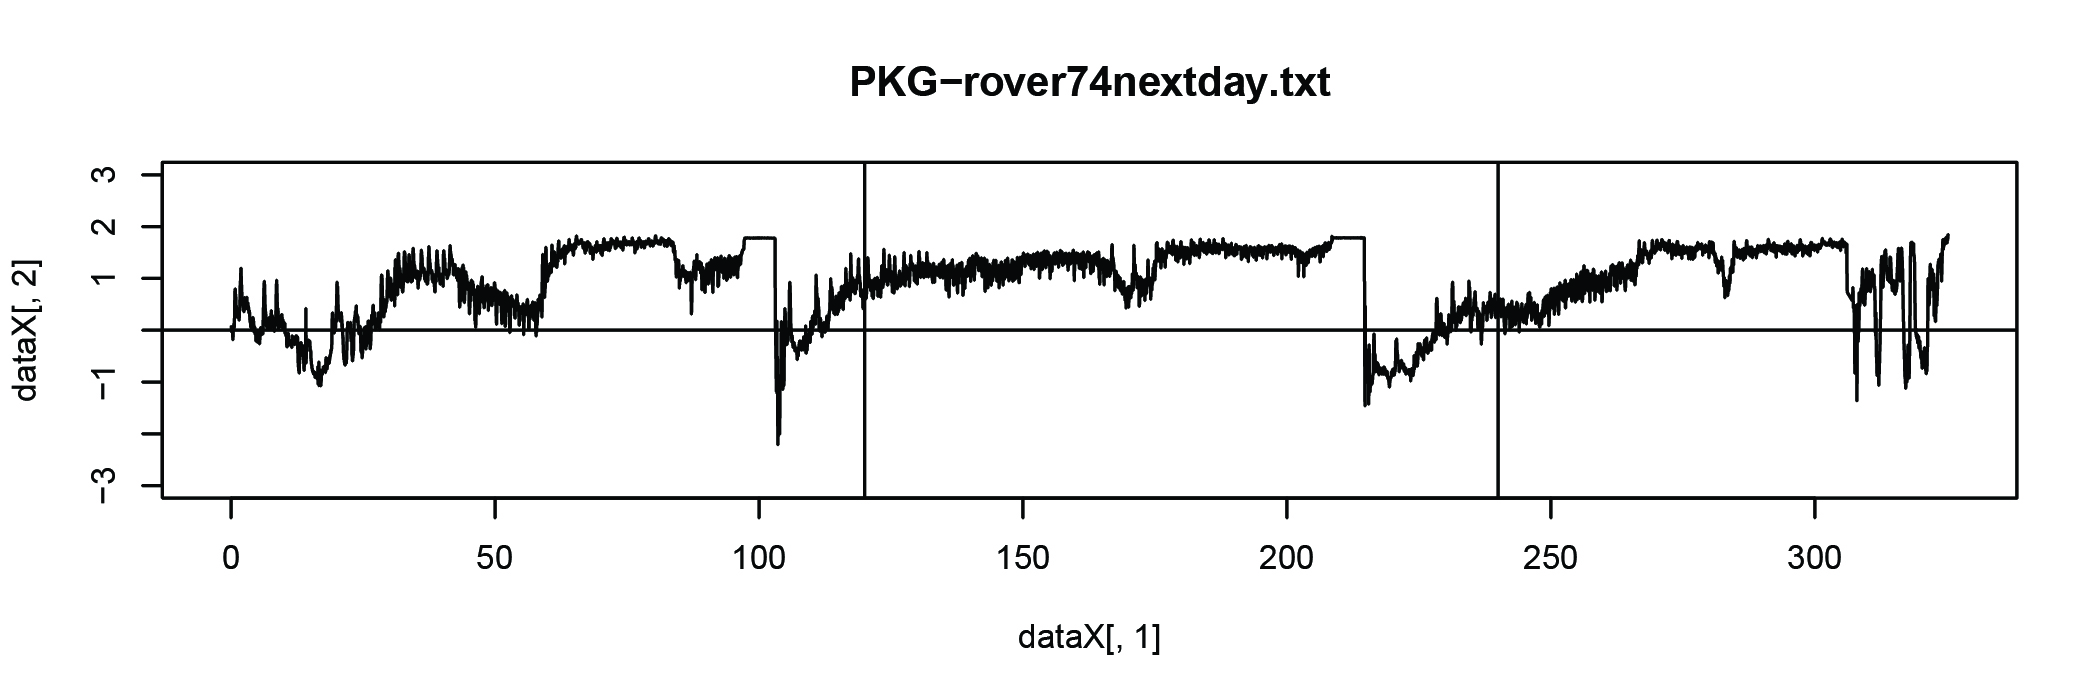 (right punishment)
3 measrements on long term test from sitter (fly stops a lot during test, this result may not be accurate):
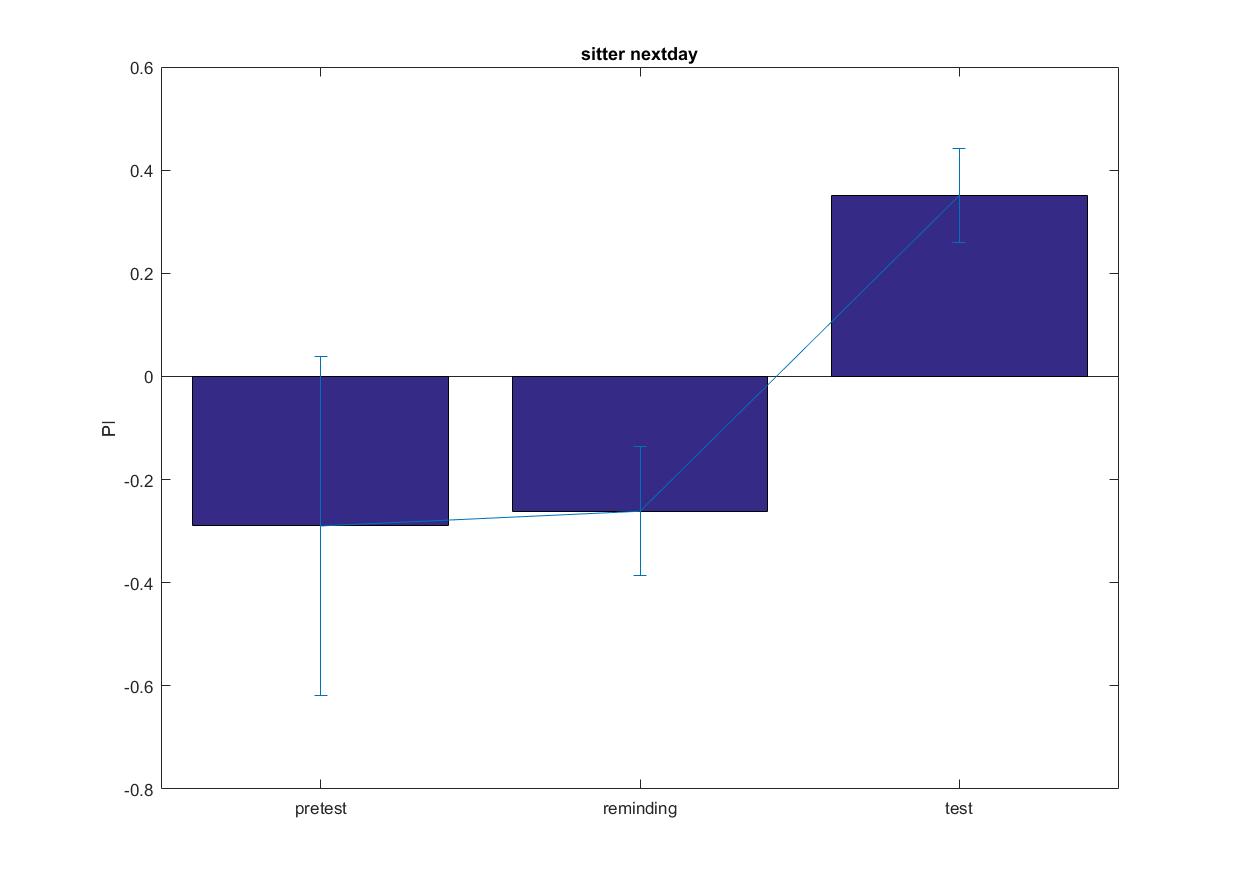
 (13:left punishment, 19: right punishment)
7 measrements on long term test from wtb
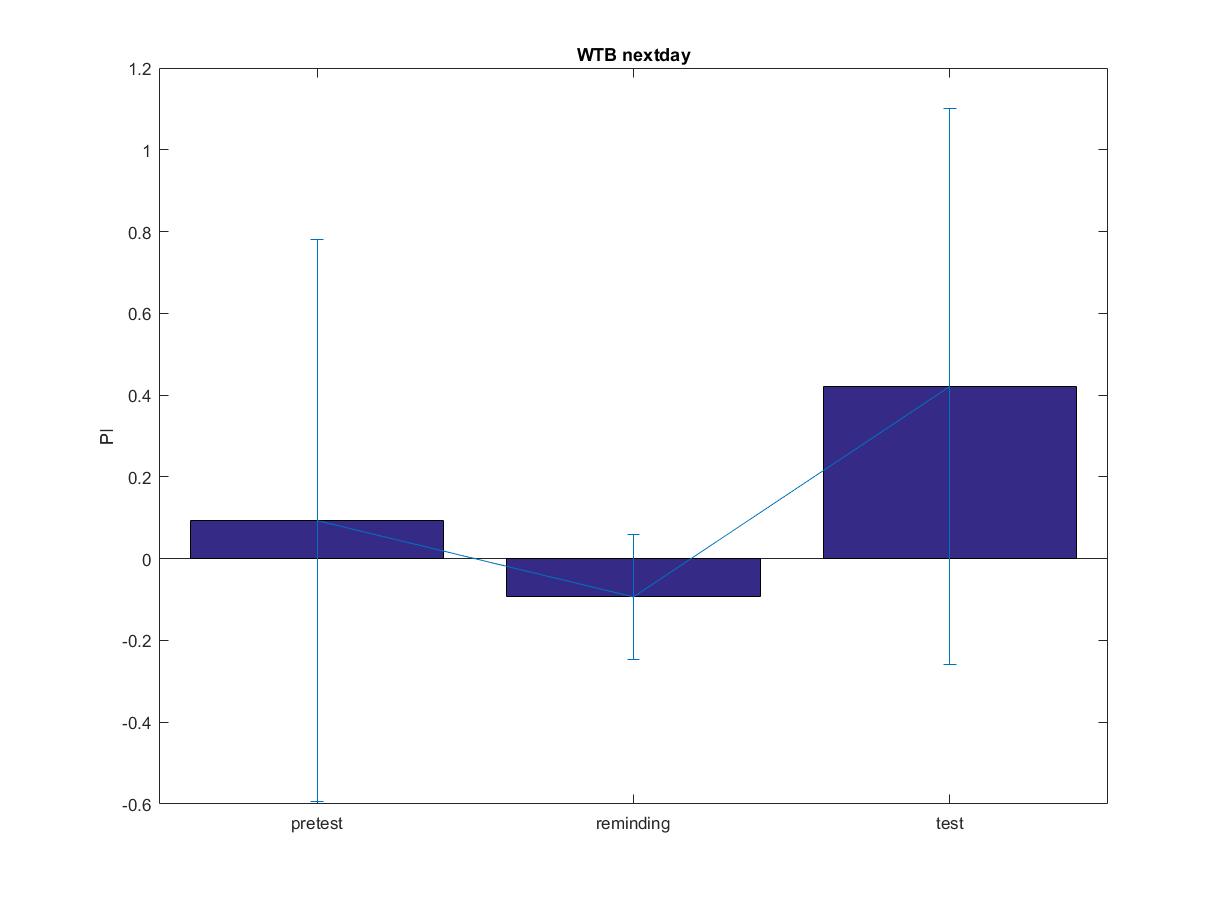
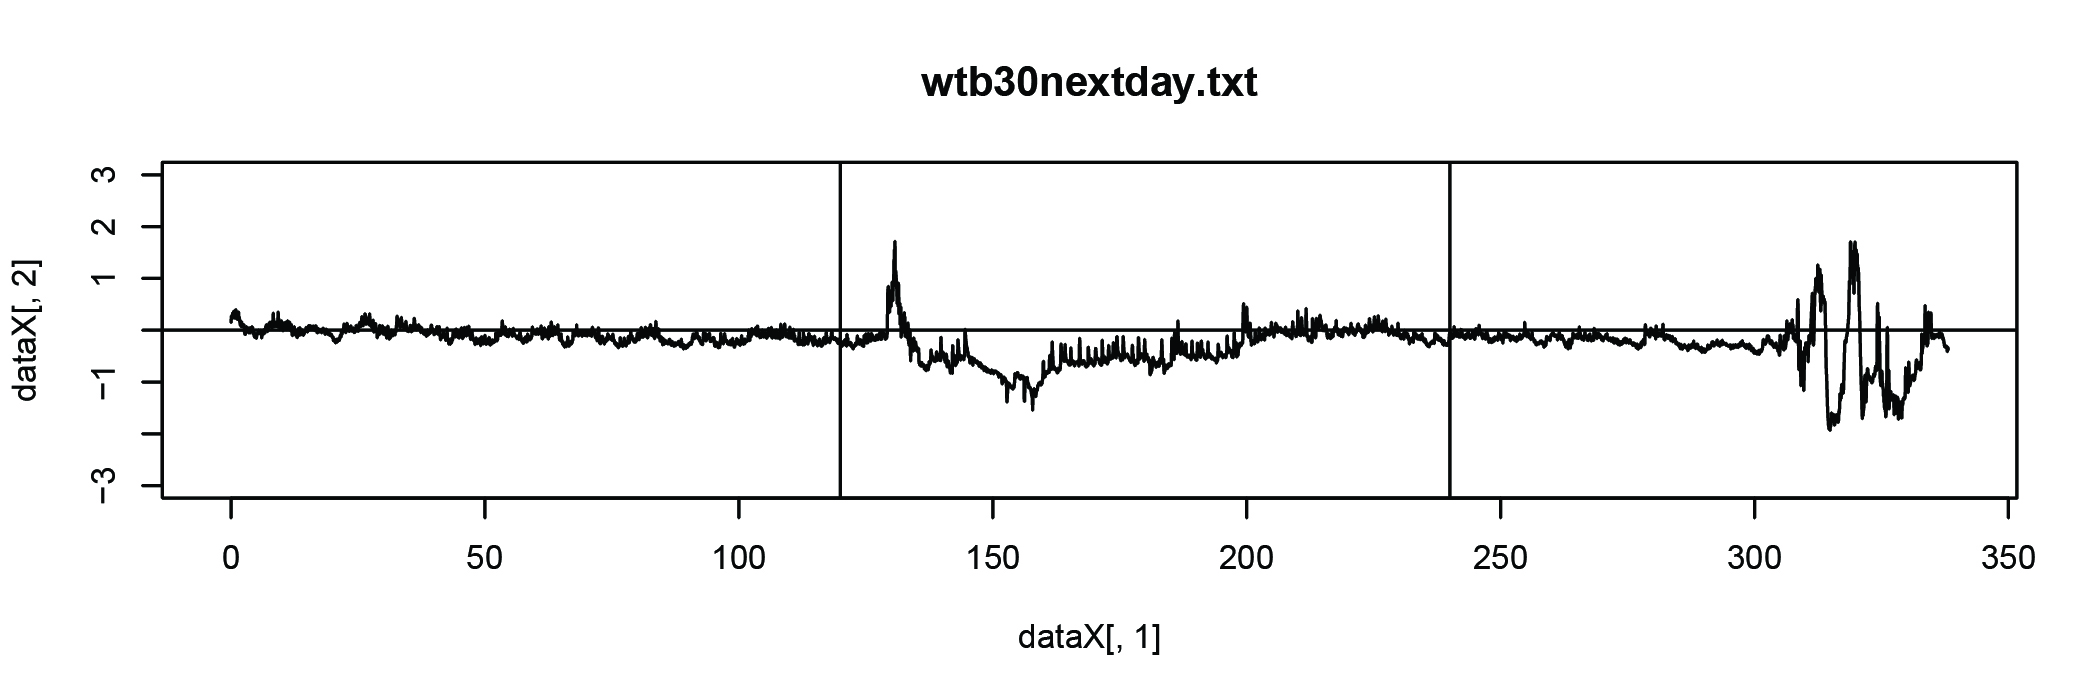 (left punishment)
Category: Operant learning, Uncategorized | No Comments
PKG rover update
on Friday, February 24th, 2017 1:48 | by Weitian Sun
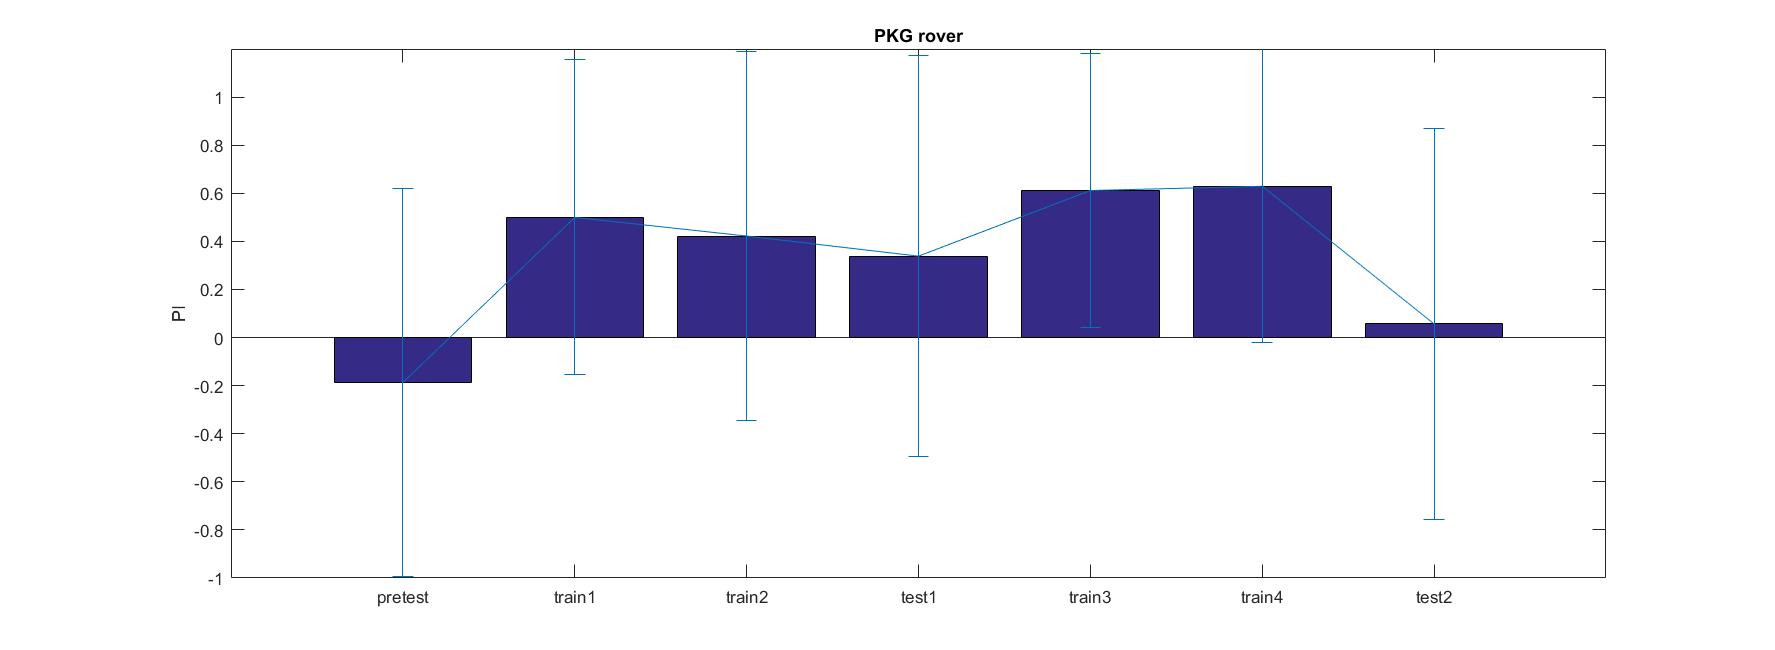
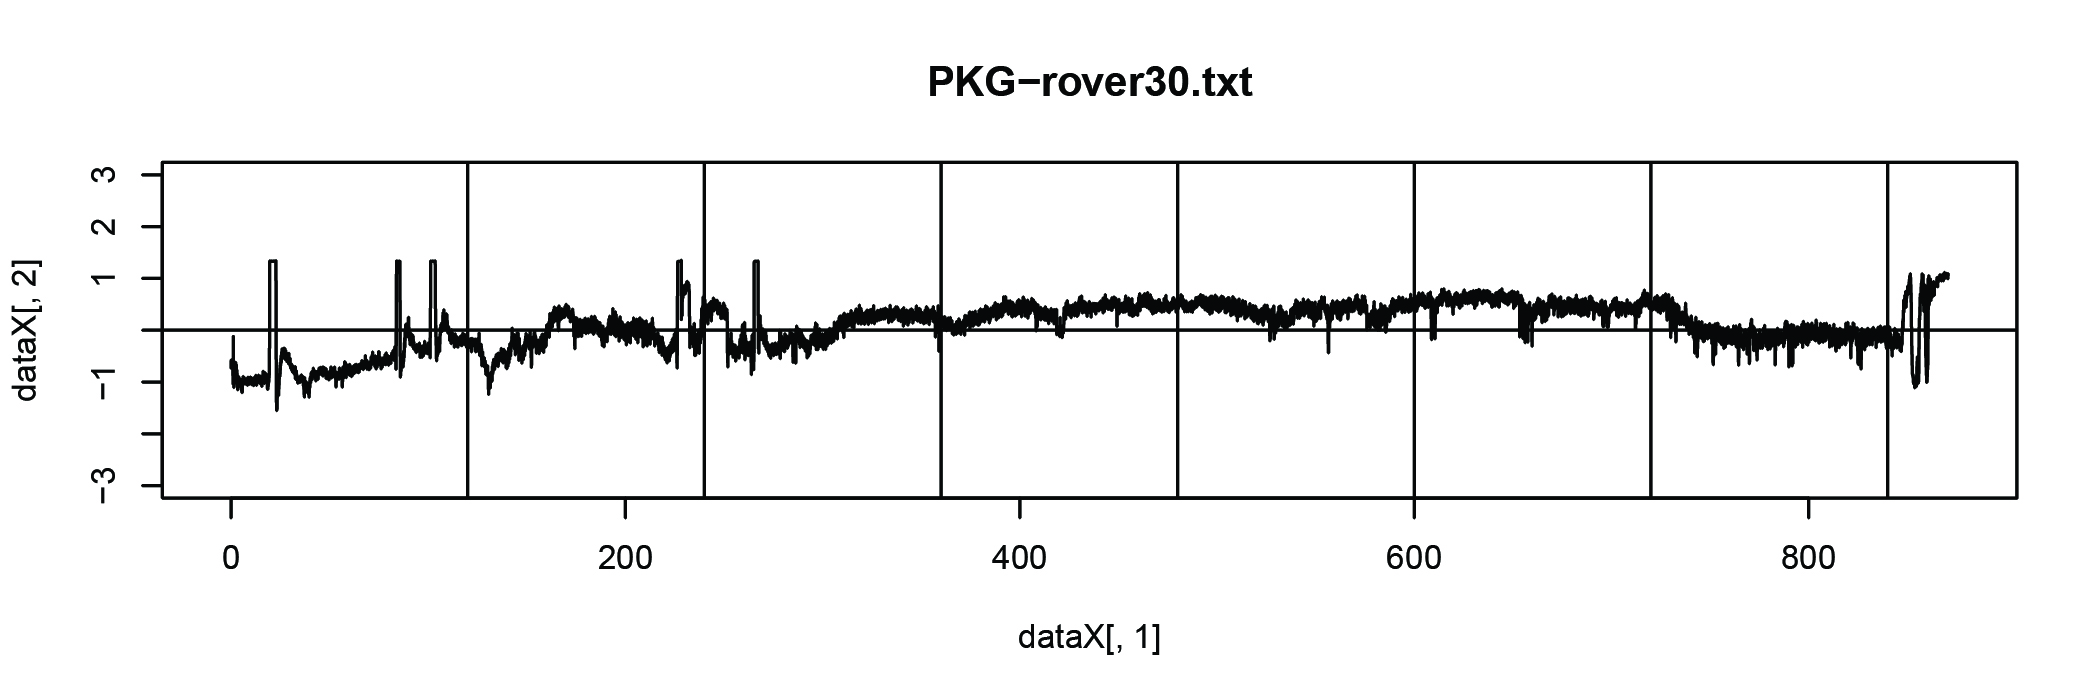
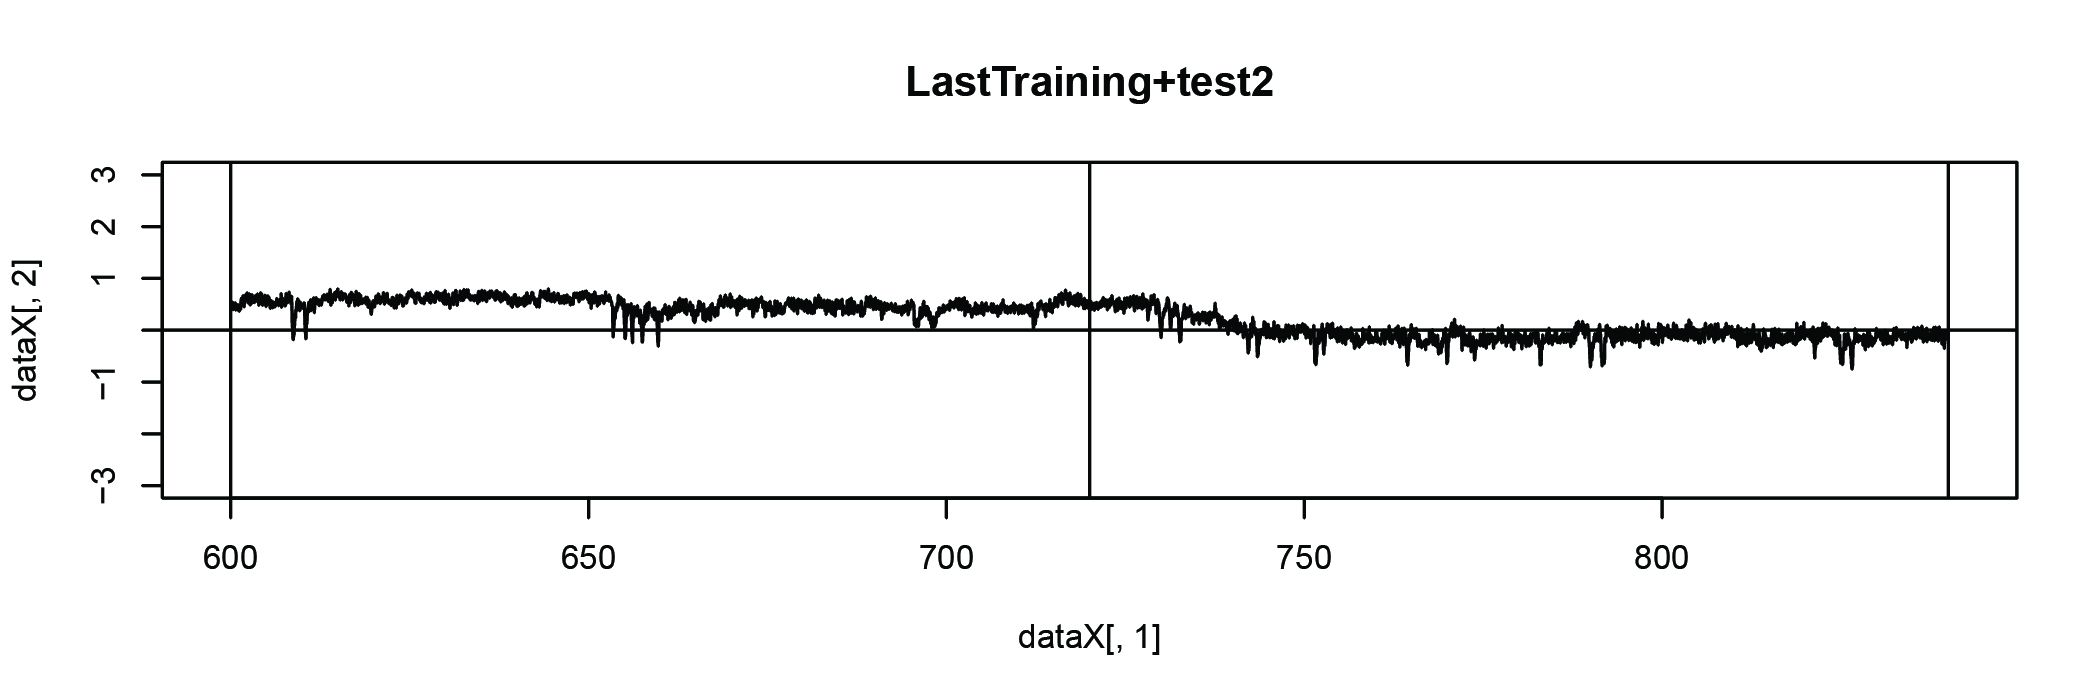
After adjusting the laser angle, PI got much improved. But, the test 2 phase shows a lower PI than test 1 in most of cases, the reason for that is still unclear. The following is the result of 9 measurements without drifting.
train1 PI: 0.50
train2: 0.42
test1: 0.39
train3:0.61
train4: 0.63
test2: 0.06 ???
Category: Uncategorized | No Comments
Sensory input and photopreference
on Monday, September 26th, 2016 1:29 | by Axel Gorostiza
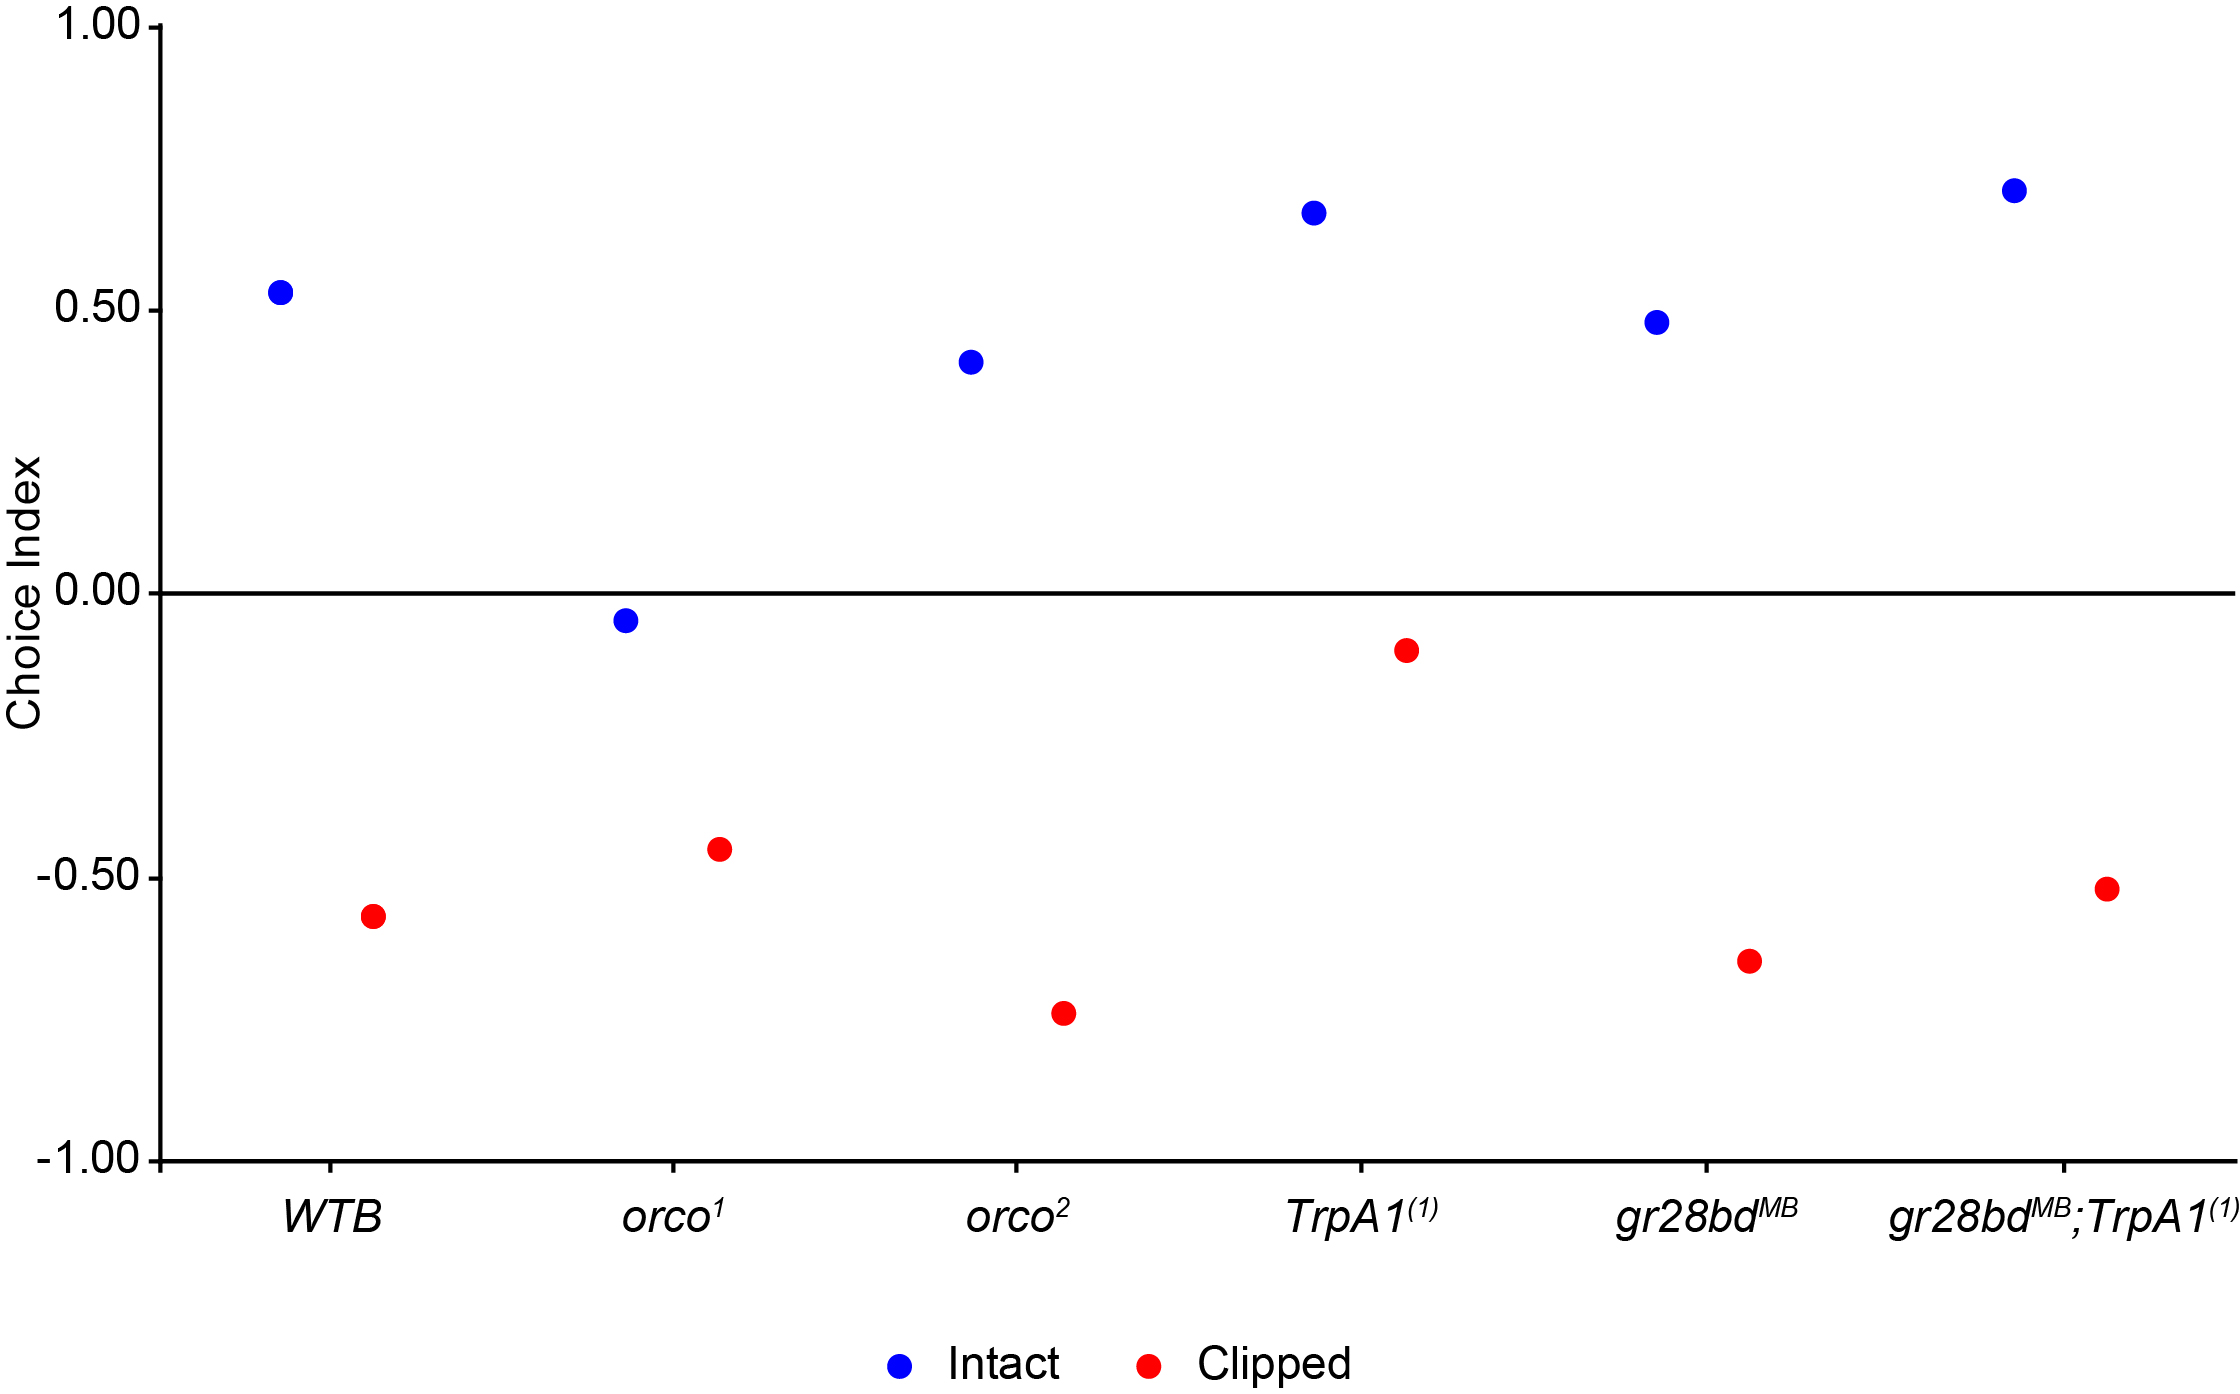
in order to test the relevance of different sensory modalities in photopreference and wing-clipping effect, I decided to test some sensory mutants. This is the result of the first experiment.
Category: Uncategorized | No Comments
Data analysis of the prediction of wingstroke amplitude with 40 datapoints.
on Monday, February 8th, 2016 11:38 | by Pablo Martinez
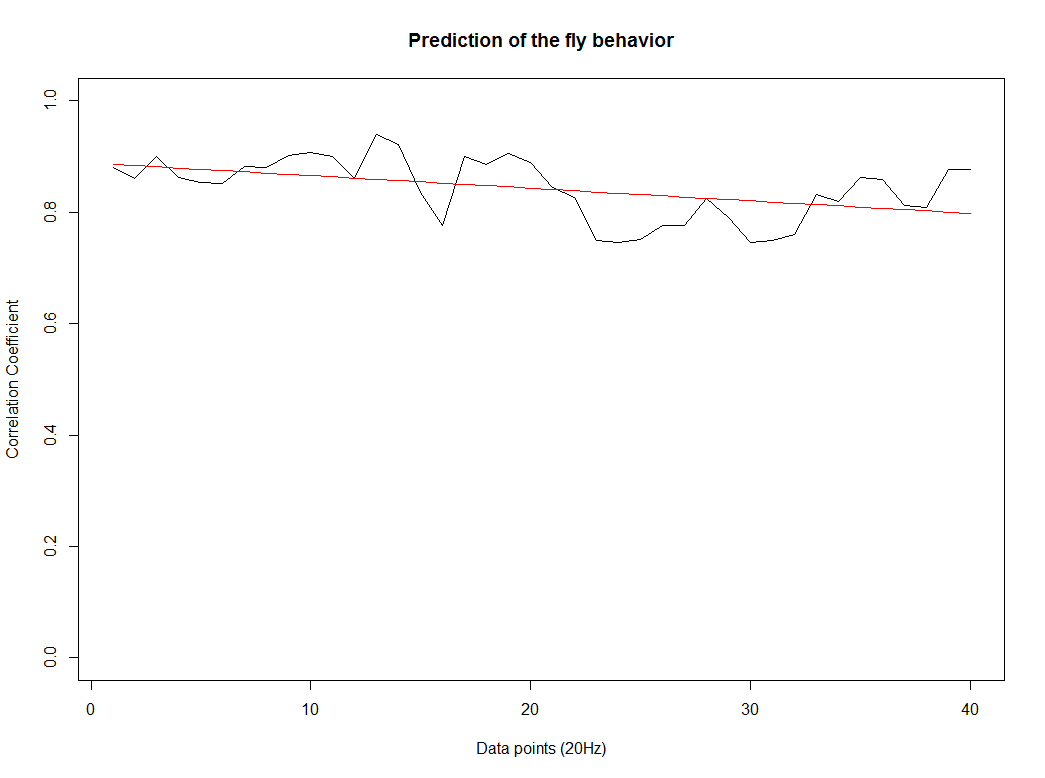
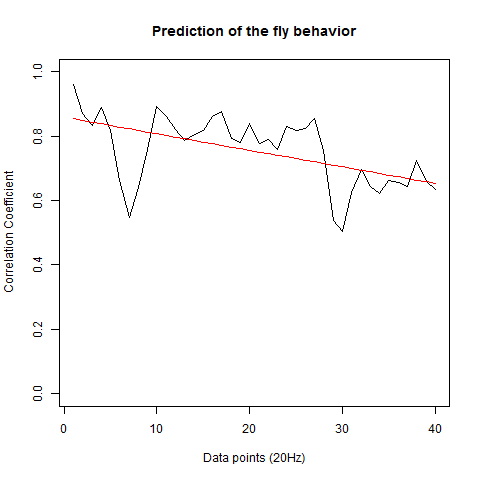
After we got the data of the behavior of the fly with strokelitude, we have made the analysis of 40 datapoints. Those datapoints were randomly picked in the middle of our dataset (10 minutes) and we made a second prediction, taking the points just before the end of the flight. For that we made a double correlation with those two predictions for each line and those are the results:
For the two control lines,
WTB x C105;;C232
UAS-TNT-E x WTB
And for the experimental line (UAS-TNT-E x C105;;C232)
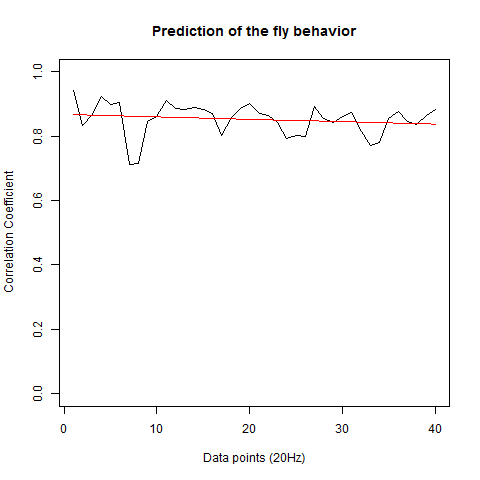
As long as the linear regresion decreases, more impredictable is the fly so its behave like non-linear function. The two controls are suposed to be more impredictable than the control line. There is more decrease in those two lines comparing to the experimental line, although is not too remarkable.
We also made an RMSE analysis, Christian explained it in his post. “RMSE measures just the differences of the absolute points whereas correlation coefficient is rather if the direction and degree of variation correlates (covariates)”
Here we have the plots:
WTB x C105;;C232(control)
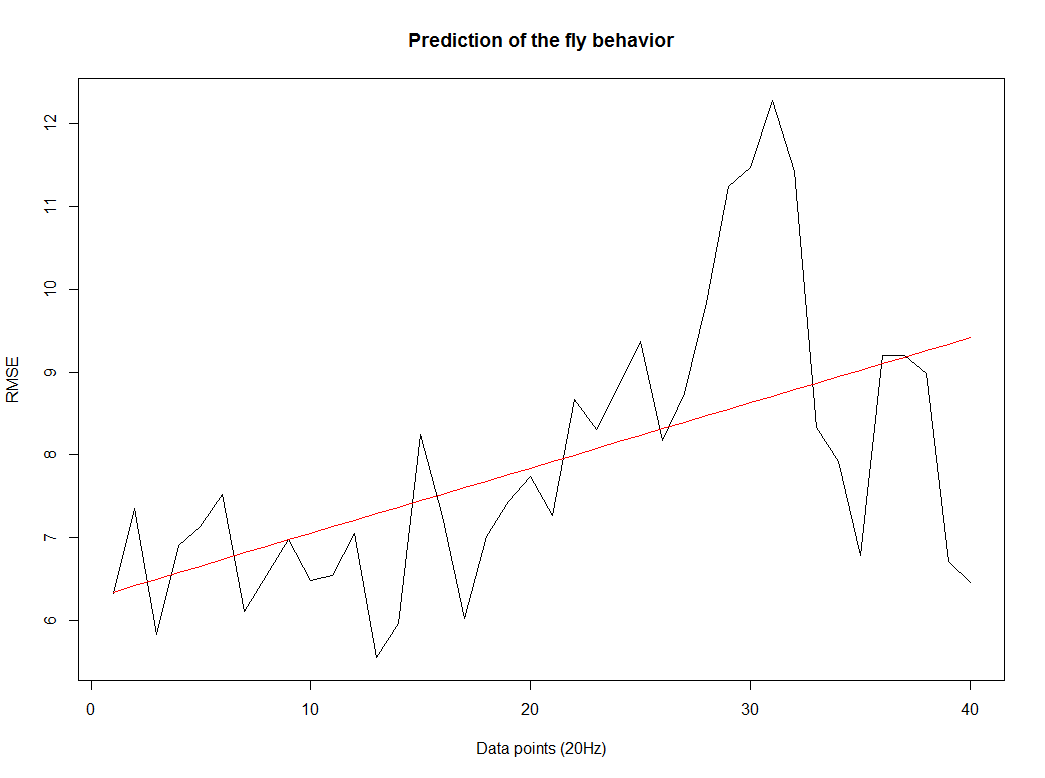
UAS-TNT-E x WTB(control)
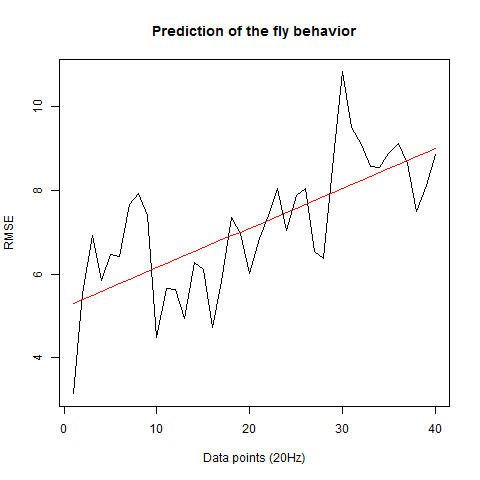
experimental line (UAS-TNT-E x C105;;C232)
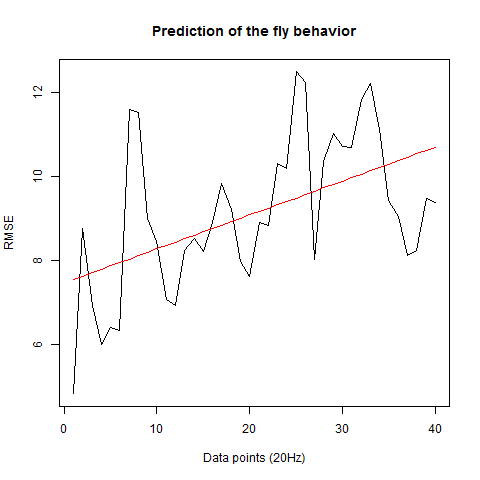
As long as the linear regresion increases, the absolute points differ from the prediction and the normal trace.
Category: Spontaneous Behavior, strokelitude, Uncategorized | No Comments
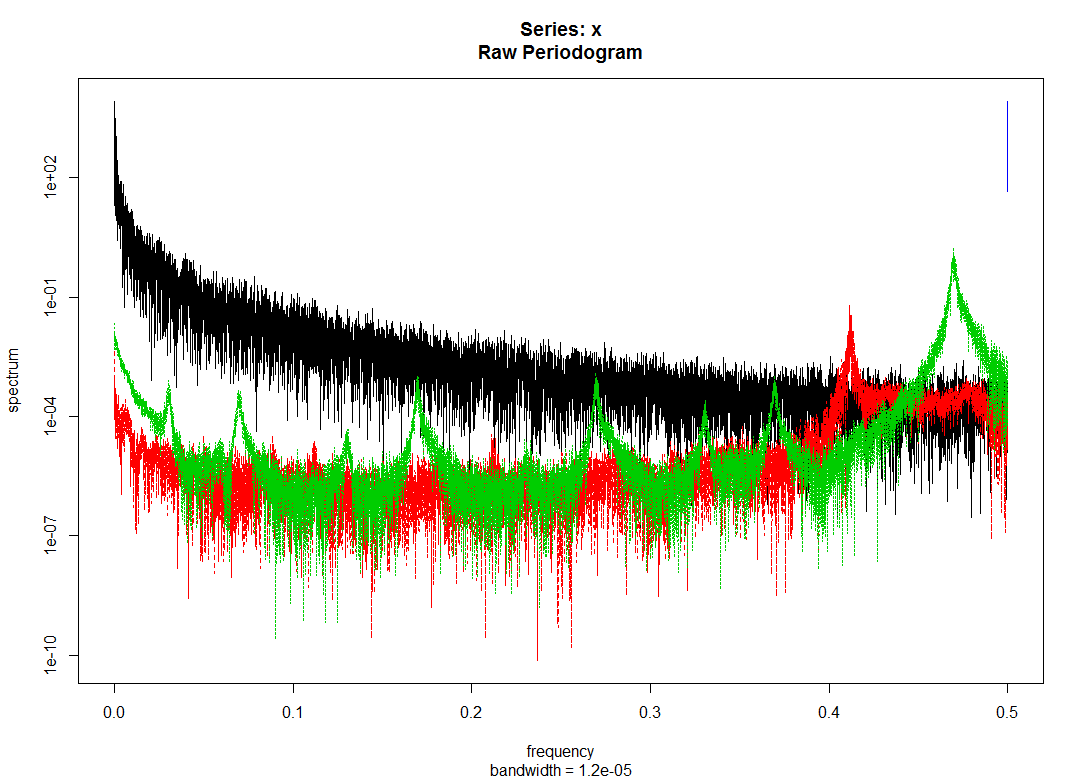
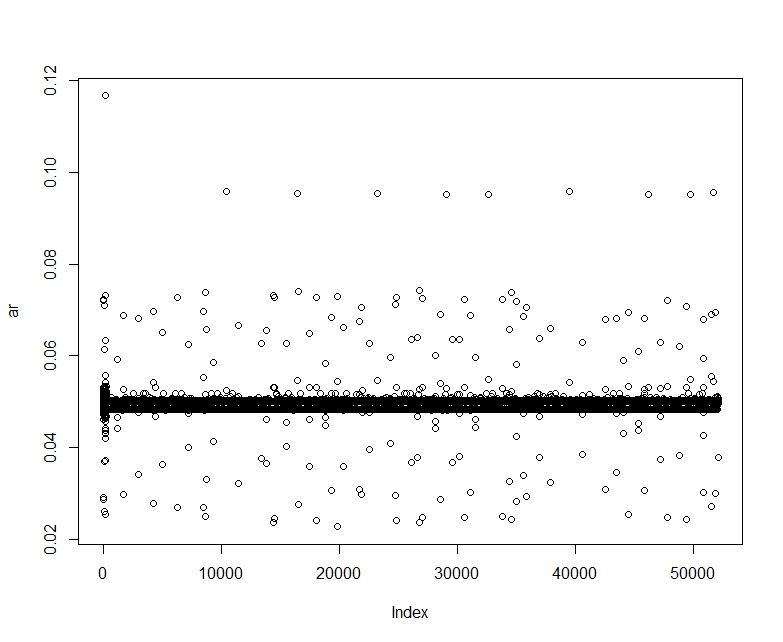
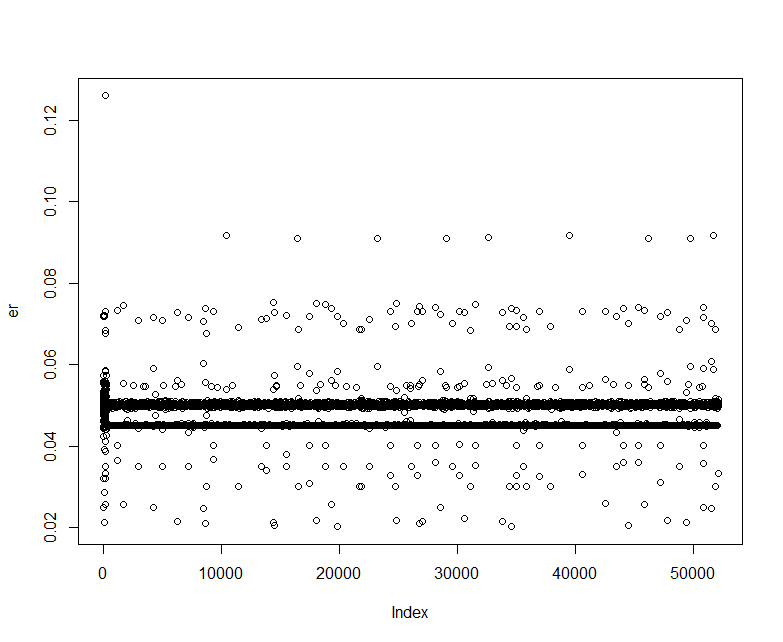
platform resonance frequency and Gaussian downsampling
on Monday, February 1st, 2016 2:16 | by Christian Rohrsen
Category: Spontaneous Behavior, Uncategorized | No Comments
Prediction analysis
on Sunday, January 17th, 2016 7:02 | by Christian Rohrsen
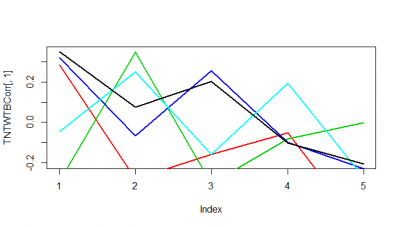
These are just 5 flies (WTBxTNT) from the strokelitude where I measured the correlation coefficient on the Y-axis. In the X-axis, first bin is from 0-2 s of prediction, second is 2-4s and so on.
It seems as if some flies do nicer than others. Although it seems to me that a correlation coefficient from 0.3 isnt a big thing with all this variability. I have to find out the best binning though, I think it needs to be much more in the short term.
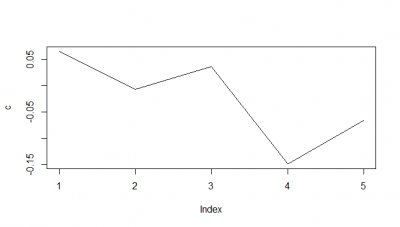
When I do the mean of the 5 flies measured, I do see a very slight decay. But once more I would say the decay is from the bin 1 to the second.
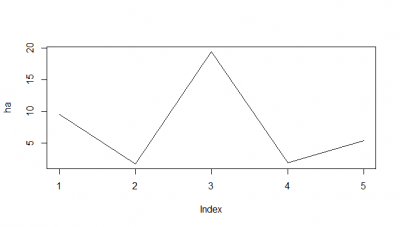
Here I tried another way, the RMSE, which according to literature and to my own reasoning should be a better analysis. I think RMSE measures just the differences of the absolute points whereas correlation coefficient is rather if the direction and degree of variation correlates (covariates). I find a very weird result. The fit is bad, the it gets better (but it should be just a chance event because correl coef decreases) and then it get very bad and so on.
I think for the future I have to make ensembles of two k neighbours maybe, which seem to increase the prediction power 10-15%. And maybe not look that much into the future as it was done here (10s).
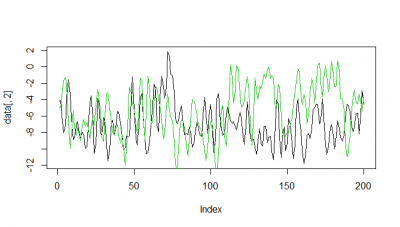
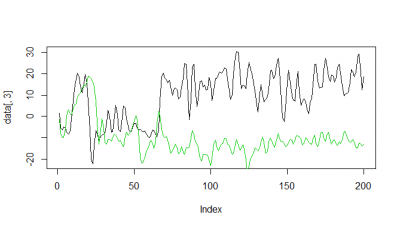
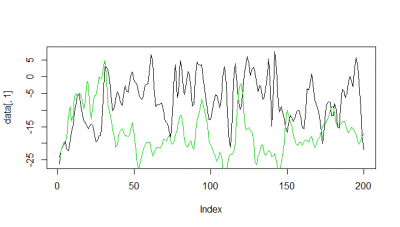
Here some examples of predictions vs observations:
Category: R code, Spontaneous Behavior, strokelitude, Uncategorized, WingStroke | 1 Comment
T-Maze problems
on Monday, December 7th, 2015 2:25 | by Axel Gorostiza
I am trying to spot source of the current behavioral problem we are having. I tested some crosses that I know how they behave. I did the crosses in both directions and tested to different lights sources (cold and warm) at 25°C.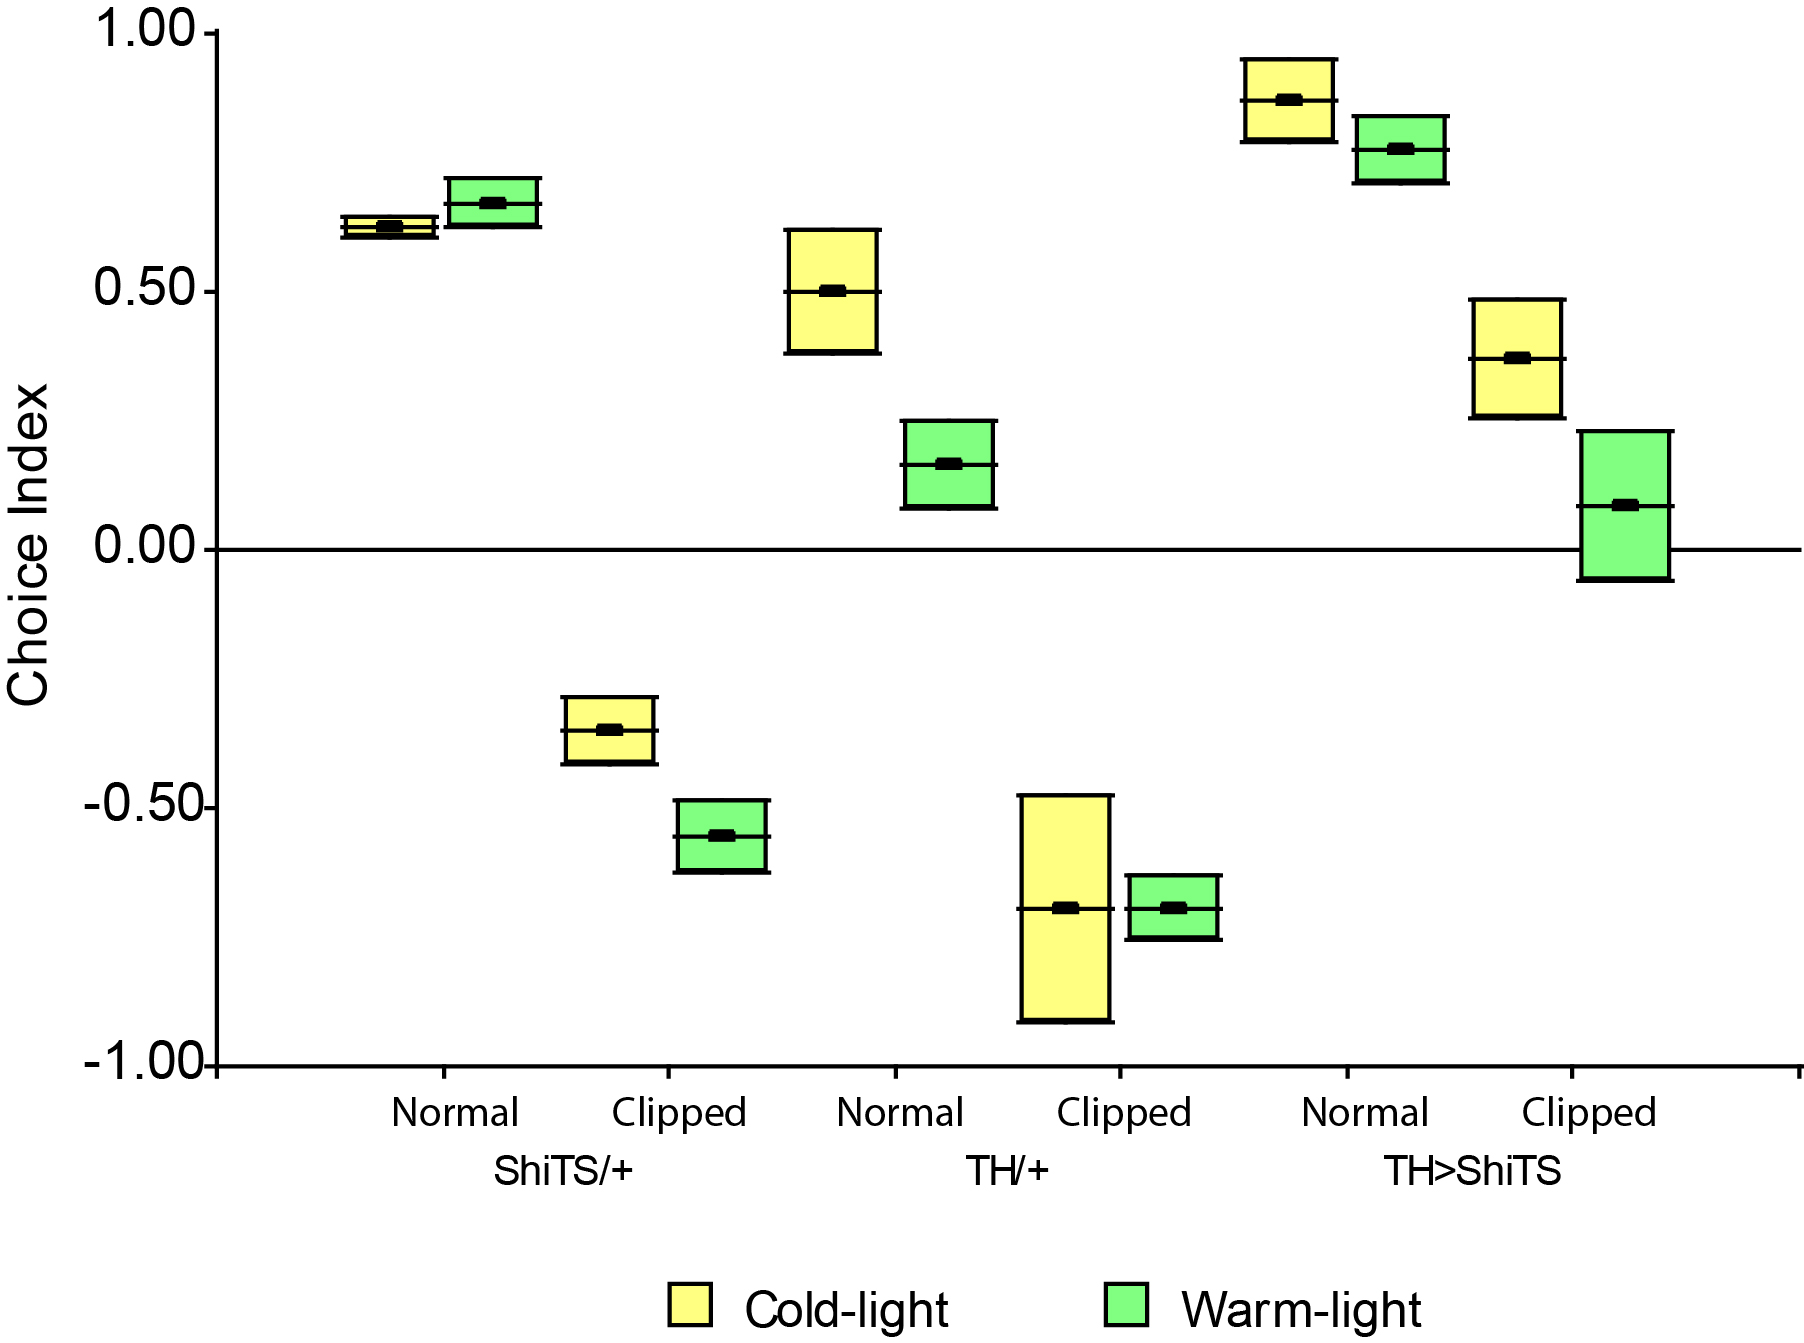
Category: Uncategorized | No Comments
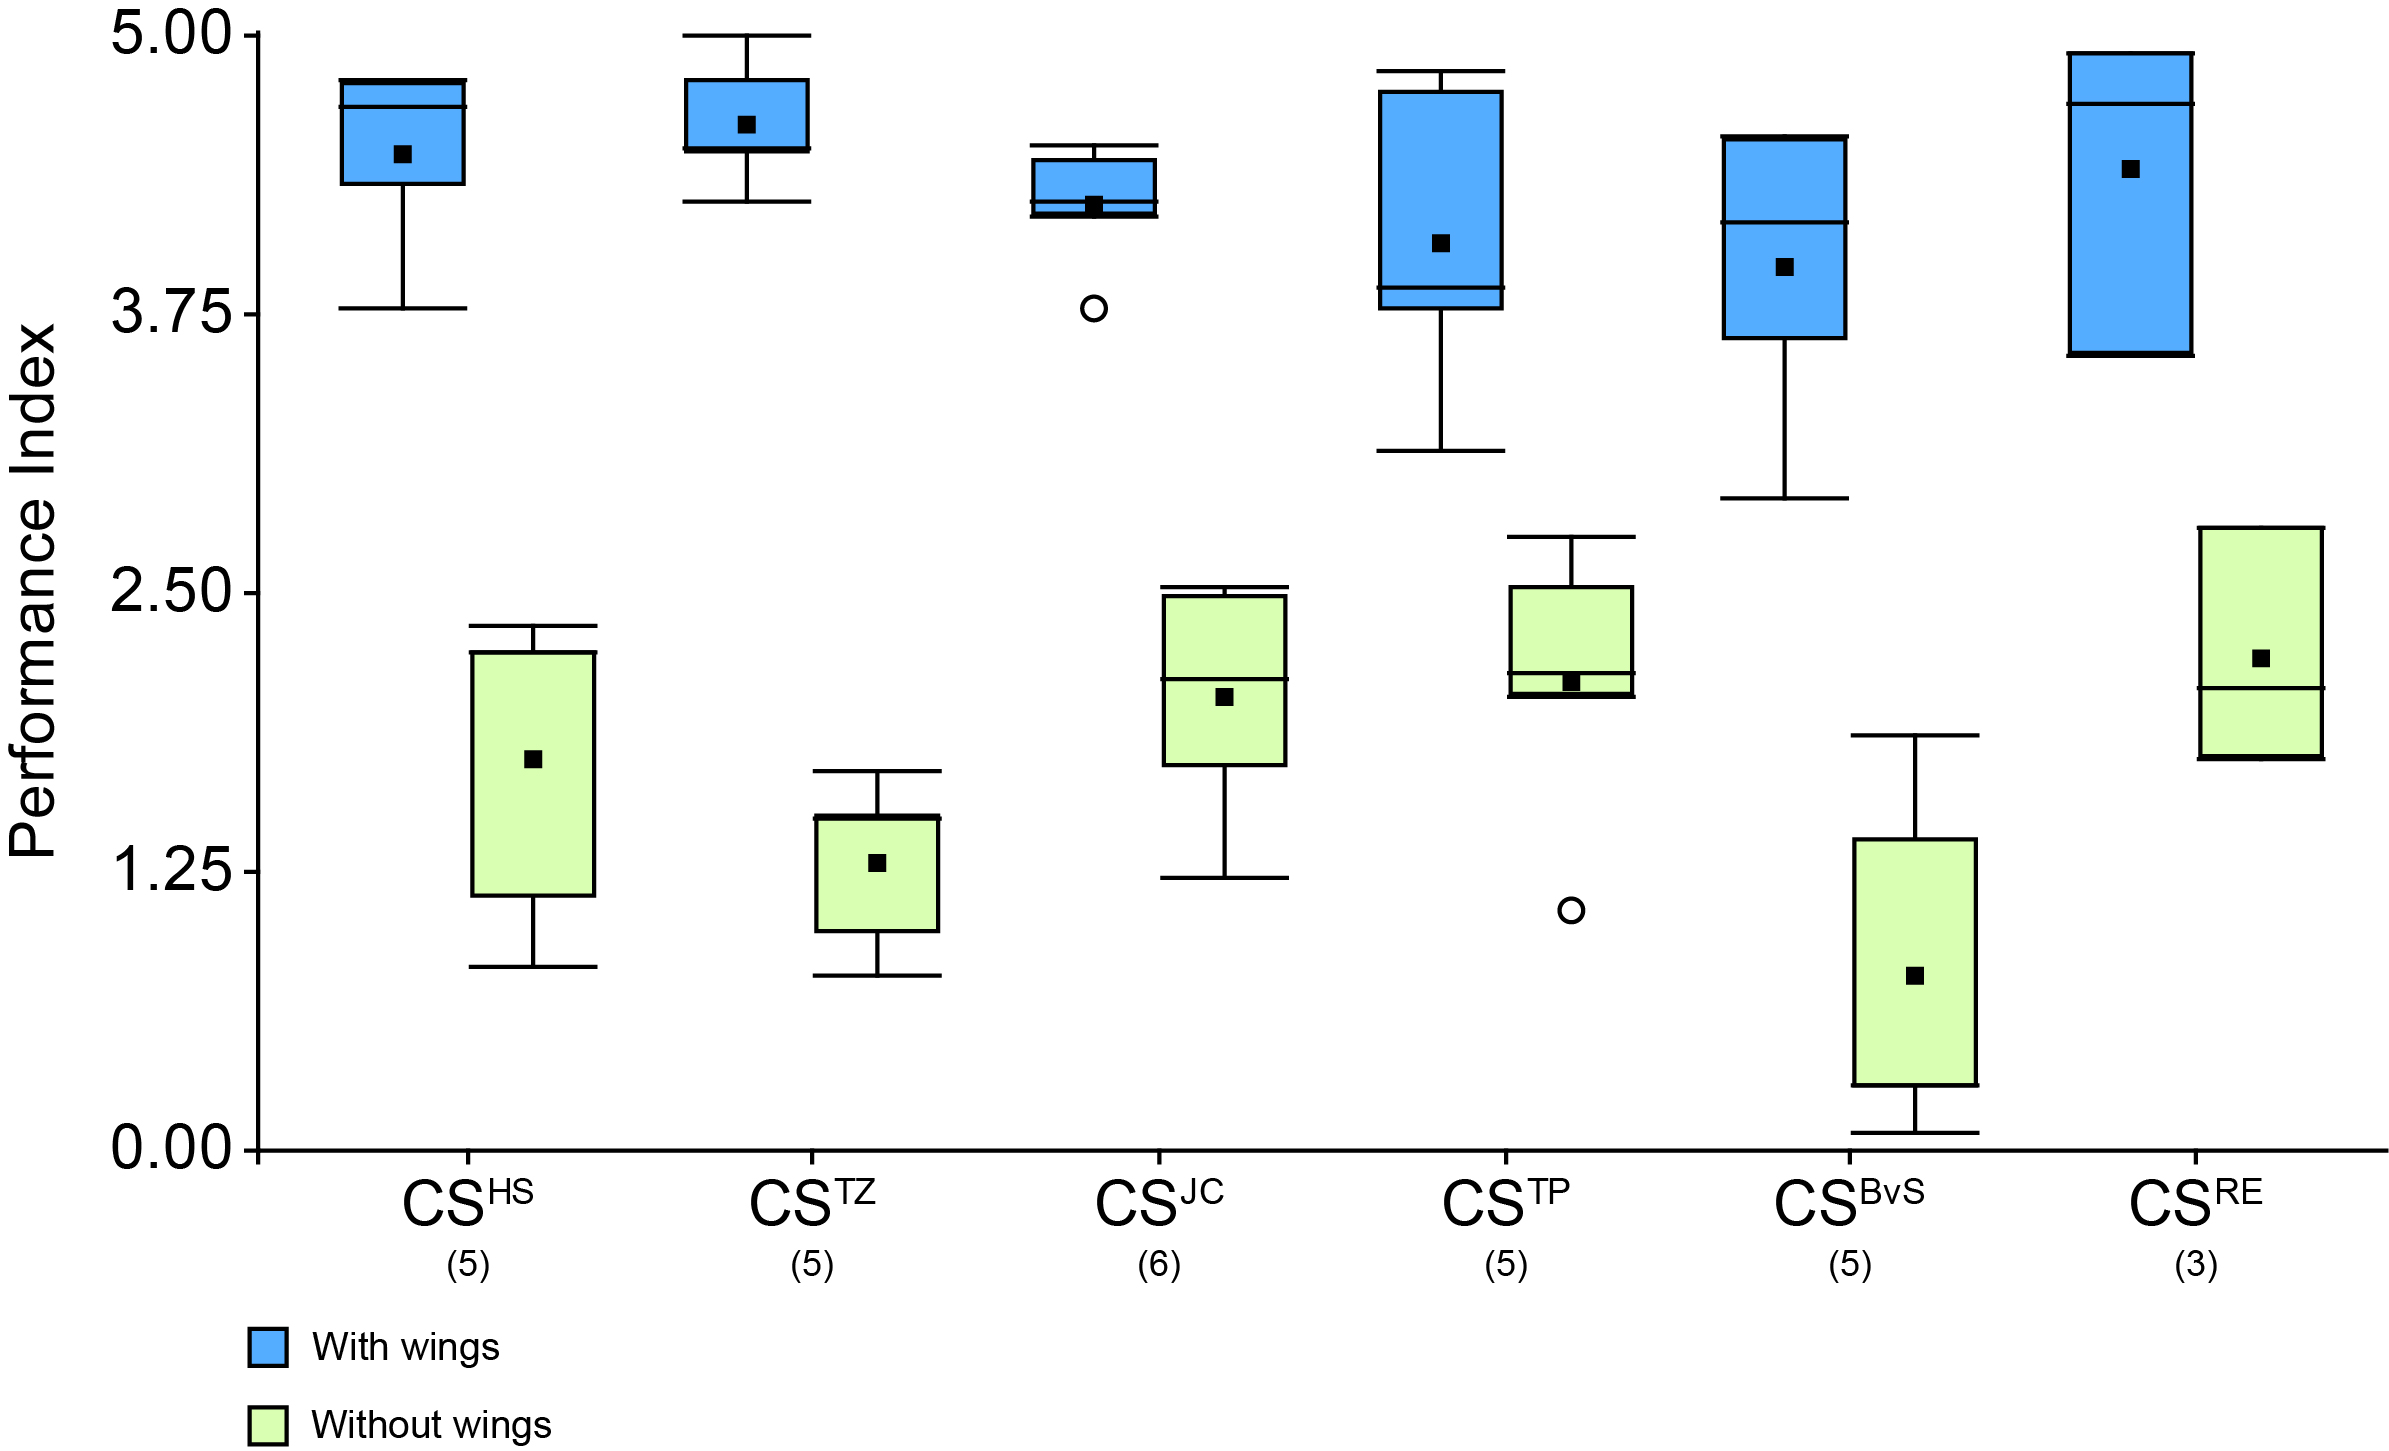
CS substrains in phototaxis
on Monday, August 3rd, 2015 2:58 | by Axel Gorostiza
I started testing the different CS substrains that we have here (CS from the paper https://f1000research.com/articles/3-176/v1 + CS Regensburg). I’ve decided to start with Benzer Paradigm. This is what I have so far.
Updated:
Category: Uncategorized | No Comments