looks good, hope to confirm that in the following two weeks
on Monday, March 25th, 2013 11:51 | by Julien Colomb
https://figshare.com/preview/_preview/658786
It would be great to have some physiolgy data (electrophy) to have a guess about the effect of the PKC in the motorneurons (?)… Do you know if there is a paradigm to look at LTP and LTD at the MNJ?

Category: Uncategorized | 3 Comments
Science and semantic web
on Friday, January 18th, 2013 7:04 | by Julien Colomb
I was on a meetup of corporate semantic web last Tuesday. These people are using semantic web technologies (making machine readable content based on ontological terms and relation between these terms) to improve the efficacy of private companies. For instance, they work on ways to improve wiki contents which may be produced in a company. This corresponds at using ontological term to annotate the wiki content and other related technologies. This can be used to find an expert in one category (=somebody who’s posts are rarely corrected on a specific subject).
What is the scientific community (the one which should be leading the way actually) doing during that time: we use text search in “keywords” and titles to find the appropriate literature, that we have to read thouroughly to drive our one conclusions about these different parts… At least, that is what we do 90% of the time, and we all know how inaccurate this can be. Experimental results may be translated into a machine readable content, why aren’t we doing it (it could make everything that much simpler, faster and more accurate)?
The answer: 1. there is no tool nor database where we could do it. 2. Scientists do not have the time to do it, they are over-pressurized to produce data, not to make it reusable or machine readable.
How to push people to use the semantic web technologies, how to ease this use, should it be done by the authors or by the community, pre or post publication, what ontology tool to use,… What can we do? Is anyone asking these questions around? Does a platform like researchgate be a way to introduce this, or should we go for a public solution, inside pubmed for example?
Is any of you asking/answering these questions?
By the way, this post is tagged by none-ontological terms, a shame?
Category: open science, Uncategorized | 1 Comment
PKC53e mutant
on Friday, January 18th, 2013 12:16 | by Julien Colomb
https://figshare.com/preview/_preview/106910
reminder:
username colombj@zedat.fu-berlin.de
password: neurobio
definitive answer should come end of next week.
Category: Uncategorized | No Comments
C105232 Gal4 GRIP analysis
on Saturday, December 8th, 2012 10:34 | by Sathish K Raja
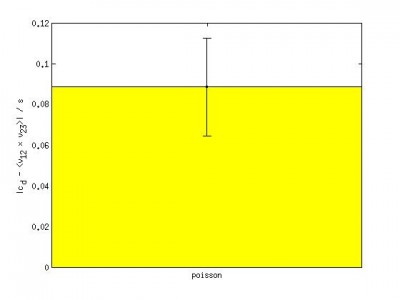
I took the poisson dataset from Maye’s published data and GRIP showed this result. However in the publication
yaxis range in poisson process is very low. I post the results of C105232 Gal4 lines in the next figure that shows
ISI close to poisson.
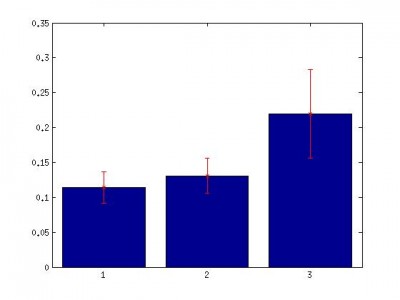
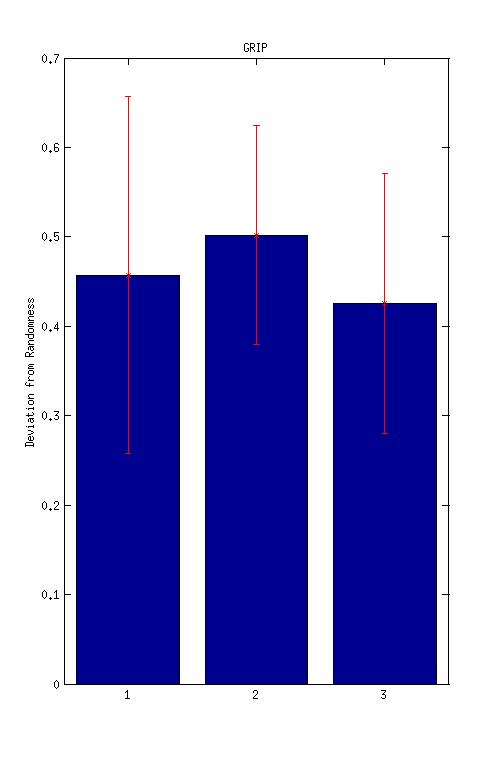
1-C105;c232Gal4-WTB,
2.C105;c232-TNT,
3.WTB-TNT
Category: Uncategorized | 2 Comments
Conti..
on Wednesday, December 5th, 2012 7:01 | by Sathish K Raja
sorry for separate posts !
Yaw spike frequency here, seems TNT has some effect on it.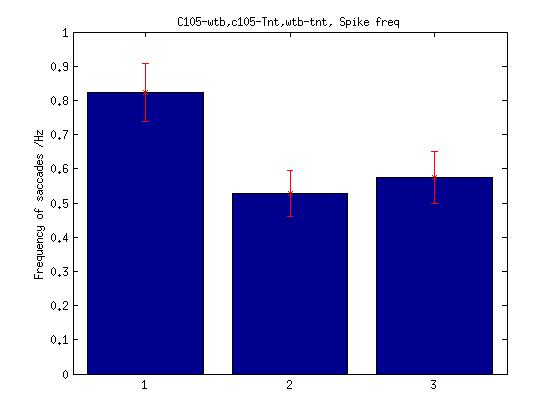
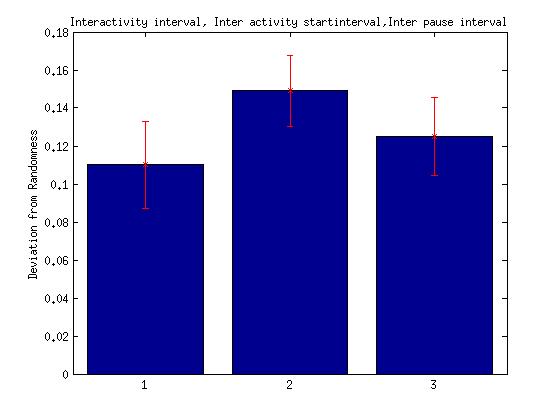
The following figure shows the computer generated correlated Buridan walk data. I extracted inter event parameters and used GRIP on them. We had plans to use this data as a control group., However it appears to be well above the poisson process. I really wonder what to use as control, I will generate may be poisson process myself within some xlimit, ylimit and can try,, Any ideas would be appreciated ?
Category: Uncategorized | 5 Comments
GRIP on ISI of C105 Gal4 torque
on Wednesday, December 5th, 2012 6:04 | by Sathish K Raja
Middle one is the TNT expressed on Gal4. Rest of them are controls; Y axis values are high than usual but highly variable as one would see in error bar. 0 value in the y axis would be the ideal randomness.
Category: Uncategorized | No Comments
Article please ?
on Monday, November 26th, 2012 2:50 | by Sathish K Raja
Can someone get me this article plz ? sathish.r@fu-berlin.de
Chaotic Versus Stochastic Dynamics: A Critical Look at the Evidence for Nonlinear Sequence Dependent Structure in Dopamine Neurons
Thanks !
Category: Uncategorized | 2 Comments
redundant posting figures
on Saturday, October 27th, 2012 5:50 | by Sathish K Raja
Dear people, I am wondering if one needs to post the same figures in lab log as well lab meeting share page. I understand that important stuff goes to meeting site. But I would like to hyperlink the relevant figures I post in website in lab meeting page.
Category: Uncategorized | 1 Comment
Torque distribution
on Wednesday, October 24th, 2012 2:17 | by Julien Colomb
I had seen beautiful bell shaped distribution of torque (around 0) from the Heisenberg’s lab. We thus checked the data we have (the 6 minutes data we produced with the same flies for the torque meter and compensator. Data produced on the same day, or later (when sathish was mastering the preparation a bit better).
Here is the distributions:
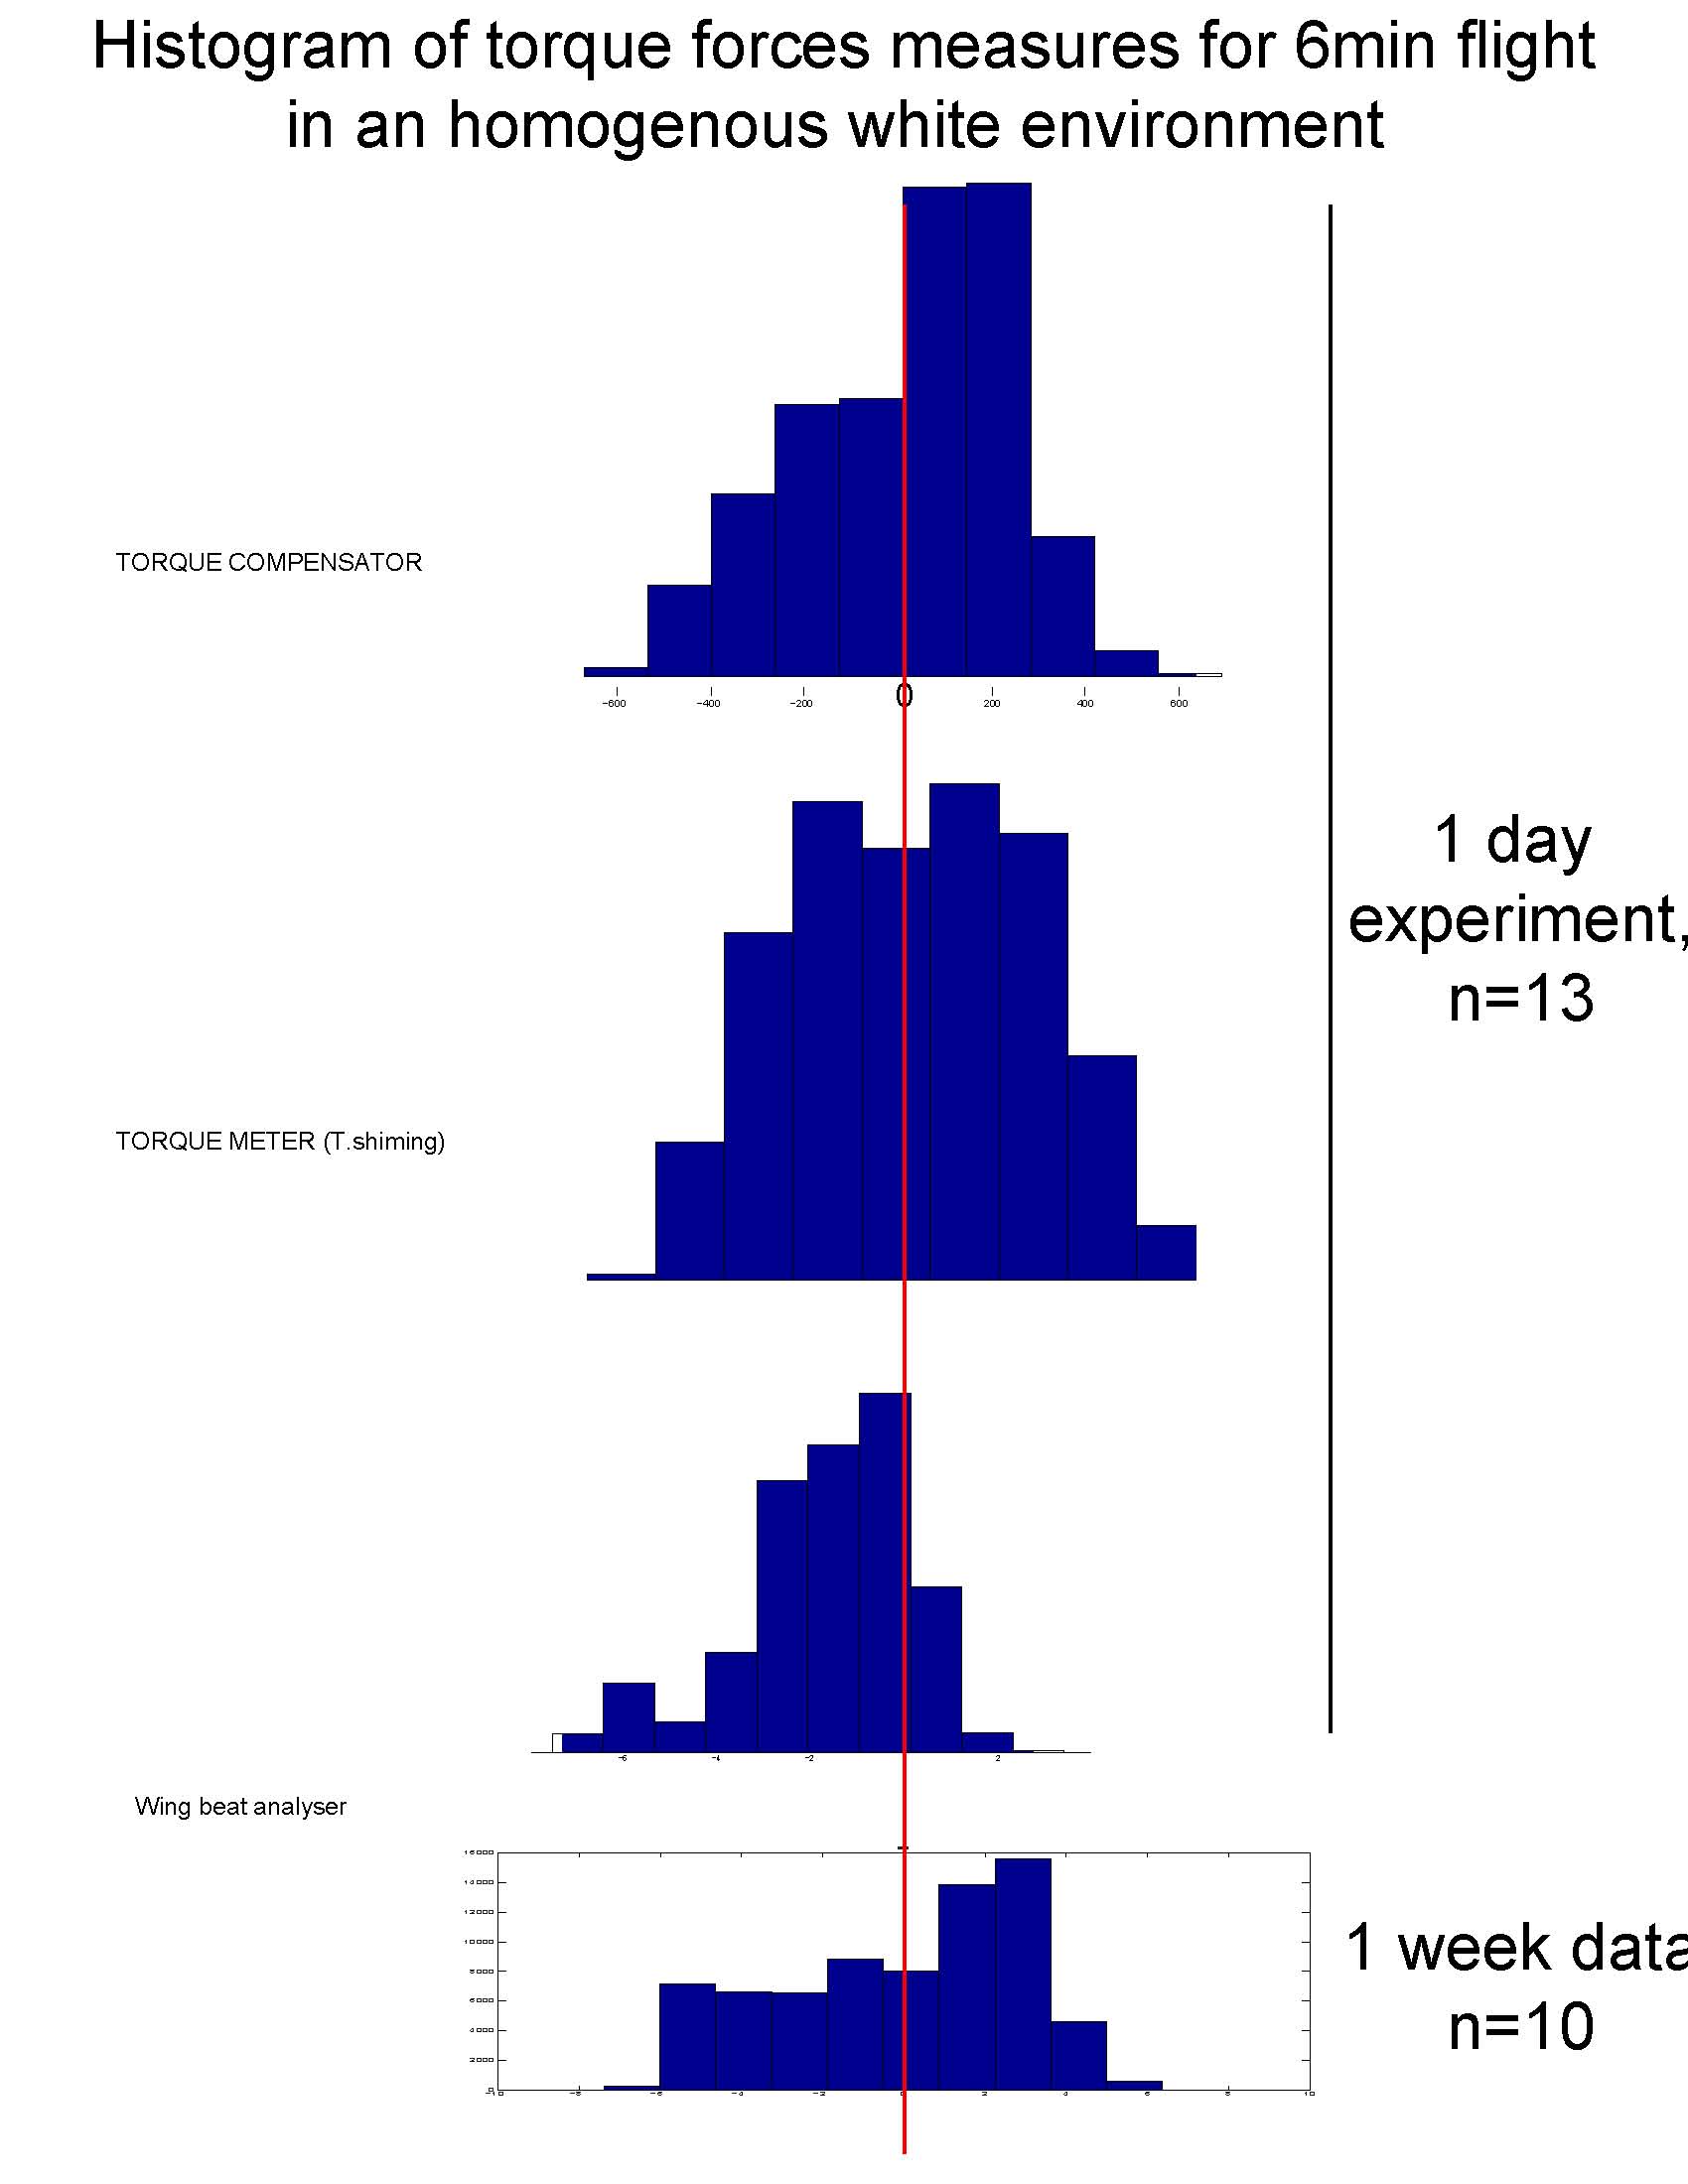
Our distribution are close enough to the bell shape obtain by the Heisenberg’s group. The wing beat analyser seem to lead to different torque calculation, though.
PS: no difference seen in the frequency of spikes on the other hand.
Category: open science, Spontaneous Behavior, Uncategorized | 1 Comment
SMap before and after self-learning: no difference
on Friday, October 19th, 2012 6:33 | by Julien Colomb
small but significantly different from 0 slope in the S-Map procedure, both before and after self-learning.
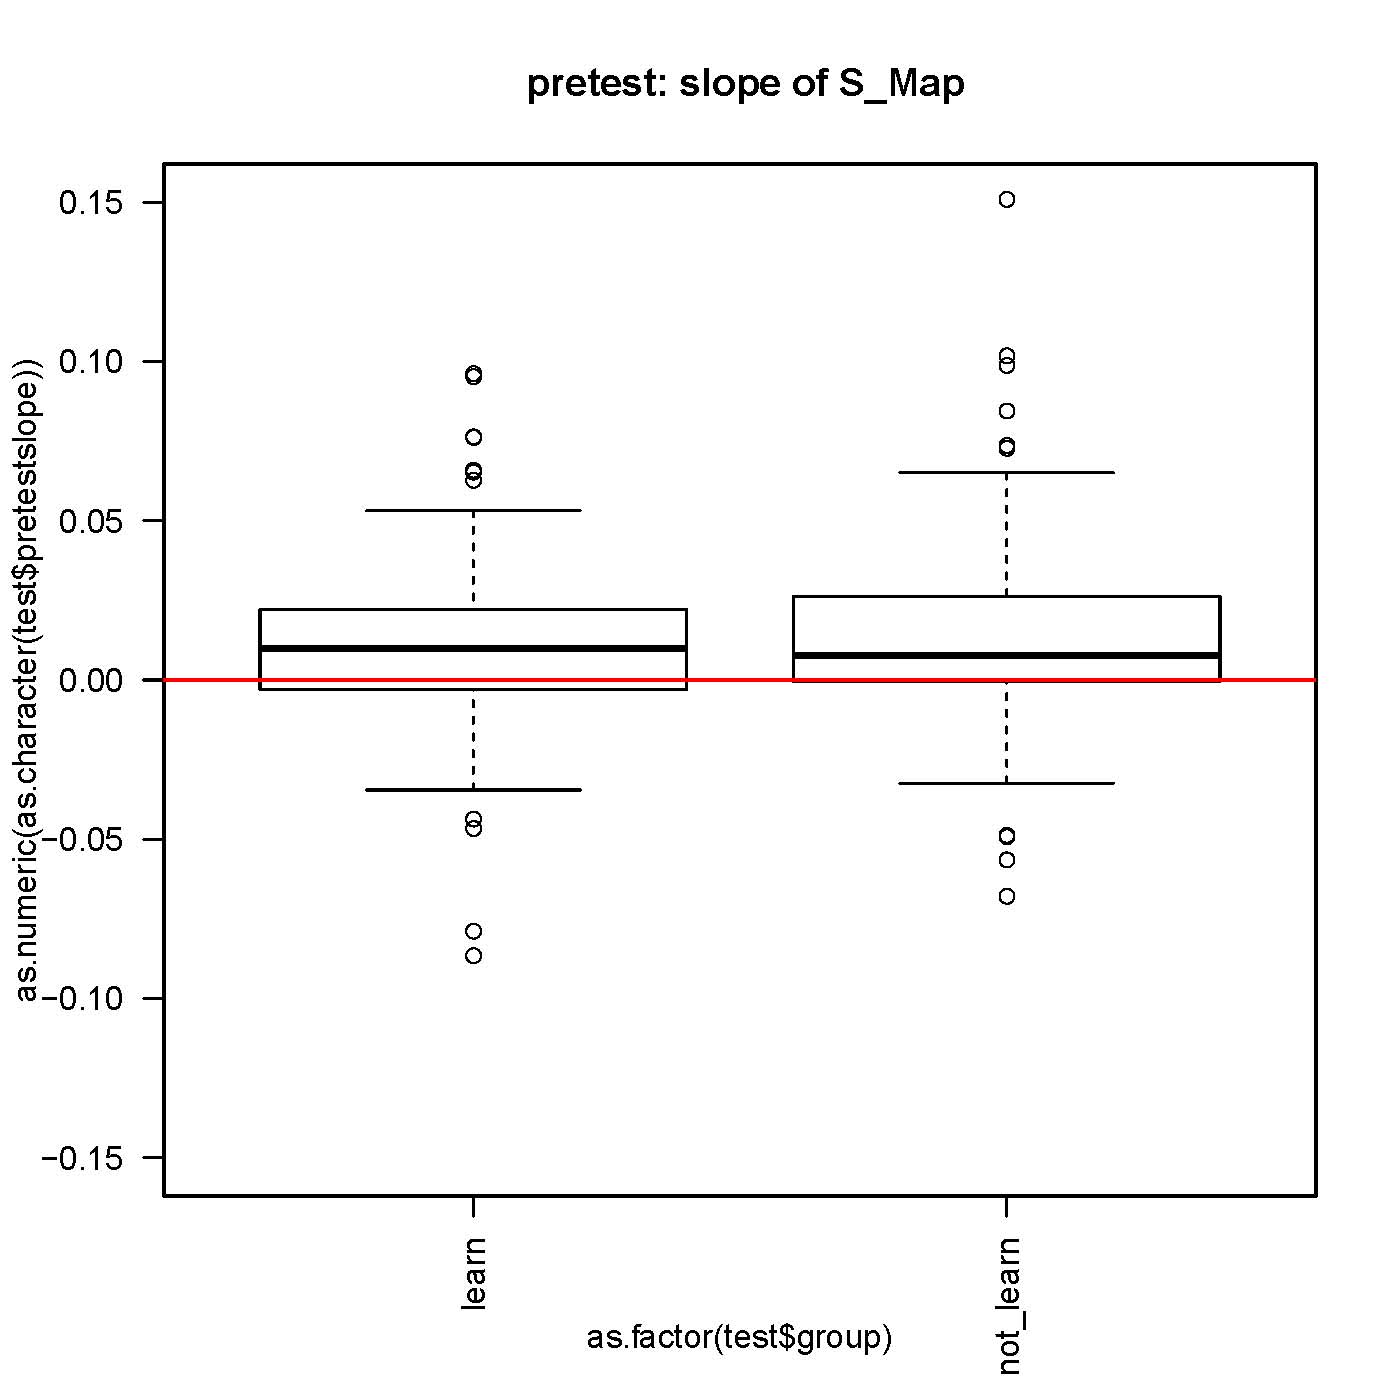
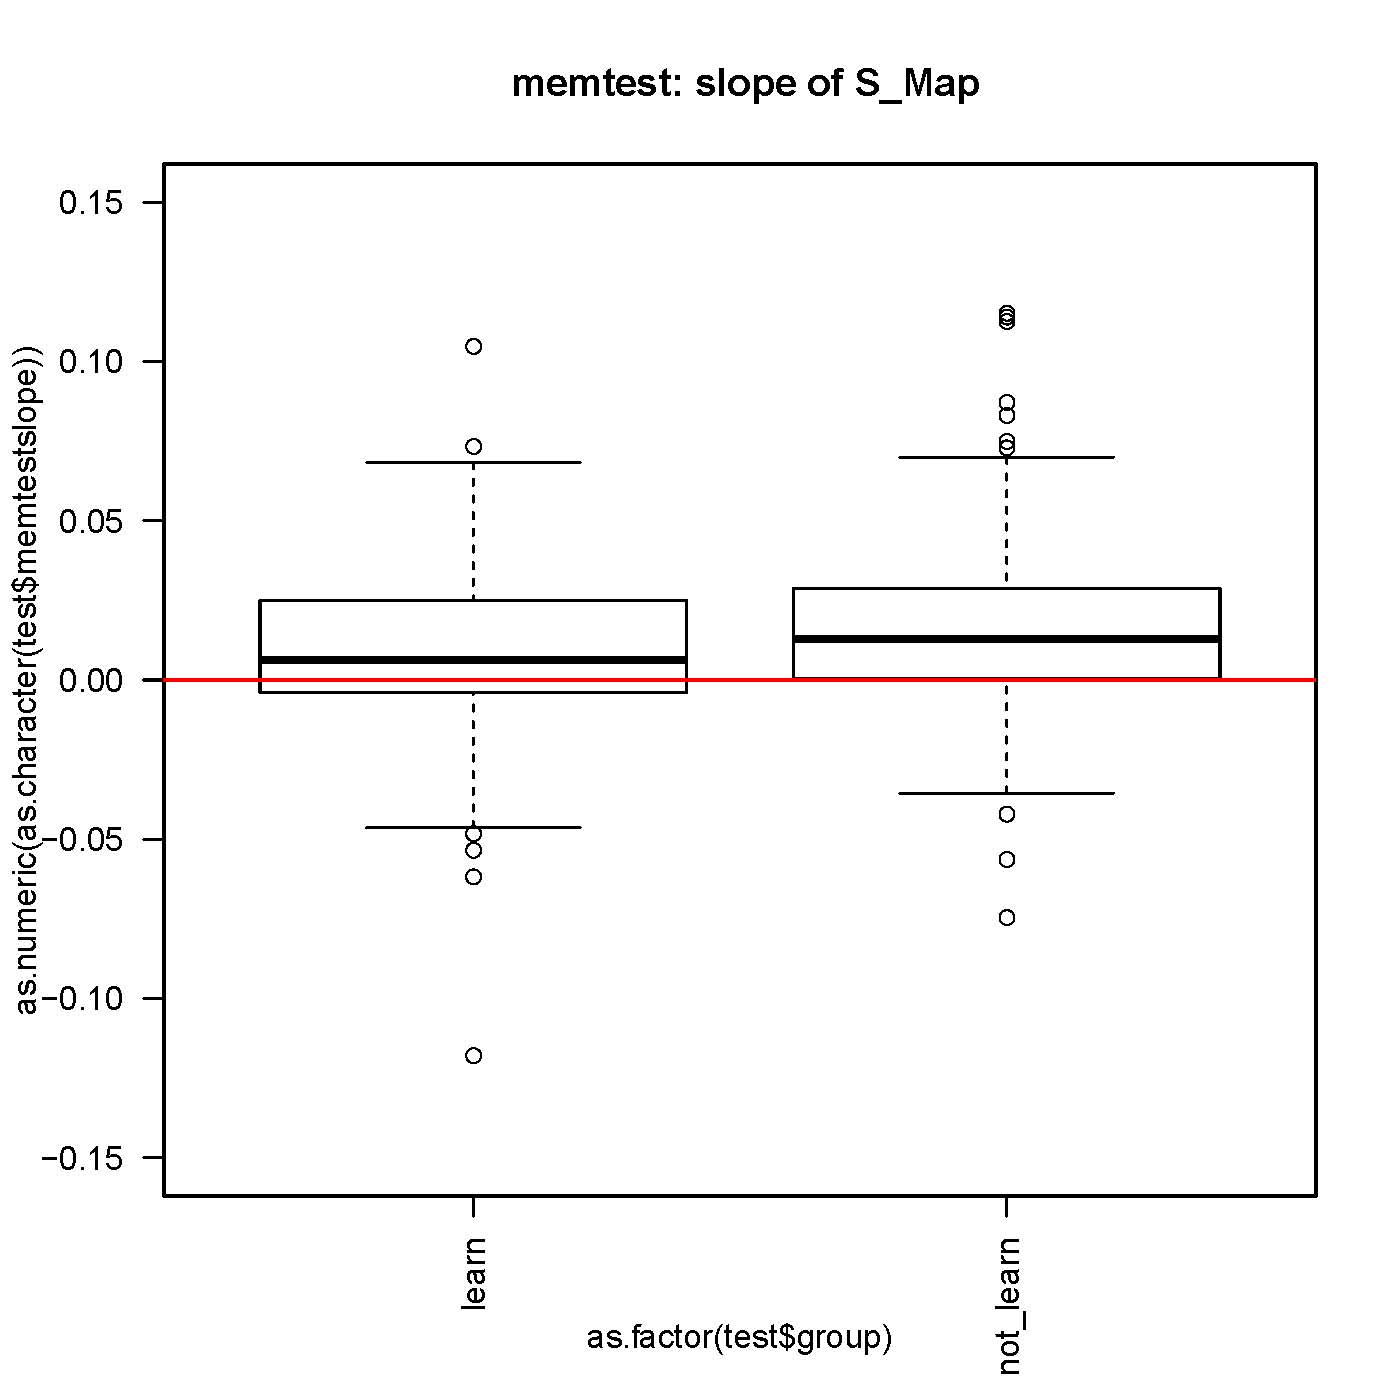
No difference in the slope while comparing before and after learning for each fly.
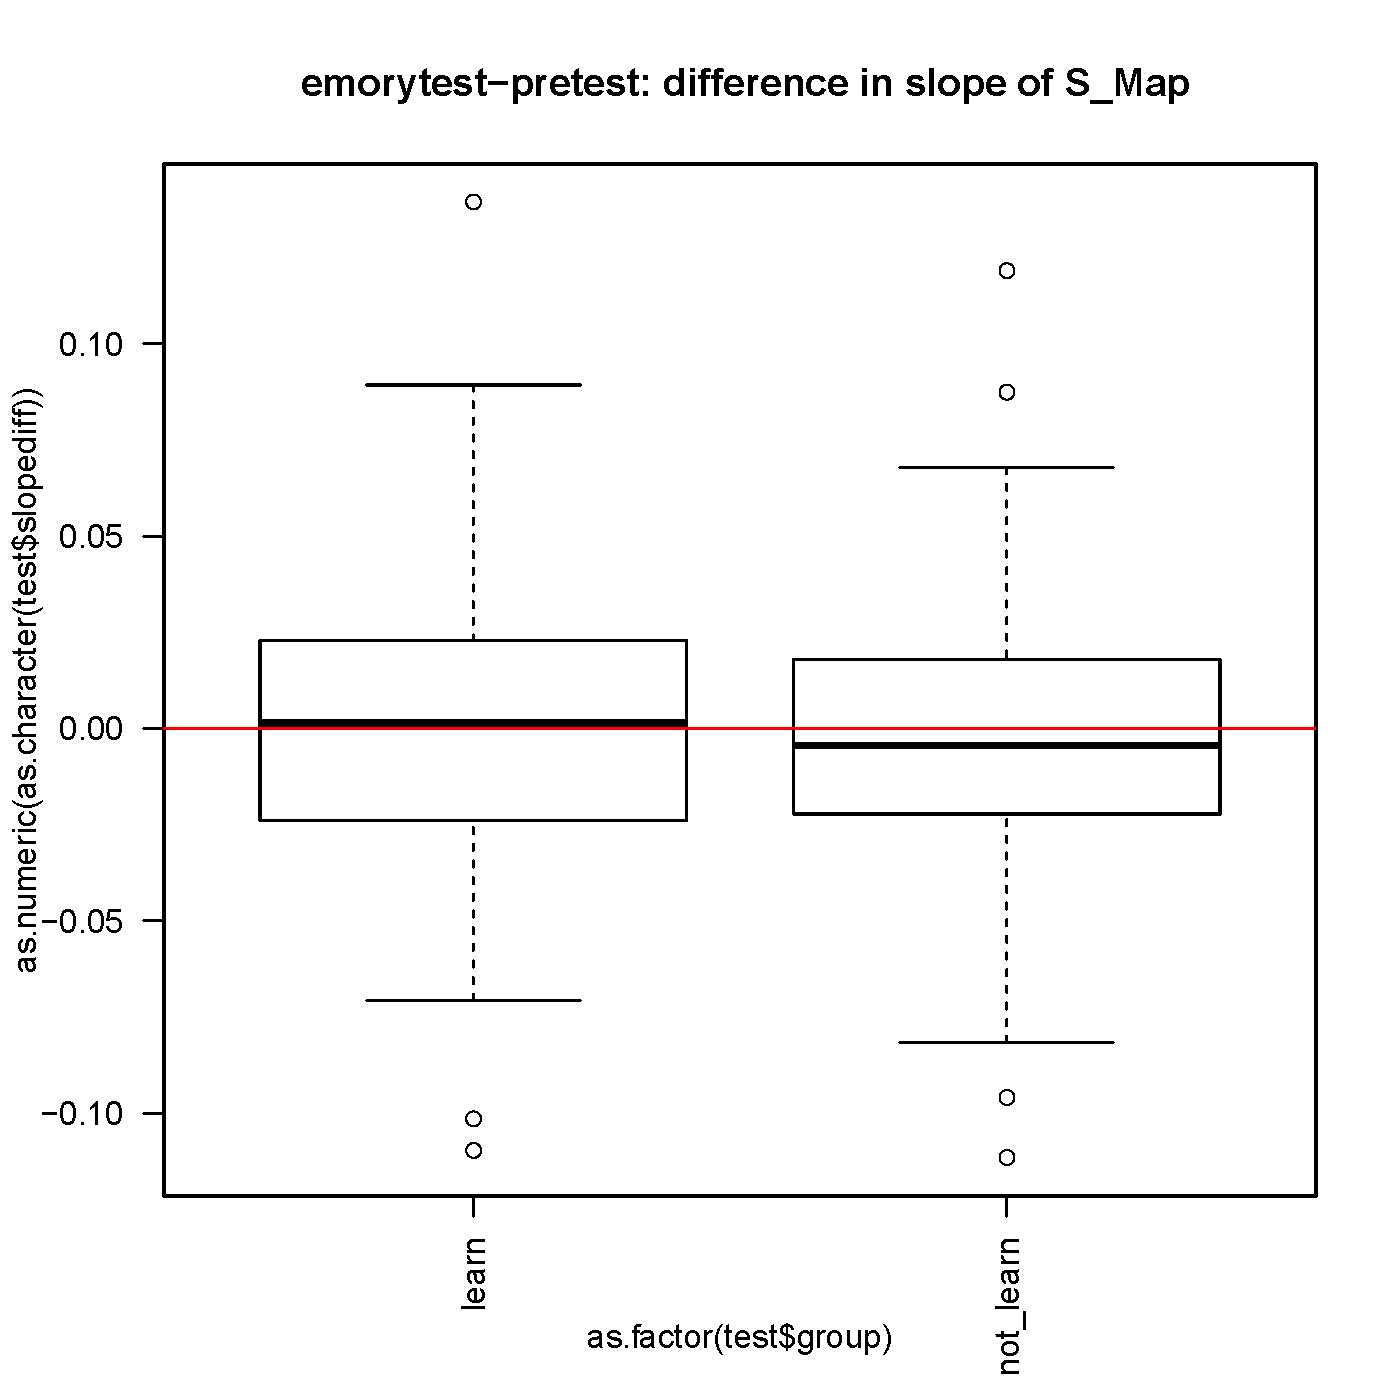
n>130 for each group.
Category: operant self-learning, Spontaneous Behavior, Uncategorized | 4 Comments