Modelling linearly the effect of the DANs on valence/speed and other metrics
on Thursday, October 13th, 2016 12:26 | by Christian Rohrsen
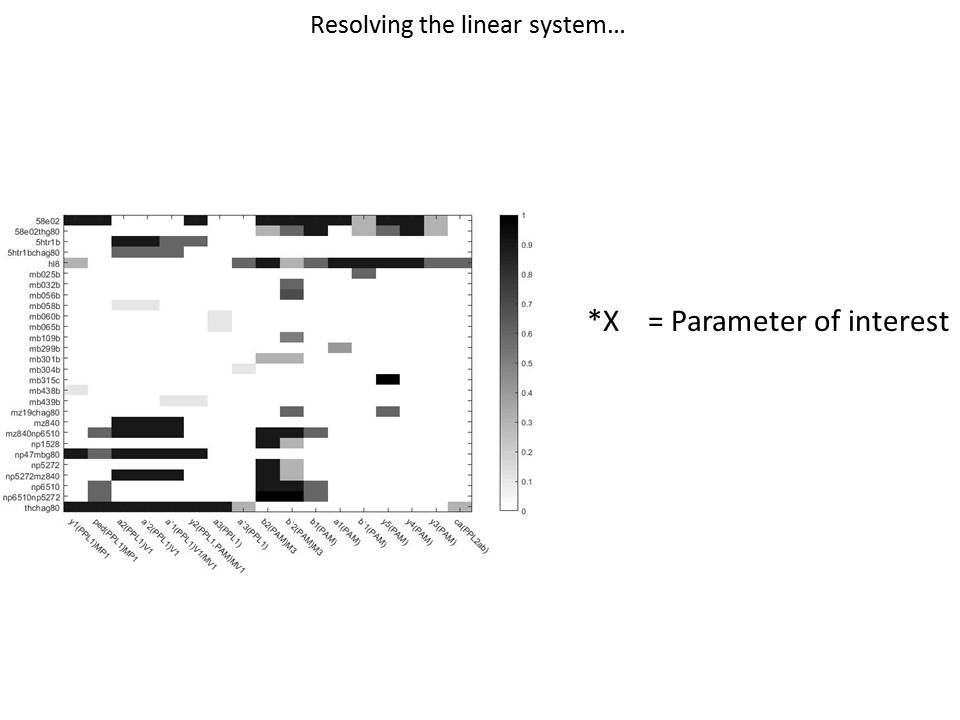
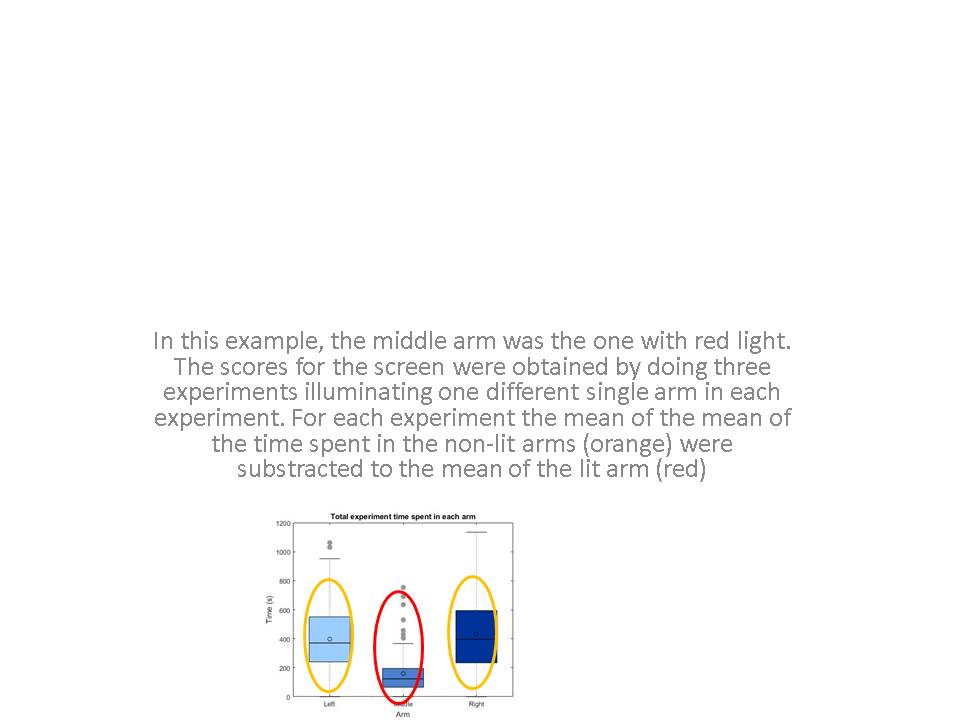
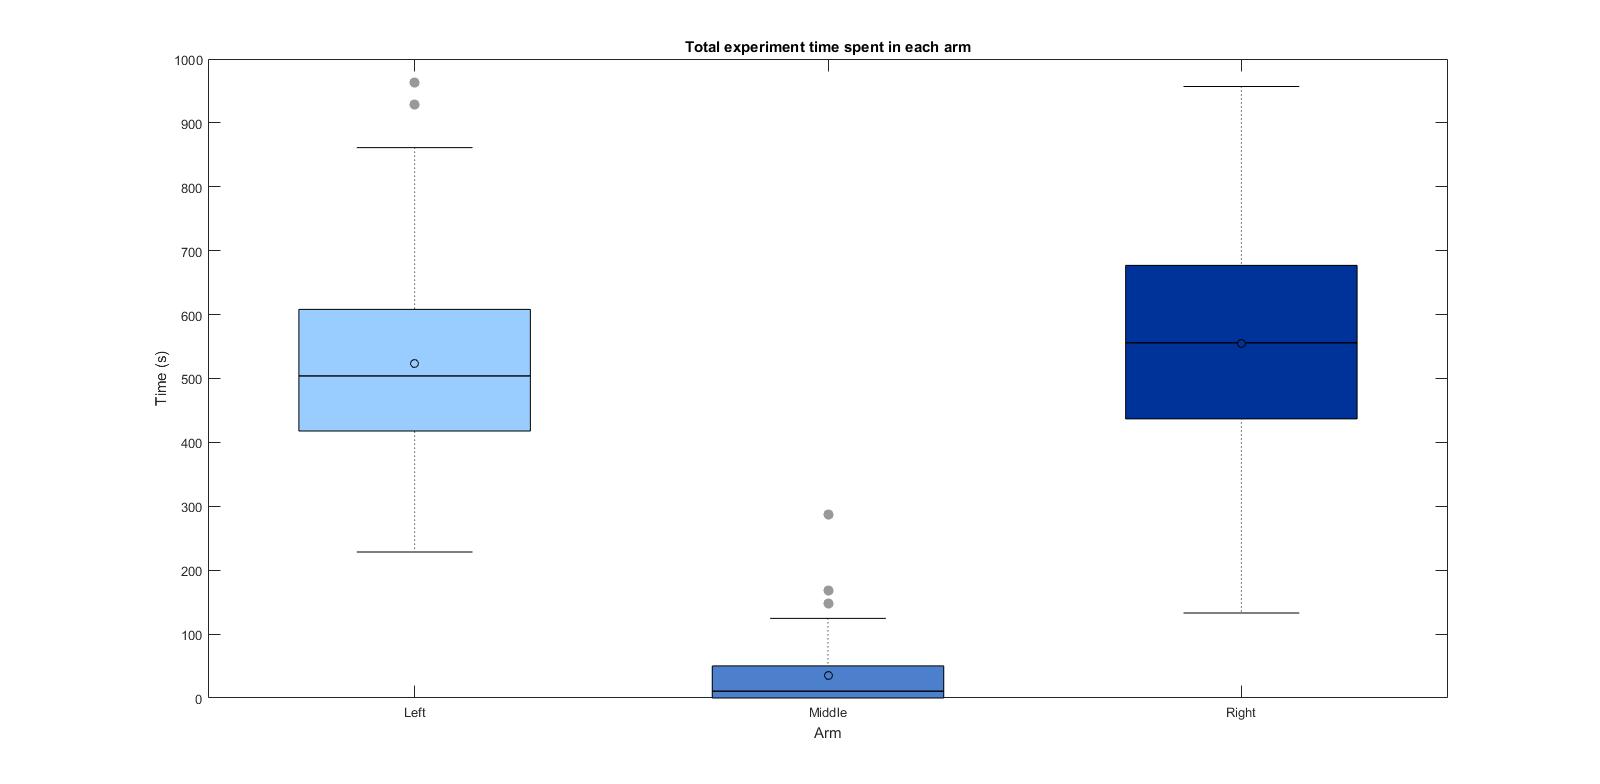
So this first picture shows graphically how I get the valences contributions for each of the dopaminergic clusters. On the Y-axis you see the lines I used for the modelling and on the x-axis the clusters. This is the expression pattern for all the drivers (split G4 and the dirtier G4s). I also made this expression pattern binary, to avoid the errors I could add by trying to estimate the expression intensity from the literature.
Here below are the results I obtained for one of the metrics. I wont explain to much here because the main result I see is that the results change drastically upon changes in the model. This tells me that there is something wrong there. Since making the expression table binary or weighted, or using a subset of the G4s used should not give me so random values for the dopaminergic clusters.
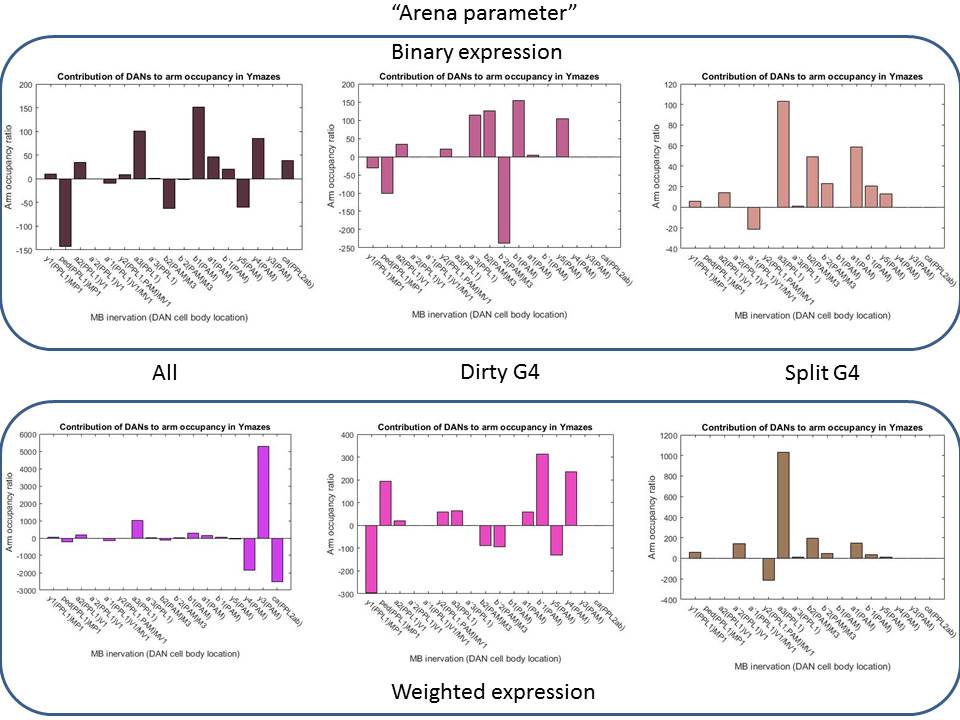
With this, I am quite stuck and do not know what to do next. Results seem not to show that much. Considering planning another experiment while there is time or continuing analyizing. Comments please!

Category: neuronal activation, Operant reinforcment, Optogenetics | 3 Comments
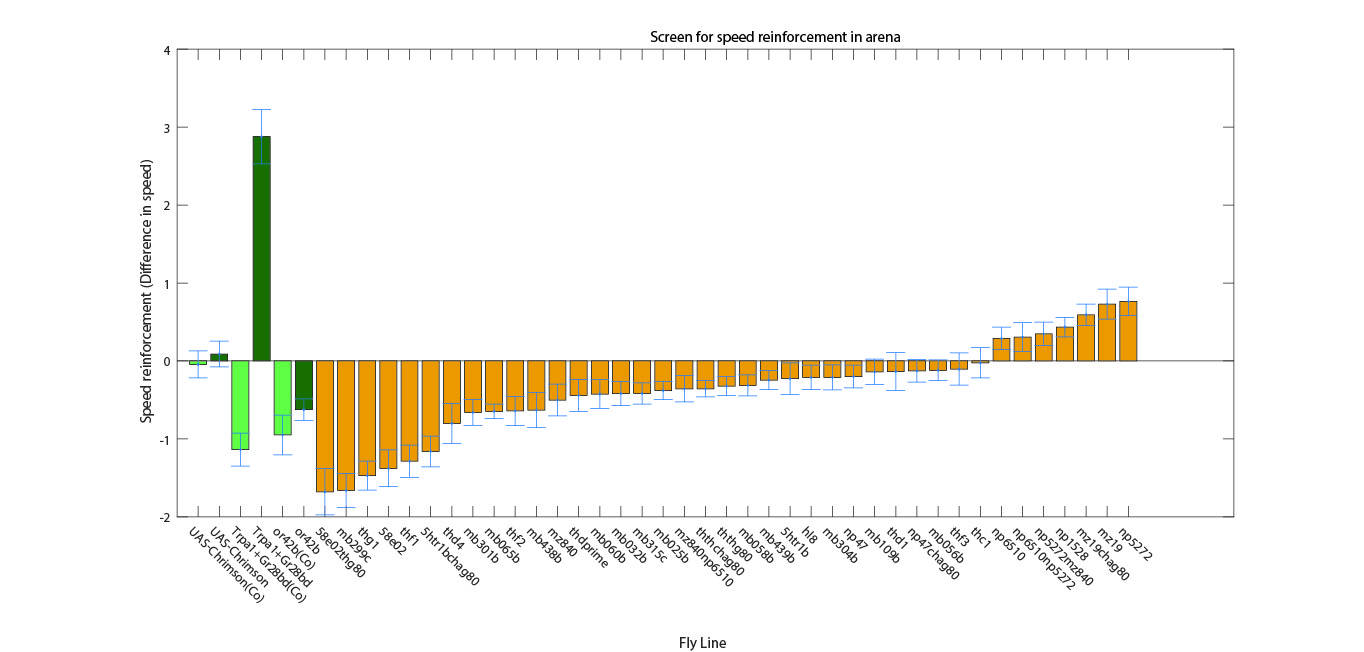
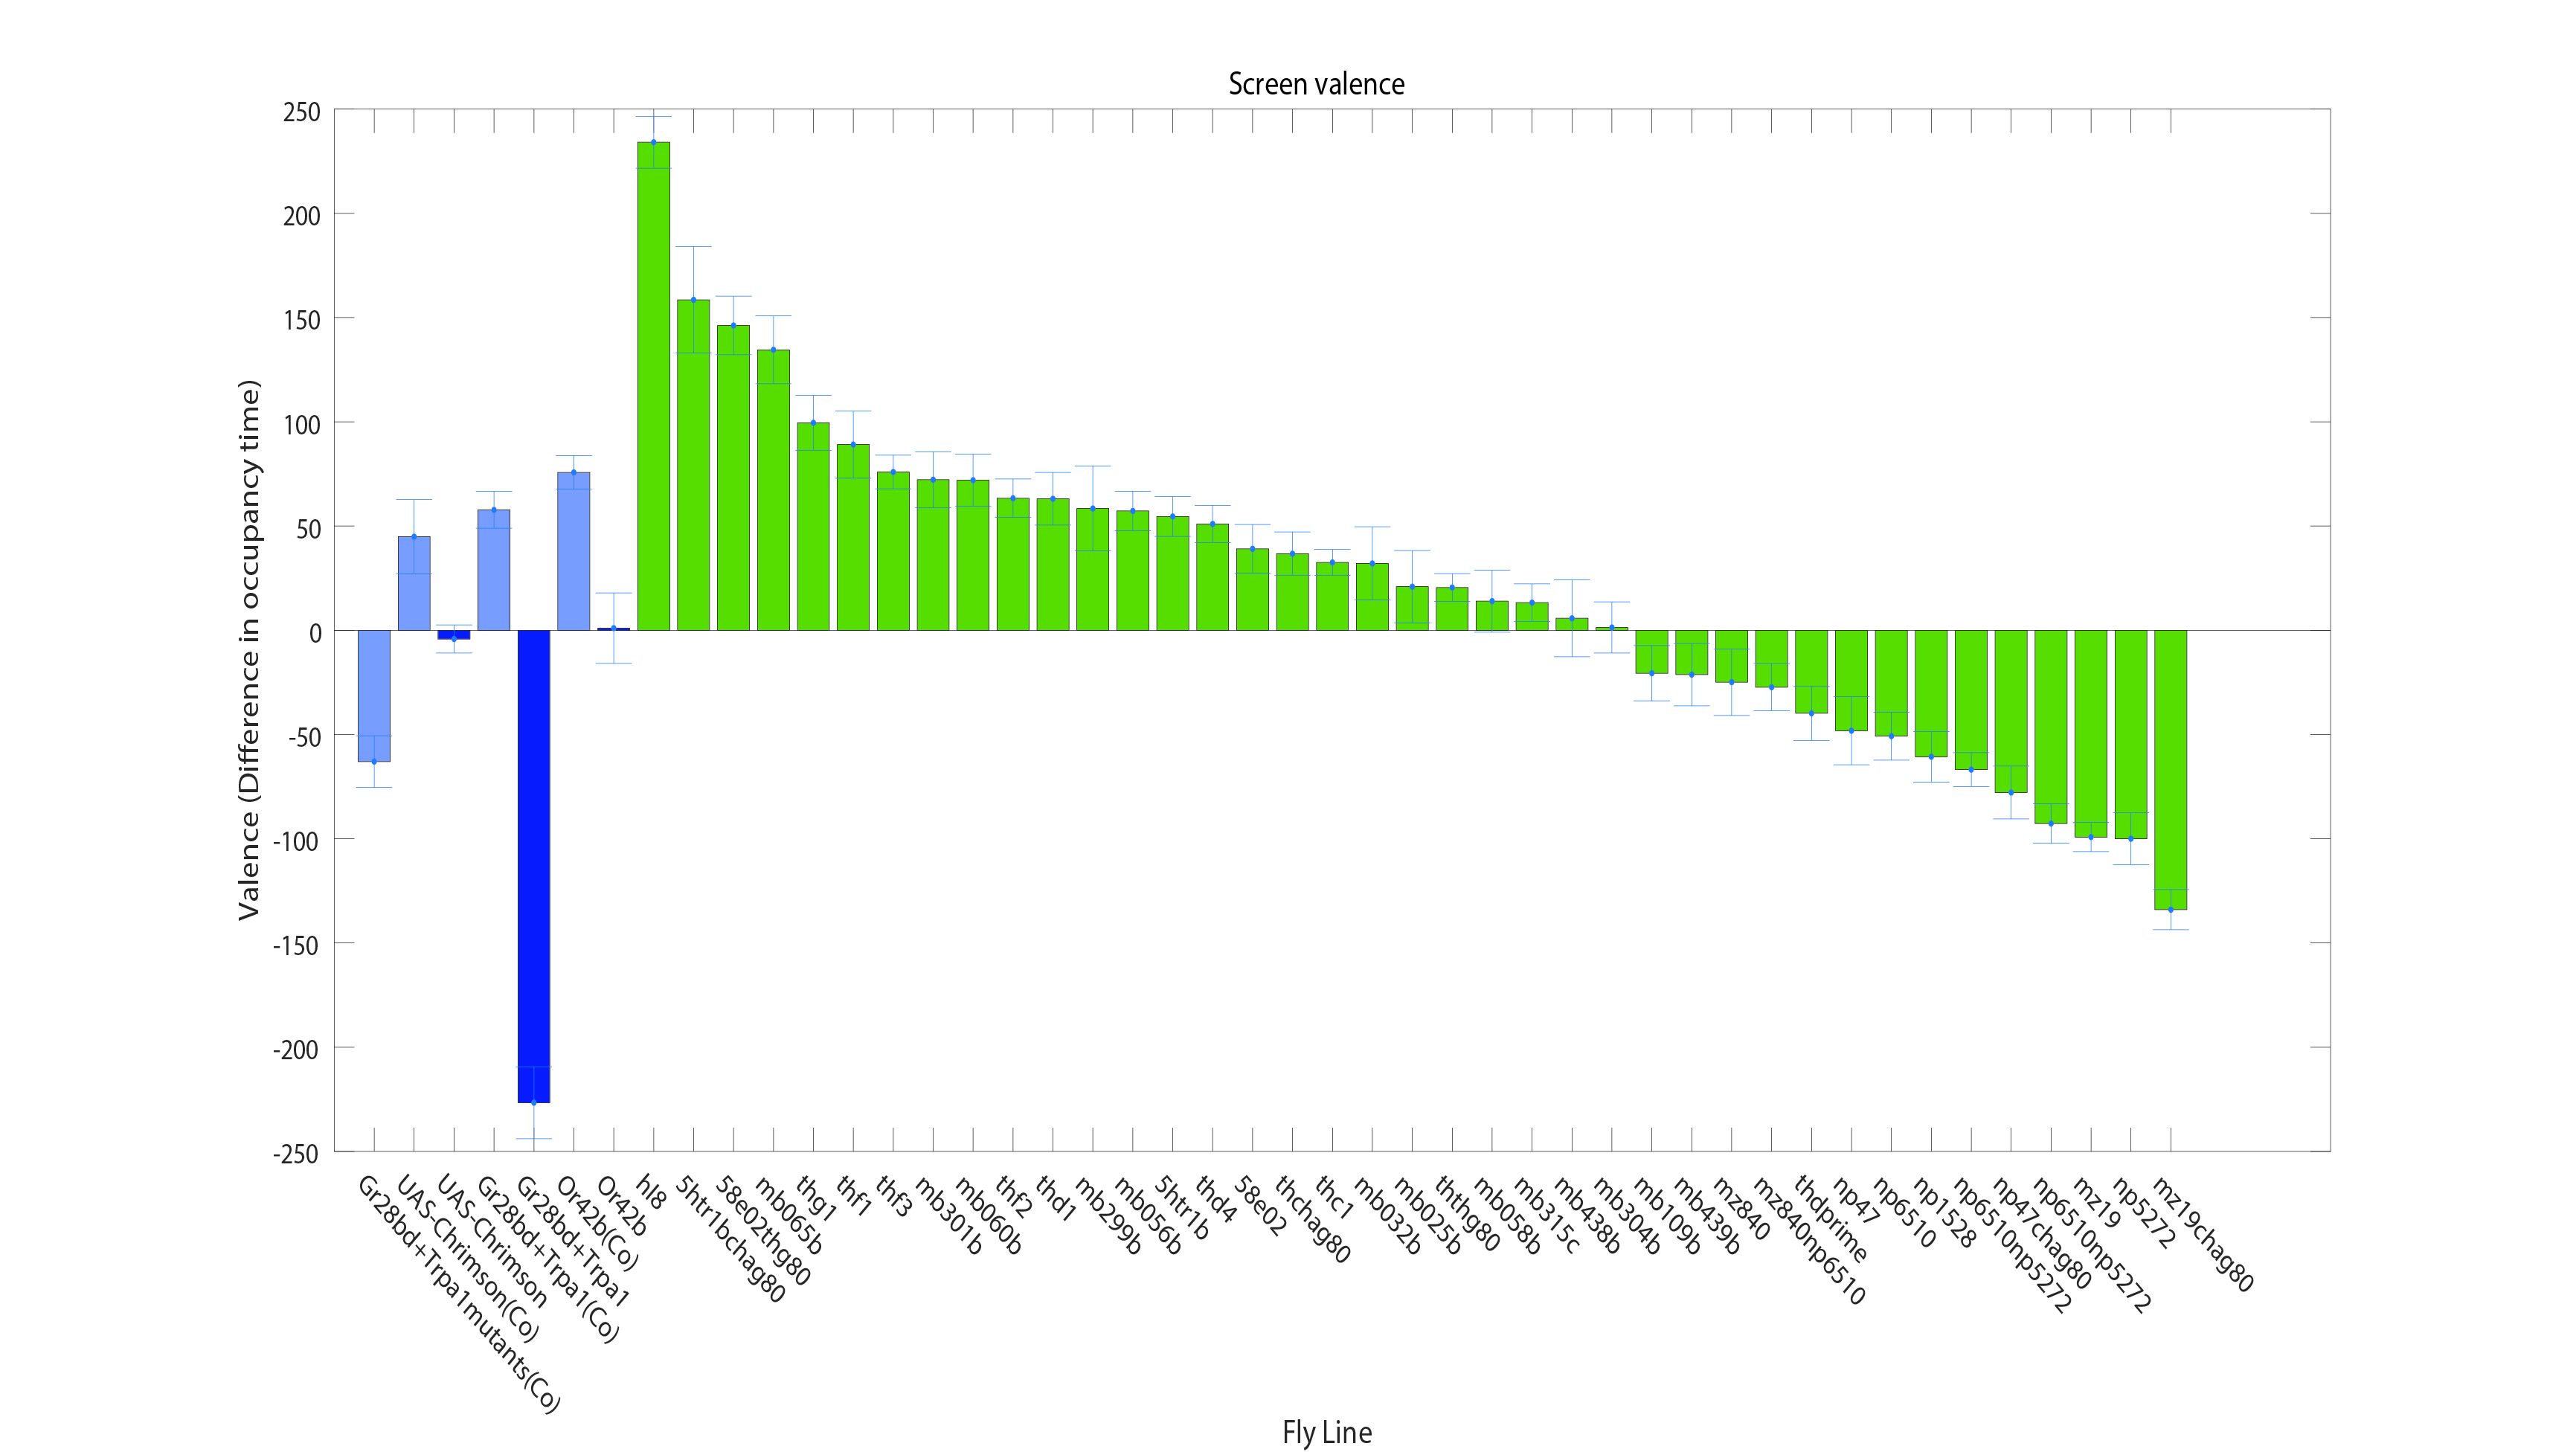
Screen results
on Sunday, September 4th, 2016 5:50 | by Christian Rohrsen
Category: neuronal activation, Operant reinforcment, Optogenetics | No Comments
Screen start
on Monday, August 1st, 2016 3:46 | by Christian Rohrsen
Hi guys,
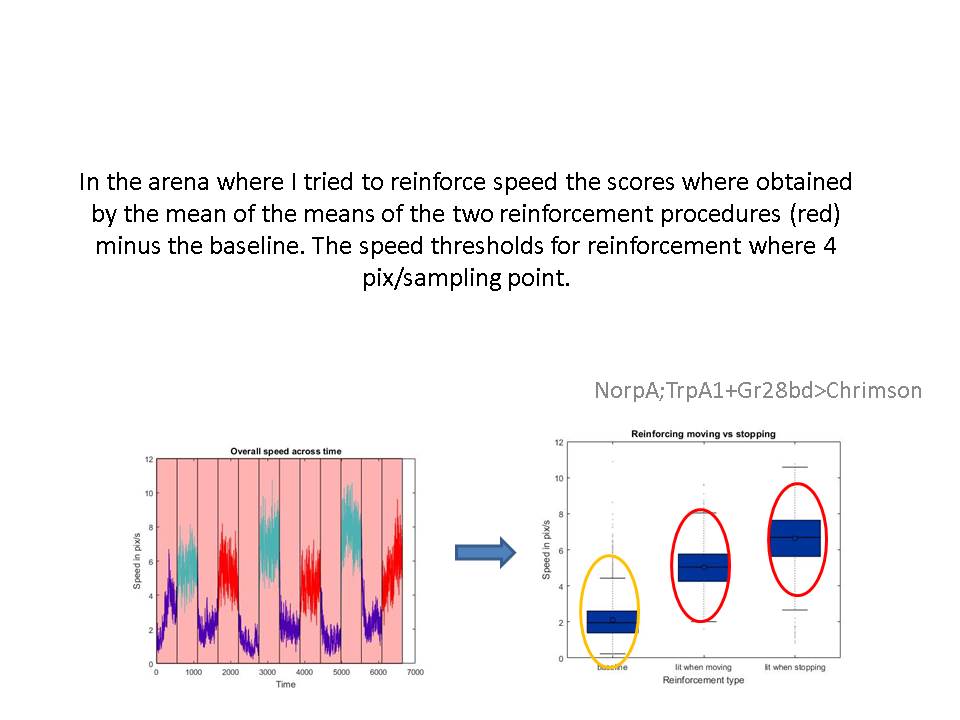
How are you? Quick update: I did manage to get the speed reinforcement to work. Thus, I will start the screen this week!
Category: neuronal activation, Operant reinforcment, Optogenetics | 1 Comment
Update
on Friday, July 1st, 2016 10:33 | by Christian Rohrsen
This is the same experiment as I previously showed of Gr66a>Chrimson (ATR). The only difference is that the light was on for the whole experiment, so that the flies could see the light before the entered the arm. Previously the light switched on once the fly went into the arm. The phenotype is much stronger (there is some classical component in it). I was trying to reinforce left or right turns but it does not seem to work after a bit trying out. It makes sense ecologically I think, that the right or left turns are not coupled to the reinforcement systems. I also have been thinking about the CS-US relation bitter taste-turn directions does not make sense ecologically, but maybe if instead of bitter, I apply pain or heat …it could work. I was thinking of reinforcing orientation as well as a speed threshold, or any other variants. What do you think? I would appreciate some ideas. Since I want to make sure about what am I measuring: operant/place/classical…
My update from de Bivorts lab
on Sunday, June 19th, 2016 8:37 | by Christian Rohrsen
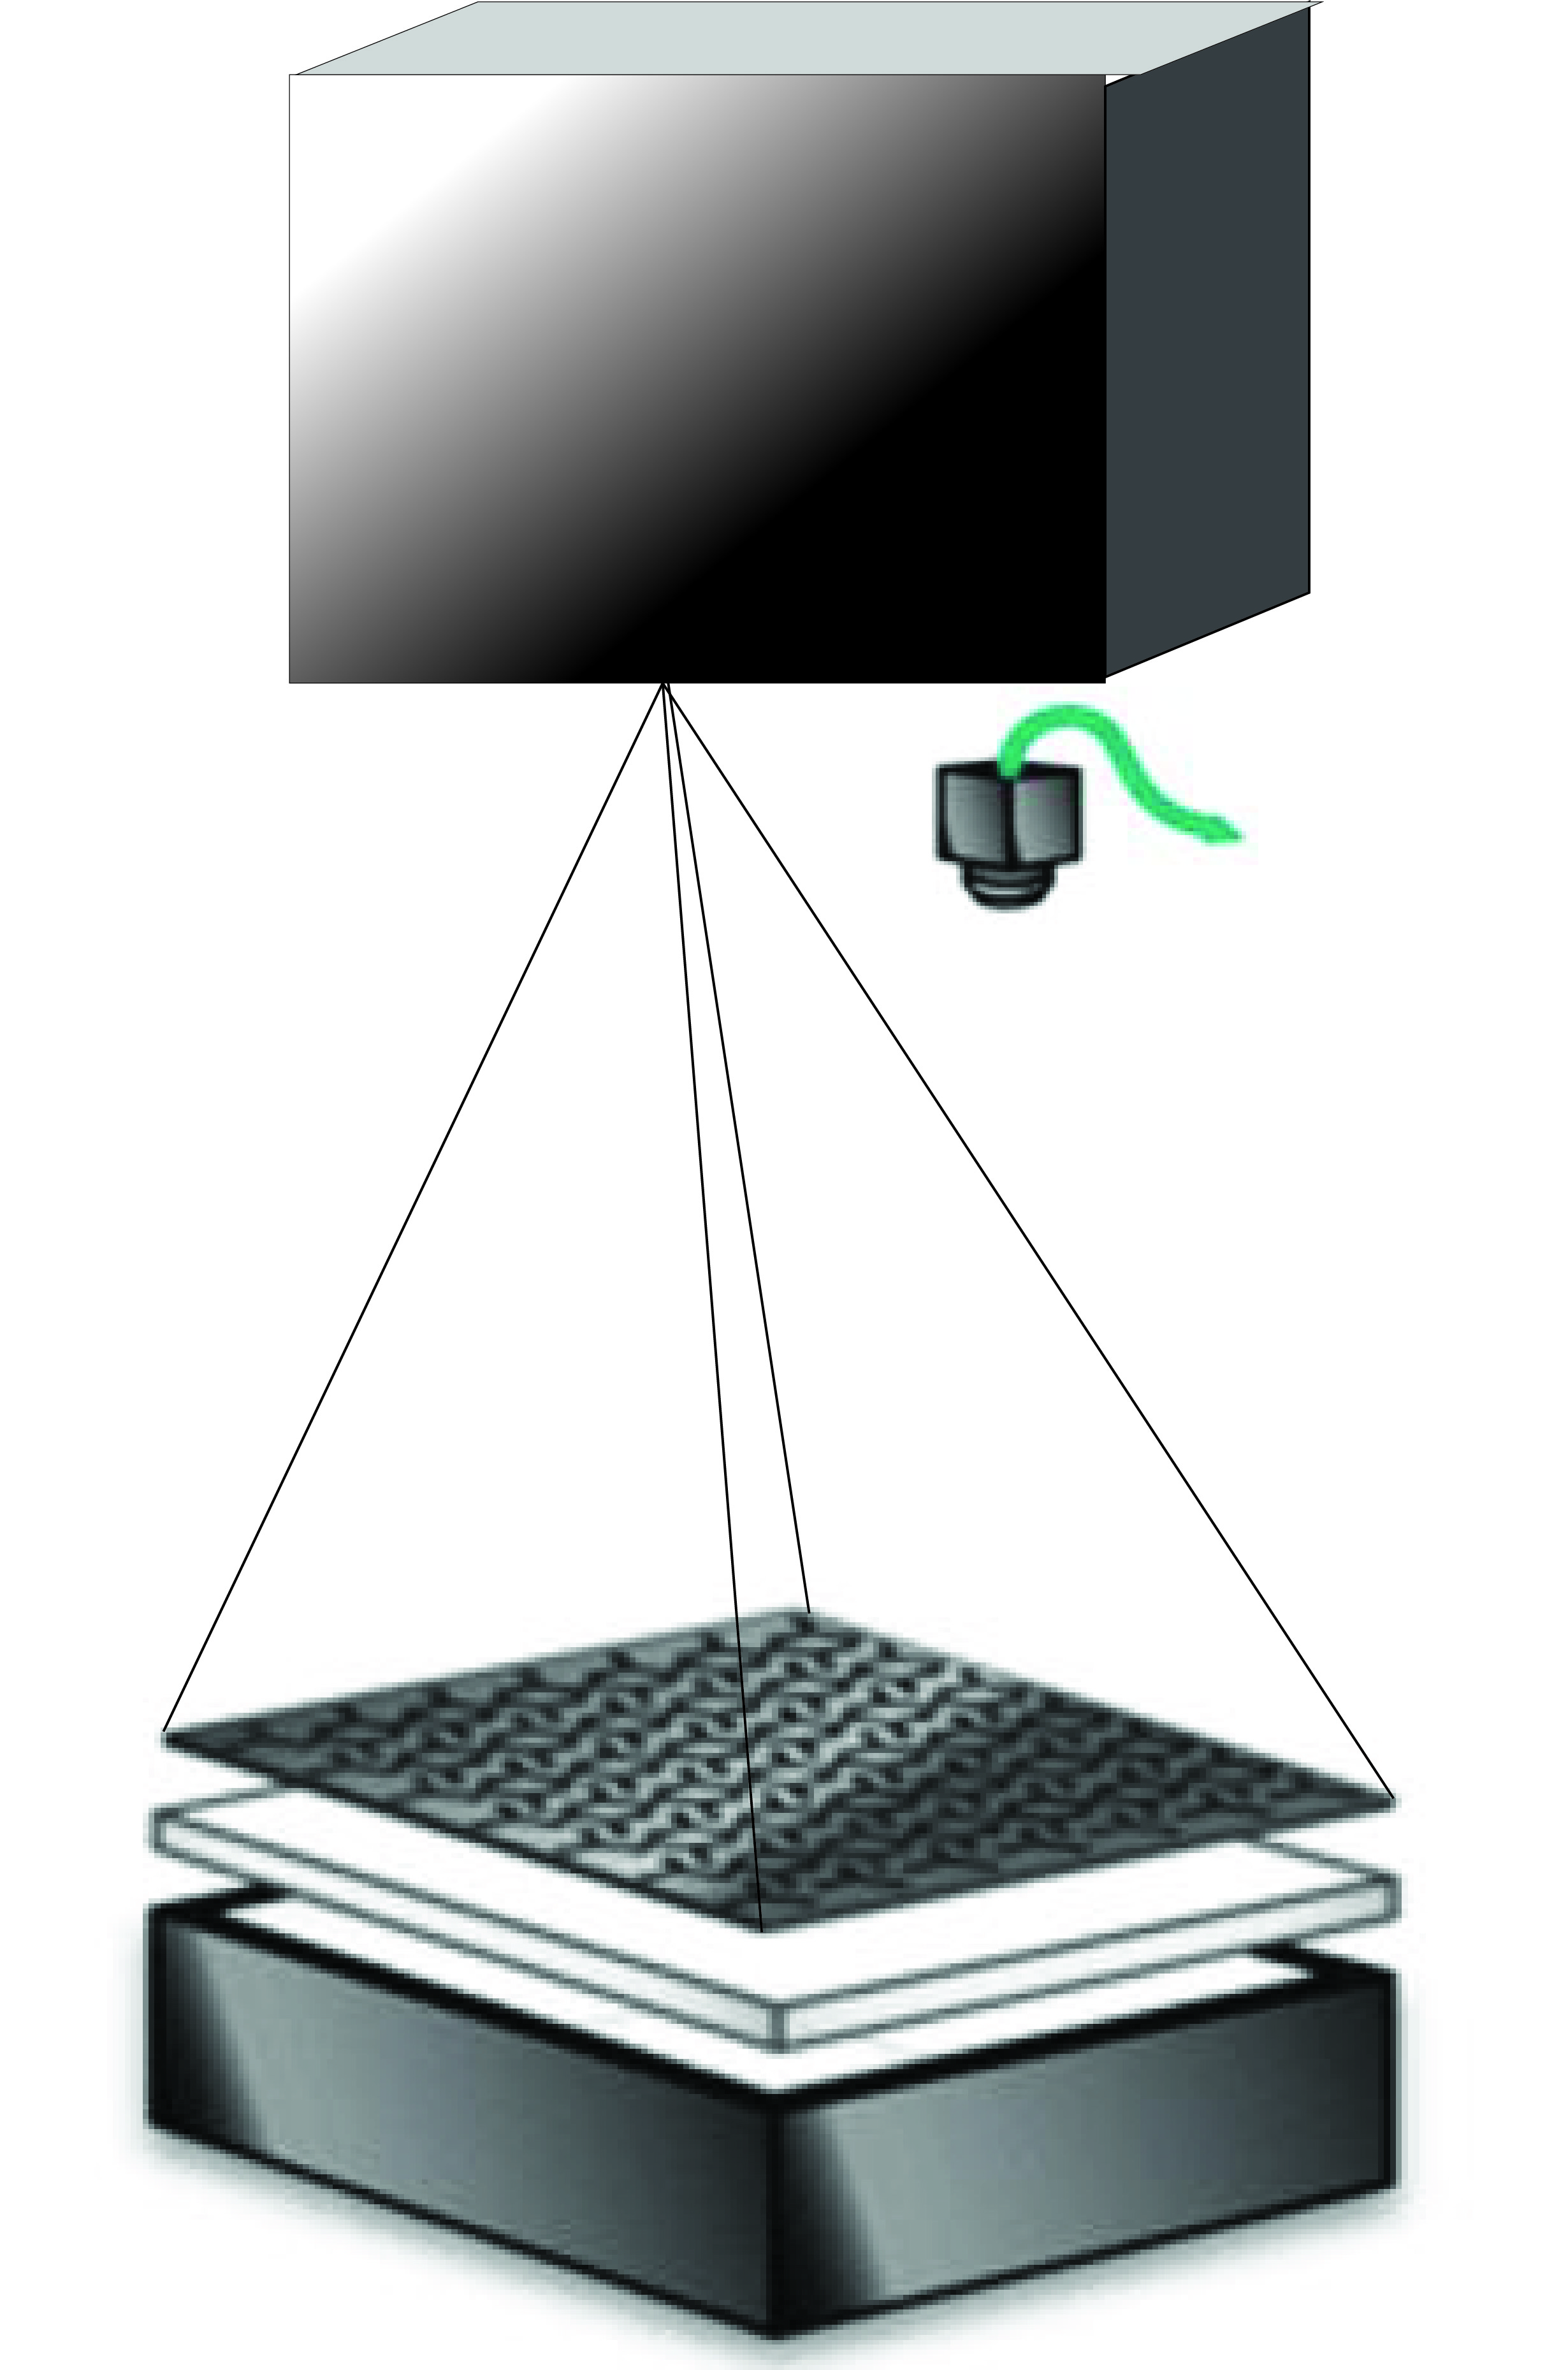
Schematic of the Y-mazes closed loop. A setup consisting of a rig with many Y-mazes is illuminated from below with a diffuser in between. Above a camera records from the behaving flies in the Y-mazes and track different parameters online over the time course of the experiment with a custom software. The initial paradigm detects whenever the fly enters the middle-vertical arm and consequently send the signal to the projector to illuminate that arm, which in turn reinforeces the fly behavior.
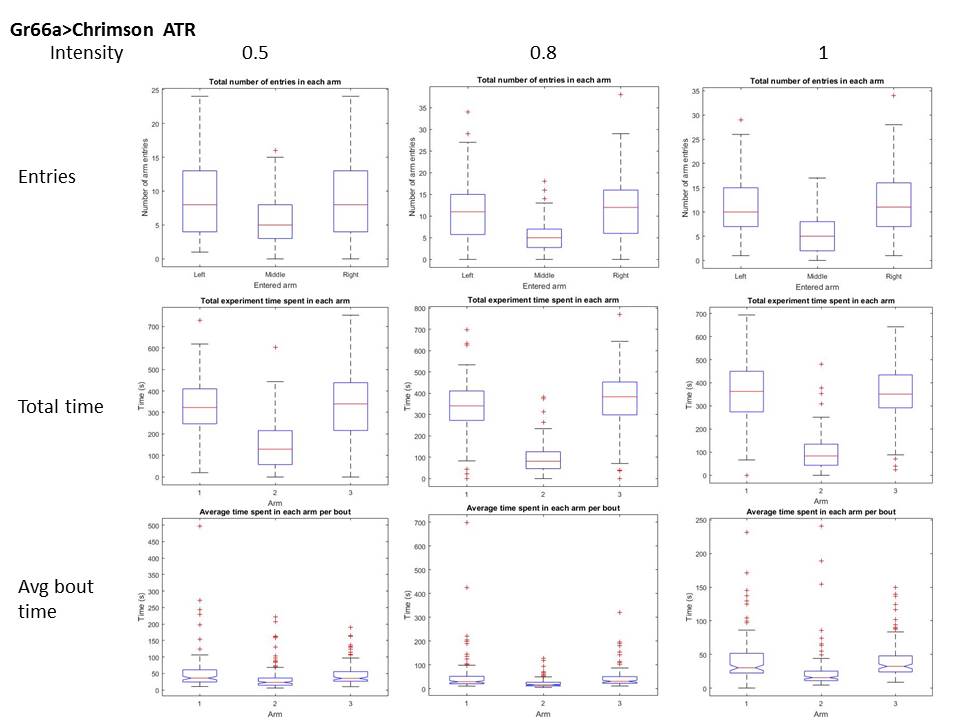
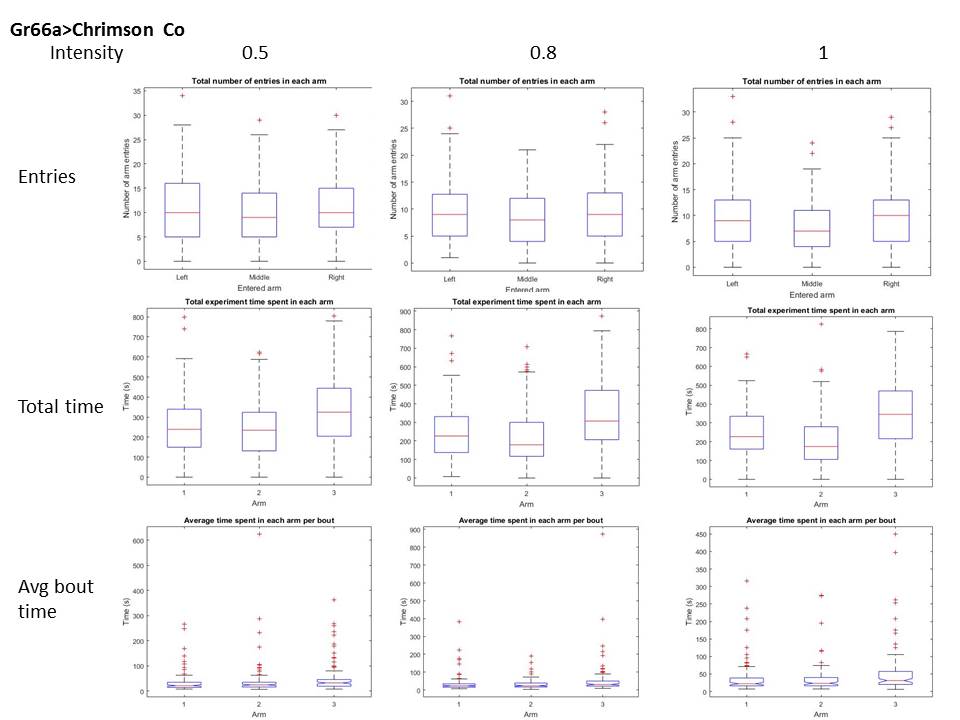
Below the validation tests at three different intensities (columns: intensities relative to projector max. output). I measured three different parameters for this validation (rows), for two conditions, with and without ATR (first and second graph). It seems like the paradigm affects both, number of entries and dwelling time within the arm. It seems like at the maximum intensity, even without ATR there might be an effect.
Category: neuronal activation, Operant reinforcment, Optogenetics | 1 Comment
Droso Kurs and more
on Friday, April 22nd, 2016 6:18 | by Christian Rohrsen
Here I attach the results in a pdf file from the students praktikum with an additional line I tested on my own meanwhile (Gr28bd and TrpA1 drivers together). They seem to work as a really good positive control btw, good for technique optimization.
For the students I tried out two different split drivers, the MB058B, which targets PPL1-a’2a2, and MB301B, which targets PAM-b2b’2. In addition the Gr5a driver, because it targets the “sugar” neurons. From the split drivers I wanted to see if I still get a validation from my initial model. MB301B seems to do quite what my model would predict but MB058B maybe not. Hopefully in a future screen I would be able to test many more and make a much more precise modelling.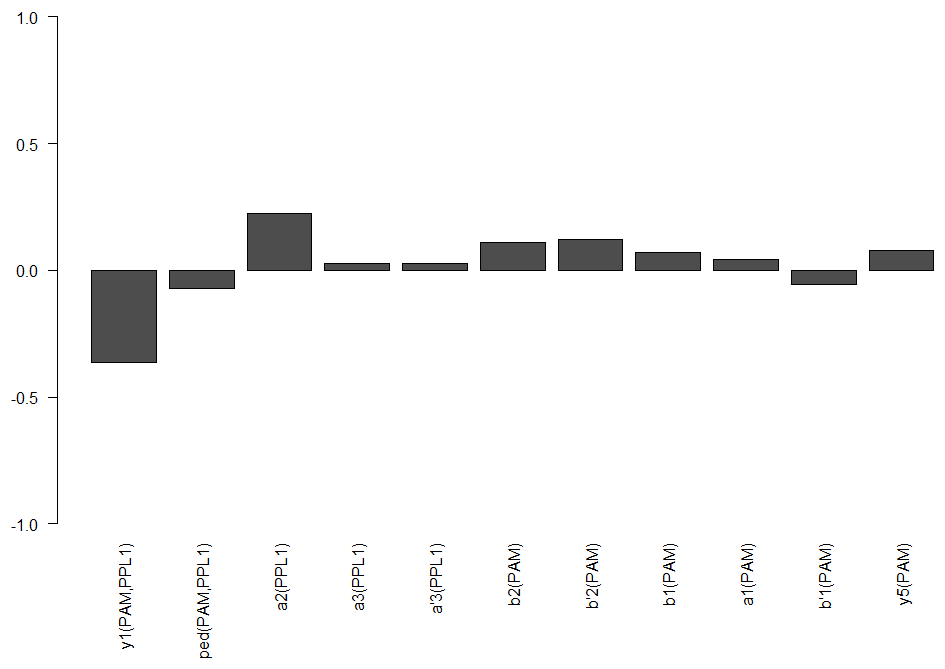
Category: neuronal activation, Optogenetics, R code | No Comments
Modelling the T-maze screen
on Monday, March 14th, 2016 1:35 | by Christian Rohrsen
This is the markdown showing the protocol and results of the modelling for the choice in the T-maze. This is for calculating valence. Nevertheless, this needs to be confirmed with the results of more lines, it could be that it is overfitted, I would like to do in addition cross-validation. I´m actually doing crosses and finding new lines to have more lines to test.
Category: neuronal activation, Operant learning, Optogenetics, R code | 1 Comment
Lab report: Optogenetics – A screening with the channelrhodopsin Chrimson
on Tuesday, November 24th, 2015 7:17 | by Lena Danyeli
Optogenetics is a technique in which light is used to control cells in living tissue, typically neurons that have been genetically modified to express light-sensitive ion channels. The technique is used to modify the activity of a given set of neurons, even within freely-moving animals.
In the course of Christian Rohrsen’s project “Dopamine neuronal populations involved in reward and punishment” we performed a screening to assess avoidance and appetitive behaviour of flies by monitoring the escape or approach from or towards the illuminated arm. We assessed distinct types of neurons by means of two different optogenetic setups– the T-maze and a custom-built platform, which are presented in the following:
Experiment 1: T-maze
First part of the internship was to further optimize parameters in the already established method T-maze (as introduced by Christian Rohrsen: see scheme below) for an efficient use in optogenetic experiments with the channelrhodopsin “chrimson” (spectral peak at 590 nm).

The general setup consisted of one illuminated arm and one non-illuminated dark arm. Following parameters were monitored to select the most convenient conditions for the screening:
- Light source:
→ pulsed vs. constant light, light intensity and positioning of the light source
- Time parameters:
→ duration of trials and time between repetitions
- Food supplement:
→ ATR vs. no ATR
- Genetic drift:
→ separate breeding of flies with different genetic background
The screening was performed with following fly lines (all crossed with NorpA and therefore blind):
NorpA;Or42a>Chrimson
NorpA;58E02>Chrimson
NorpA;TrpA1>Chrimson
NorpA;Gr66a>Chrimson
NorpA;UAS-Chrimson and wtb; UAS-Chrimson (control for leaky expression) as genetic controls
To control for the genetic drift, we used two groups of flies of the same line but reared separately for several generations (group “yellow” and group “white”, referring to the color used for labeling).
Results:
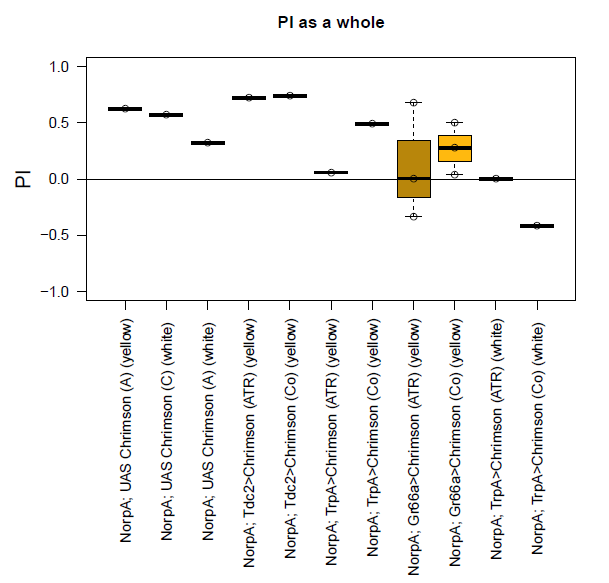
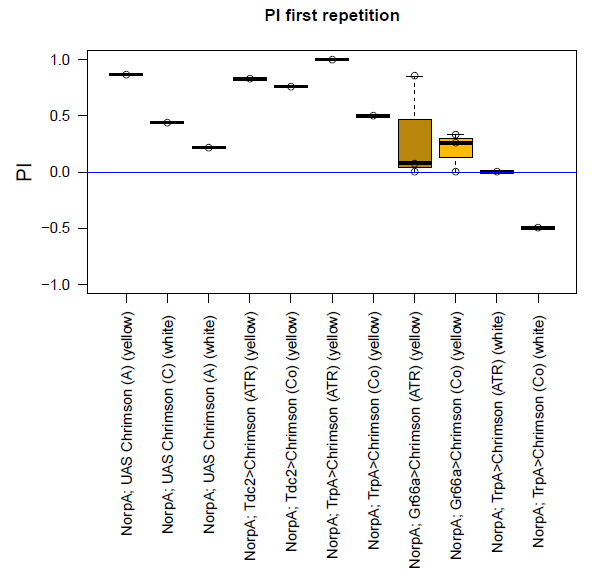
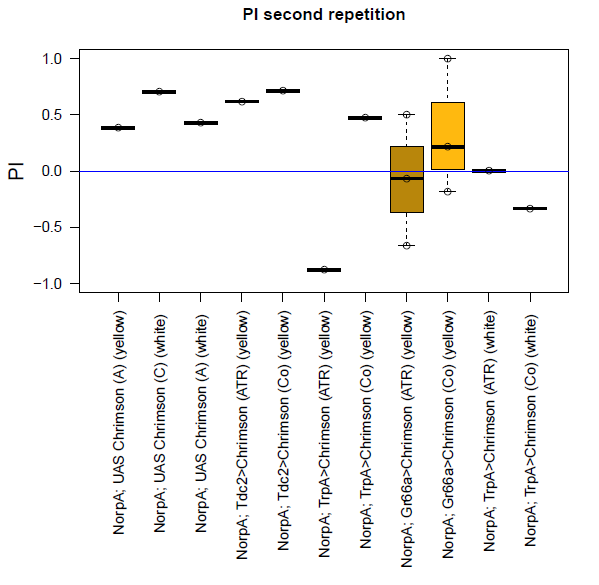
The most suitable light condition for the screening was pulsed light (20 Hz, 10 ms pulse width, 1500-2000 lx), which was favored since neurons seem to be activated more efficiently in a phasic than in a tonic way (Inagaki et al., 2013). Furthermore we assumed that constant light could induce abnormal levels of neuronal activity, which could lead to excitotoxicity. The best position of the light source was at the outside of a short transparent tube, one on top and one above, which guaranteed homogeneous illumination. 1 min trials with repetition and 1 day between repetitions worked best to rule out possible effects of the CO2 anesthesia on the experimental outcome. The genetic background did not seem to play a big role in the results of this setup, which is shown in the graph below (yellow vs. white group; screening performed before optimal parameters were found).
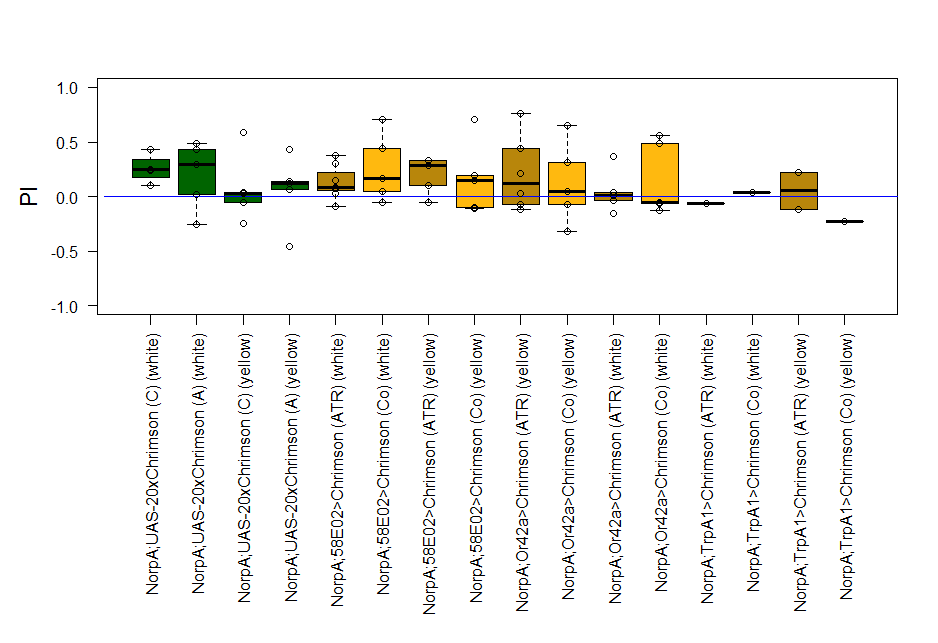
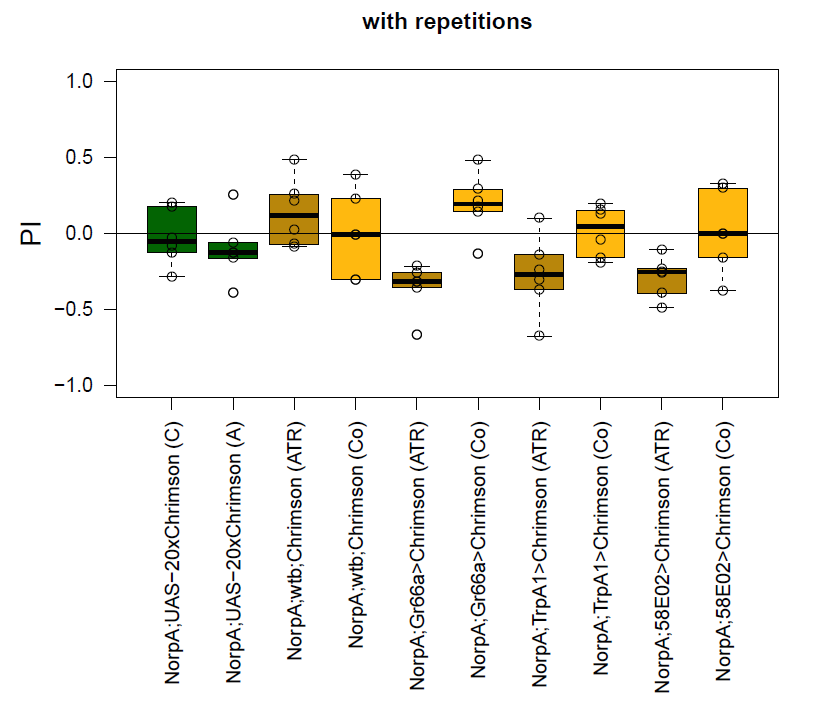
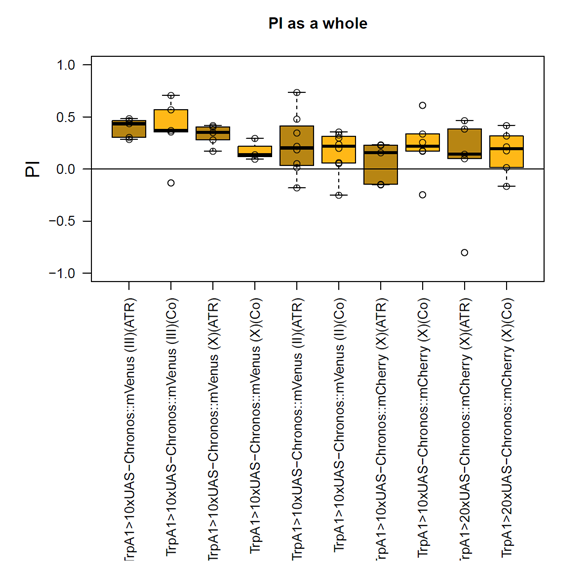
With described parameters we observed an escape behaviour towards the illuminated arm, indicating Gr66a, TrpA1 and 58E02 being neurons eliciting the avoidance behaviour when activated (we did not observe any effect for Or42a; data not shown). We furthermore found a strong enhancing effect of this behaviour due to the administration of ATR. The graph shows the mean PI of the two repetitions for each fly line with (ATR) or without (Co) ATR as food supplement (n = 6).
Experiment 2: Platform
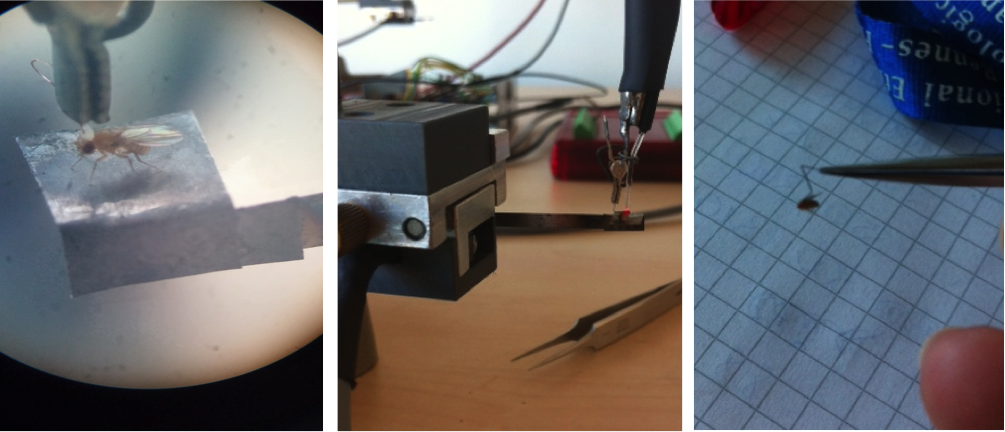
The second part of the internship aimed to optimize the experimental parameters of a custom-built platform, which represents a second method to assess preference/ avoidance behaviour, tested in an operant behaviour experiment by means of optogenetics. The platform is connected to a fiberglass, which allows light to be directly placed on top of a fly’s head to excite the assessed neurons. By walking to one or the other side, the flies can move the platform and thereby switch the light on and off. The pictures below show the platform holding a fly hooked with a copper hook on the neck (left) and a fly hooked on the thorax with a “double-L”-shaped wolfram hook (middle and right).
The experiment was performed with variation in following parameters:
- Light intensity:
→ 15 lx – 100 lx
- Fixation of the flies:
→ hooks glued on the thorax or the neck, facing either to the back or the front of the fly
→ different material used for the hooks: copper vs. wolfram
→ different shapes of hooks: triangle vs. “double-L”-shape
Since Gr66a showed promising results in the T-maze, this fly line was used to further optimize experimental parameters with the aim of confirming the observed avoidance effect.
Results:
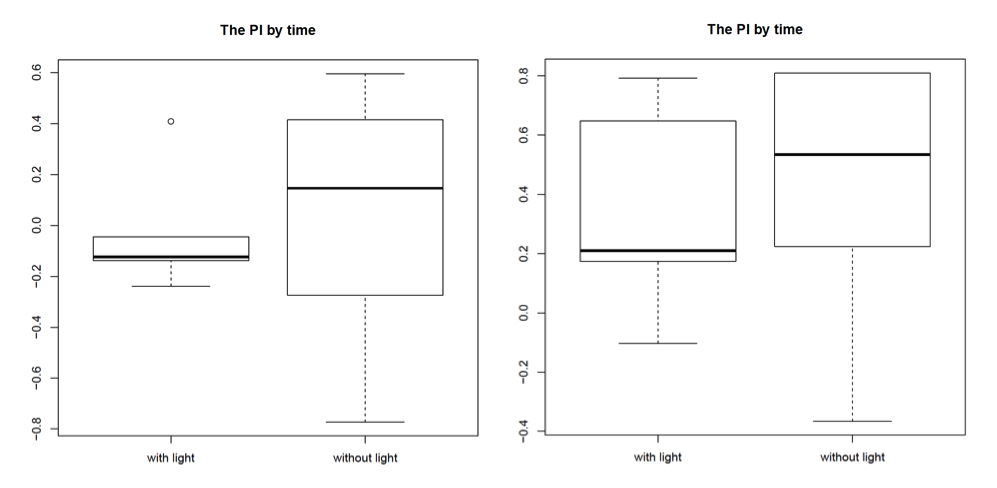
Most promising outcome was observed at 80 lx – 100 lx with “double-L”-shaped wolfram hooks facing to the back of the fly, as can be seen in the graphs for the PI by time (left side: 80 lx, right side: 100 lx; n = 3). In this combination the light reached the fly’s head and therefore the assessed neurons in the most efficient way. We found the thicker wolfram hooks to be more useful than the copper hooks since they were more tightly attached to the body and allowed us to position the flies very accurately under the light. Furthermore, we found a change in walking behaviour due to the positioning of the hooks on the flies. Hooks facing to the back of the flies, and therefore covering the wings, unfortunately seemed to make the flies more immobile. Also the bodypart on which the hooks were glued seemed to play a role, with hooks glued on the thorax being the most stable condition, since it allowed us to use more glue, which was needed due to the increased weight of the wolfram hooks.
Category: Optogenetics | No Comments
Optogenetics – My results vs. Lena’s results
on Monday, November 23rd, 2015 2:42 | by Katrin Hofweber
Last week I continued the experiments for the optogenetics. These are my results:
and these are Lena’s results:
Compared to Lena’s results, my results are a bit too positive.
Optogenetics (Chrimson) with the Tmaze
on Friday, November 20th, 2015 5:33 | by Katrin Hofweber
Last week, I started with the optogenetic experiment. Two days before the experiment, I put male flies into little vials (lightproof) containing standard food medium and I added a dab of yeast mixed with eihter ethanol (for control group) or ATR (= all-trans-retinal) (for experiment group).
These are the experimental conditions:
~ 1600 lx; 20 Hz; 10 ms puls width; short tubes (transparent tube with red light and an opaque dark tube); 30 sec in the elevator; 1 min testing; 4 hours between the first testing and the repetition;
Category: Optogenetics | No Comments