Graph for Darkpink2
on Monday, June 25th, 2018 1:34 | by Avani Koparkar
Our experiments are performed after blinding ie we do not know the genotype of the flies tested. Code for this line is Darkpink2. Intensity was approximately 400 Lux. The frequency of yellow light was 20Hz with 50:50 duty cycle.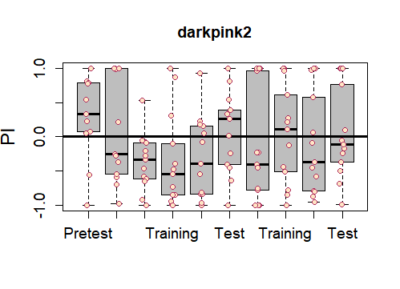

Category: Operant learning, Optogenetics | No Comments
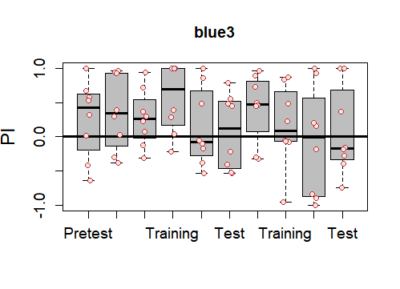
Graph for blue3
on Monday, June 25th, 2018 1:33 | by Avani Koparkar
Category: Operant learning, Optogenetics | No Comments
T-Maze experiments : screen results as on 25-06-2018
on Monday, June 25th, 2018 1:13 | by Naman Agrawal
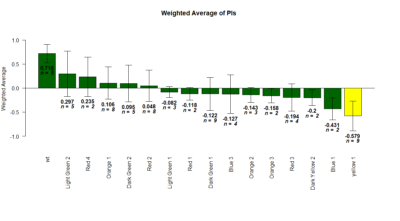
Yellow 1 (Positive Control): Gr28bd-G4, TrpA1-G4
Parameters:
Light: intensity (500 Lux side, 1000 Lux bottom)
frequency = 20Hz
Delay = 1 ms
Duration = 9.9 ms
volts = 6.4
Category: genetics, lab.brembs.net, neuronal activation, open science, Operant learning, Optogenetics | No Comments
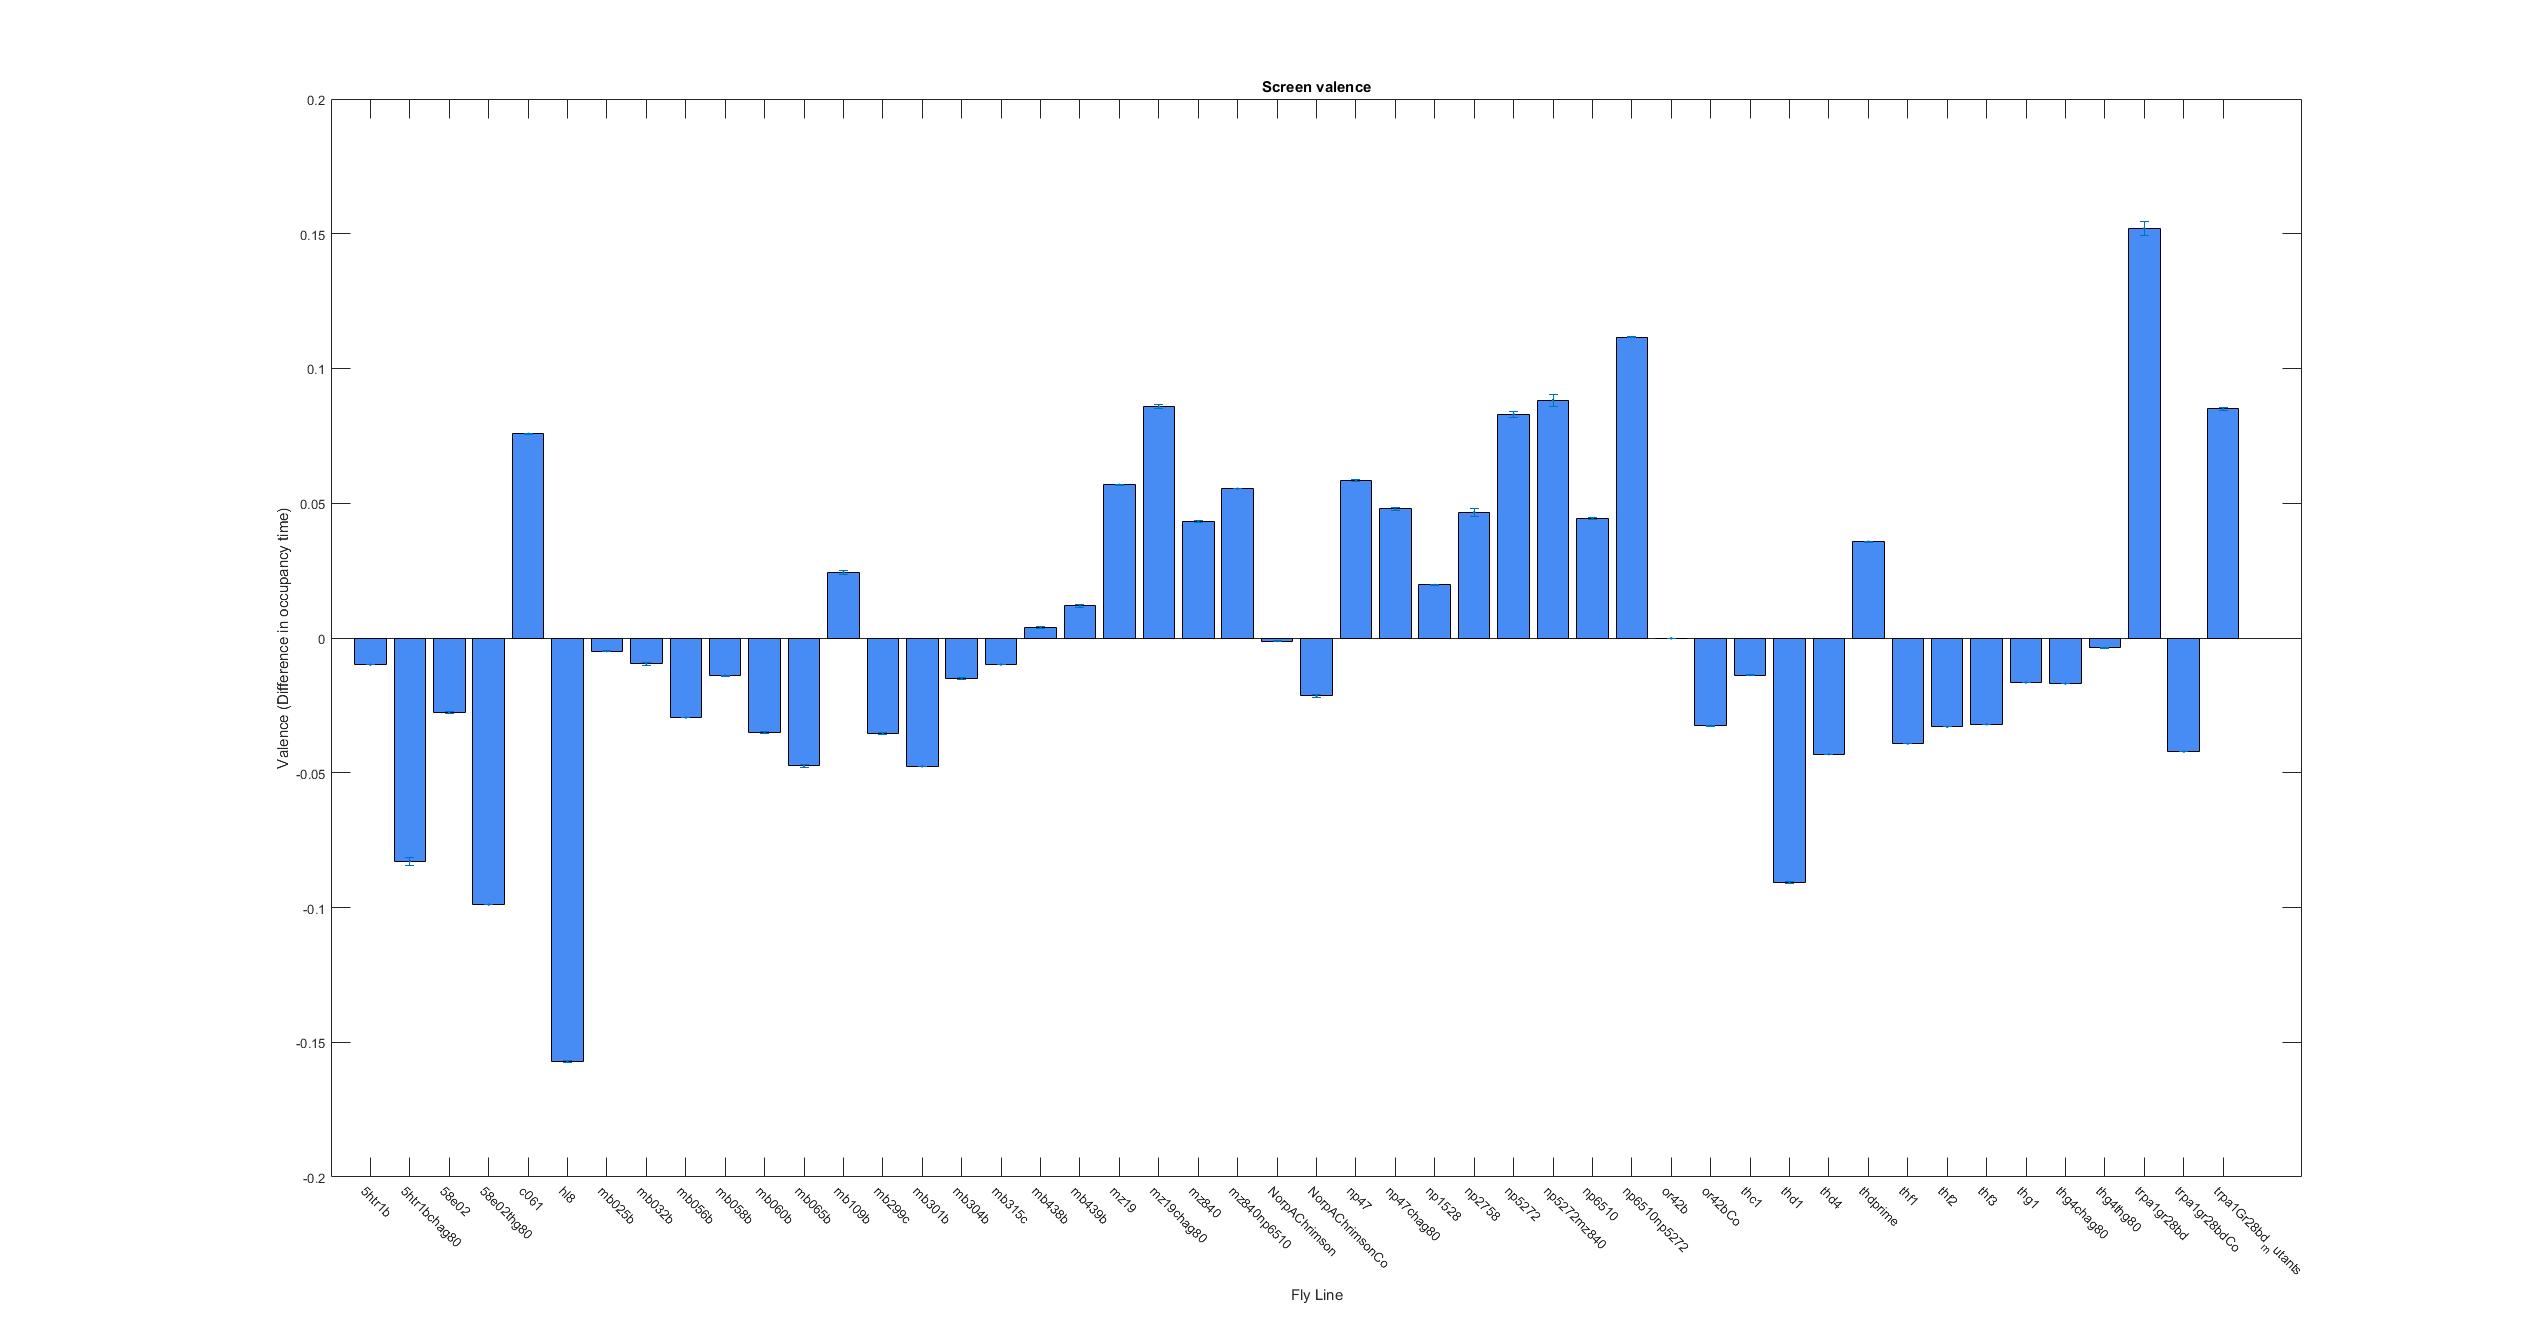
Making new ratios for Y-maze
on Monday, June 18th, 2018 1:55 | by Christian Rohrsen
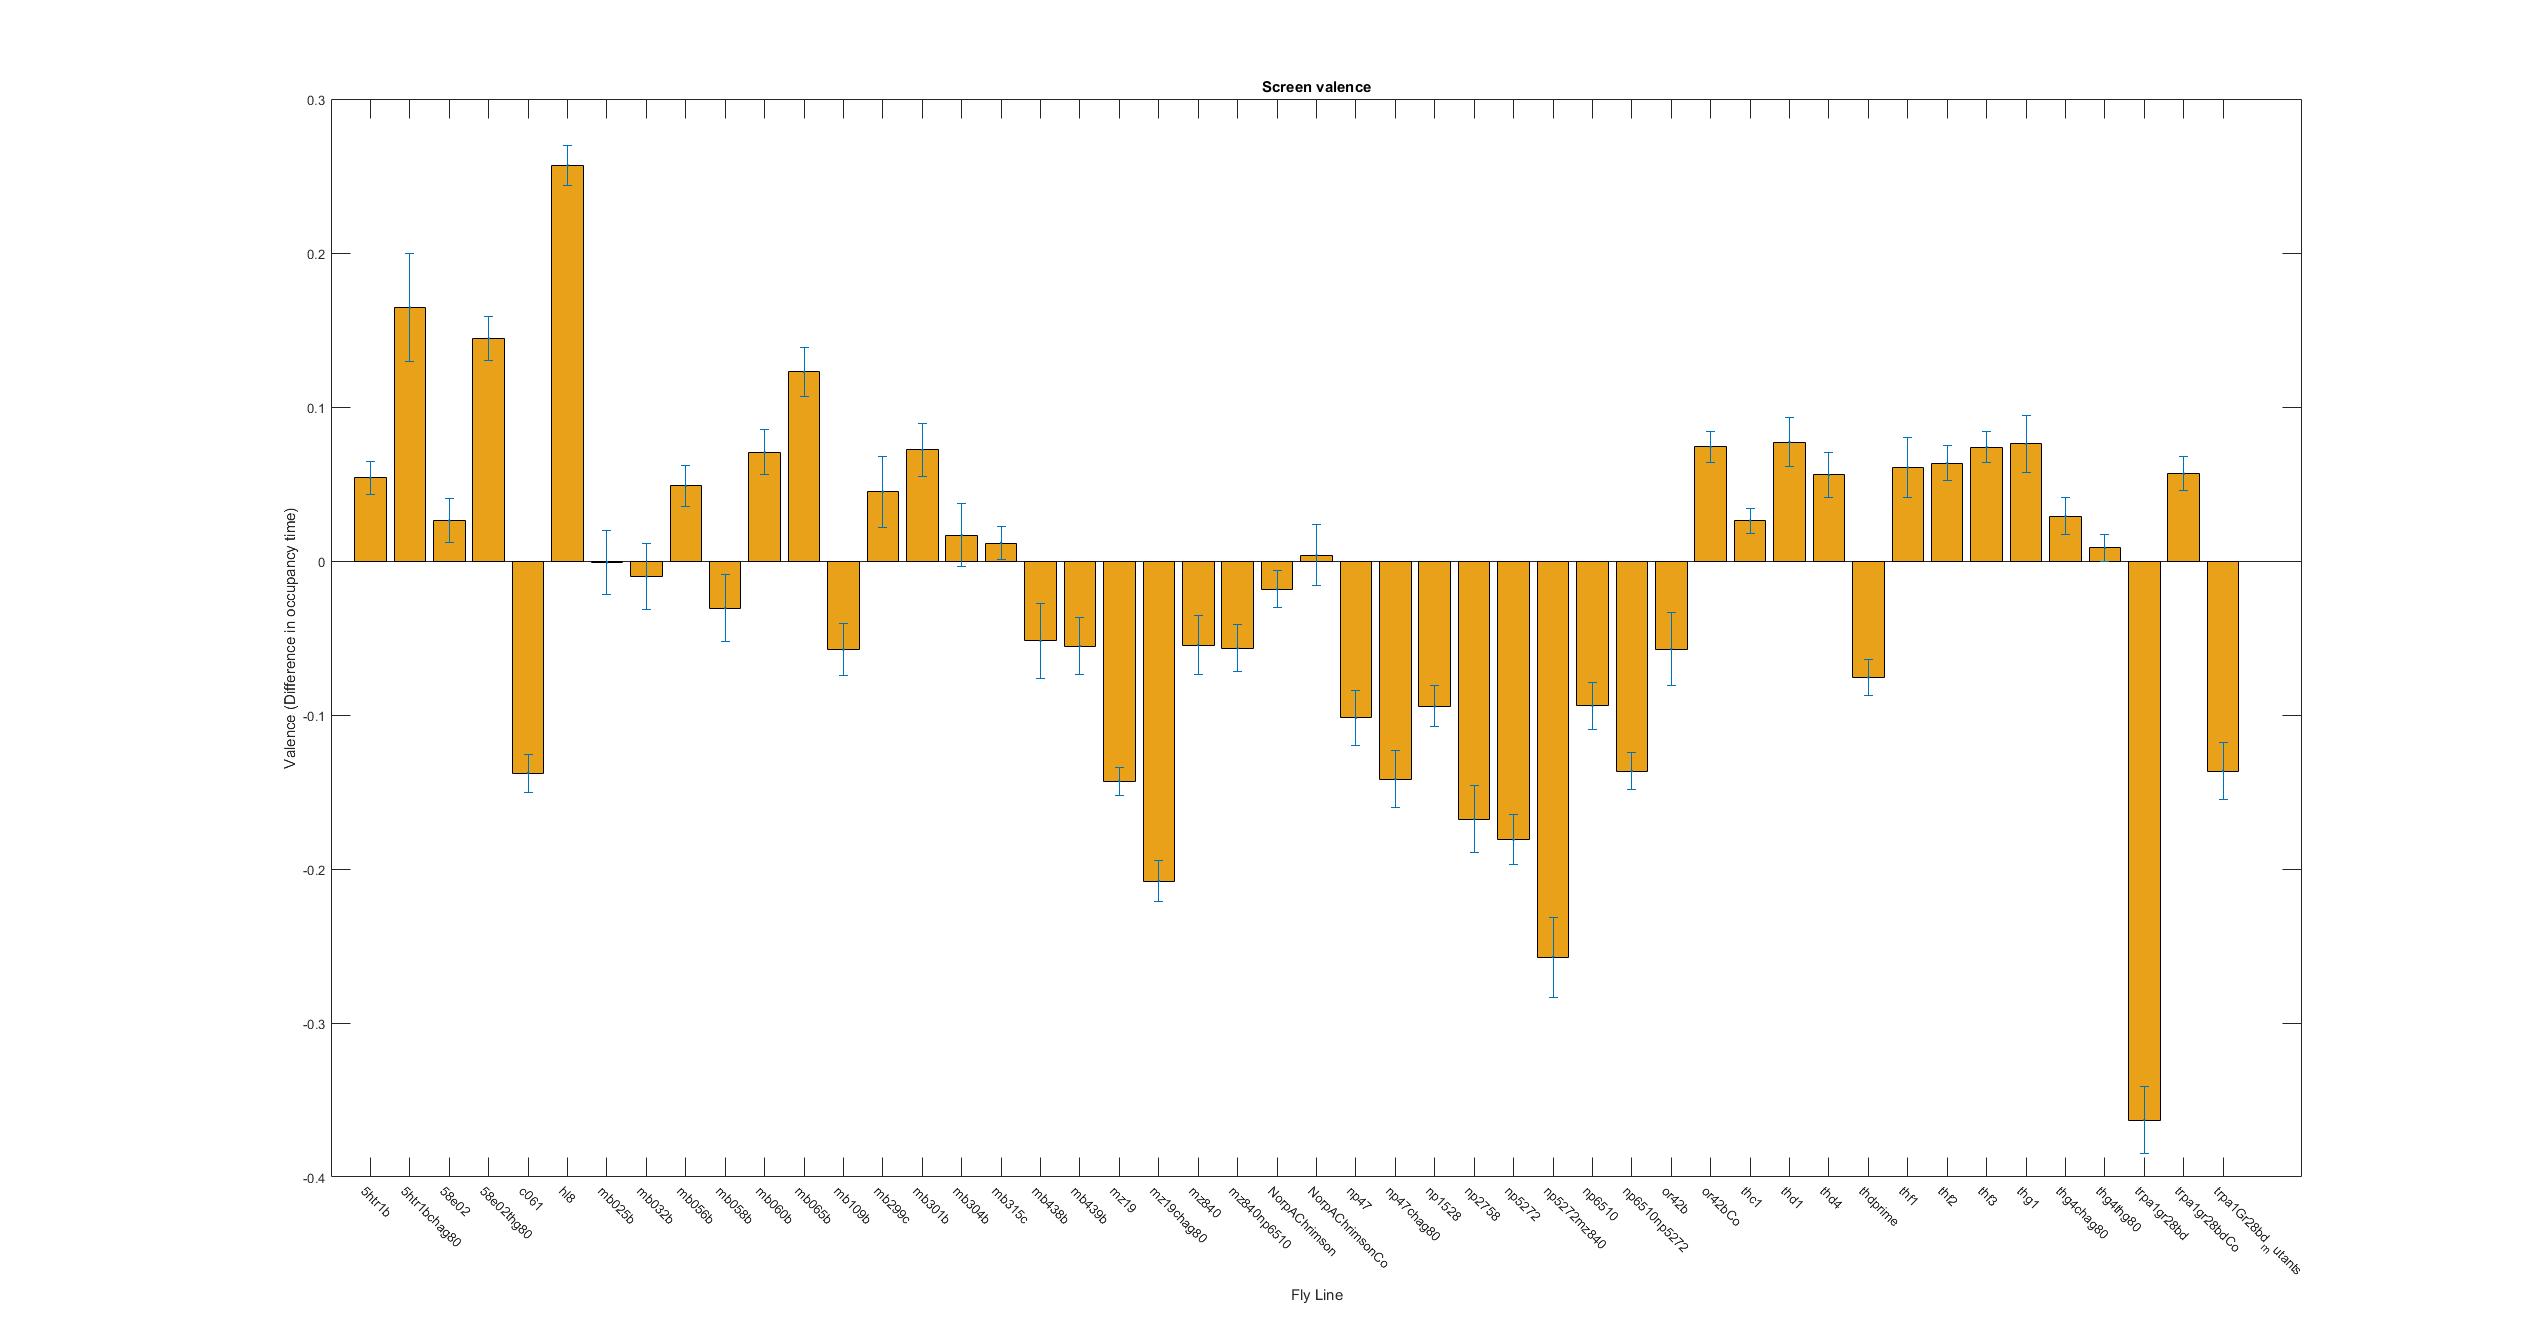
This is just to show that I am trying to find a new ratio so that all graphs have from -1 to +1 ranges. That is why now the difference in occupancy time is divided by the total time. The same with the speed. Because speed differences are so subtle, the Y axis scale has to be lower
Graph for darkyellow2
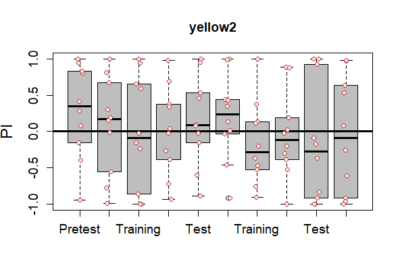
on Monday, June 18th, 2018 1:47 | by Avani Koparkar
Our experiments are performed after blinding ie we do not know the genotype of the flies tested. Code for this line is Yellow2. Intensity was approximately 400 Lux. The frequency of yellow light was 20Hz with 50:50 duty cycle.
Category: Operant learning, Optogenetics | No Comments
Graph for Red2
on Monday, June 18th, 2018 1:44 | by Avani Koparkar
Our experiments are performed after blinding ie we do not know the genotype of the flies tested. Code for this line is Red2. Intensity was approximately 400 Lux. The frequency of yellow light was 20Hz with 50:50 duty cycle.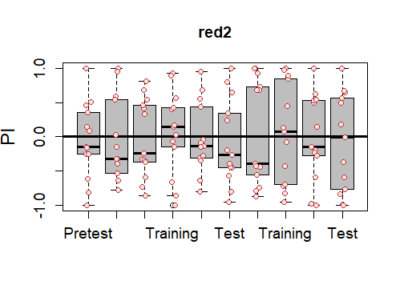
Category: Operant learning, Optogenetics | No Comments
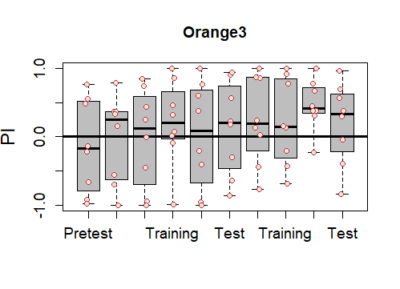
Graph for Orange3
on Monday, June 18th, 2018 1:42 | by Avani Koparkar
Our experiments are performed after blinding ie we do not know the genotype of the flies tested. Code for this line is Orange3. Intensity was approximately 400 Lux. The frequency of yellow light was 20Hz with 50:50 duty cycle.
Category: Operant learning, Optogenetics | No Comments
Initial screen results
on Monday, June 18th, 2018 1:15 | by Gaia Bianchini
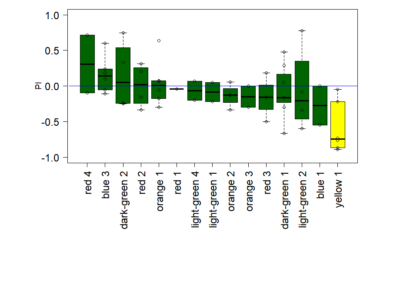
Yellow 1 (Positive Control): Gr28bd-G4, TrpA1-G4
Light: intensity (500 Lux side, 1000 Lux bottom), frequency (20Hz)
Category: crosses, genetics, lab.brembs.net, neuronal activation, open science, Operant learning, Optogenetics | No Comments
Red 1 Genotype
on Monday, June 18th, 2018 1:07 | by Saurabh Bedi
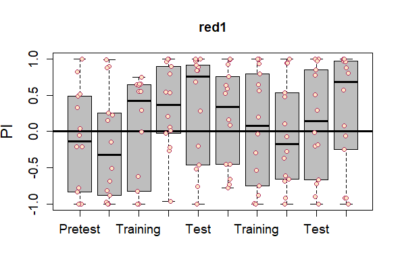
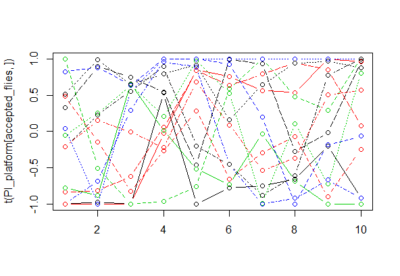
The platform experiment was done with us being blinded. We referred to the genotype as the Red1 Genotype. The light intensity was taken as approximately 400 lux as was decided by previous experiments. The duty cycle was 50:50 at a frequency of 20 Hz.
Category: Operant learning, Optogenetics | No Comments
Best intensity of light for crimson channel in Joystick experiment
on Wednesday, June 13th, 2018 12:27 | by Saurabh Bedi
Used positive control flies (NorpA; UAS Crimson) to check what intensity of light is better for activating the crimson channel and for studying learning behaviour in the joystick experiment. Tested light in 3 intensity ranges to check what would be best suited.
- Initially, we were doing experiments at 700 lux intensity. We saw results which possibly point out to damaging of neuronal populations due to such high-intensity light. As can be seen in the graph below, there is a strong aversion in the first 2 minutes of the training period. However, this aversion drastically decreases later and a very strong phenotype is not shown later. This may prove the hypothesis that high-intensity
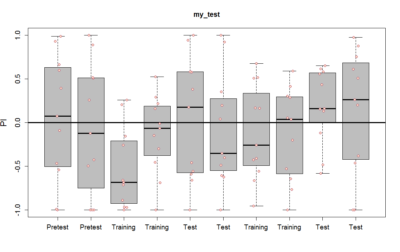 light(about 700 lux) may result in damage to neuronal populations.
 - So we tried with two more light intensities – 400 lux and 100 lux. The graphs for these are att
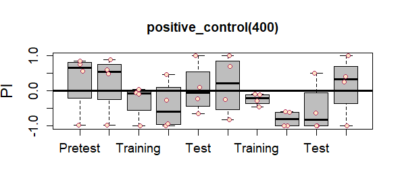
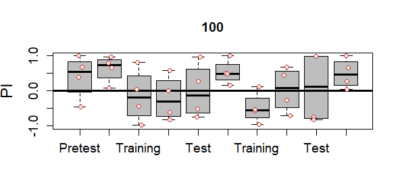 ached below. As can be clearly seen that now the results dont just show up for the first training segment but remain til the very end. This indicates that both 100lux and 400 lux light intensity are safe and do not disrupt neurons. Also, it can be clearly seen that there is a stronger and more pronounced effect with 400 lux light intensity. Thus we decide that 400 lux light intensity needs to be used for testing crimson channel expression for the joystick experiment.
Category: neuronal activation, Optogenetics | No Comments