Reinforcement scores for 8 genotypes
on Monday, June 25th, 2018 2:08 | by Saurabh Bedi
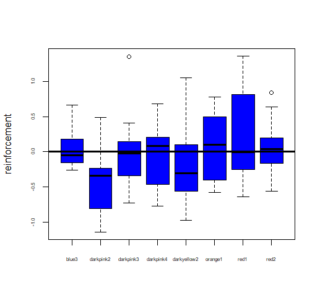
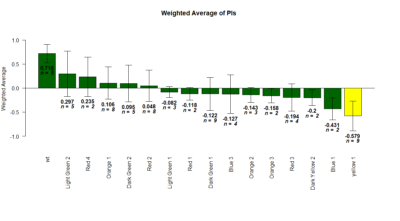
We wanted to measure learning and reinforcement in the flies for eight genotypes that we have tested as of now. For calculating the reinforcement scores we took the average of the two training periods combined PI scores and then subtract the PI value of the pretest period.
Reinforcement = average (combined training PI) – (combined pretest PI)
Below is the boxplot of the effect size for each fly for all these genotypes:-
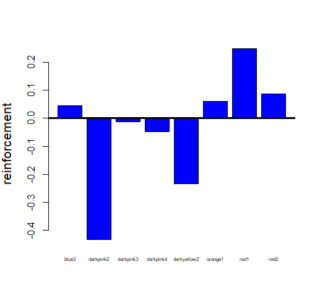
We then calculated the mean of these reinforcement values for each of the screens and below is a bargraph for these means:-

Category: Operant learning, Optogenetics | No Comments
orange1(genotype)-PI Barplot
on Monday, June 25th, 2018 1:54 | by Saurabh Bedi
Our experiments are performed after blinding ie we do not know the genotype of the flies tested. Code for this line is Orange1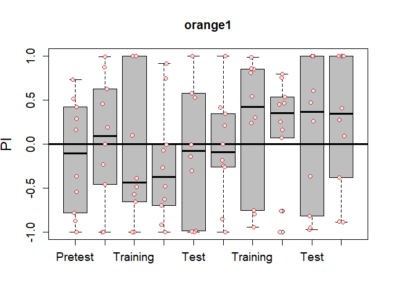 . Intensity was approximately 400 Lux. The frequency of yellow light was 20Hz with 50:50 duty cycle.
Category: Operant learning, Optogenetics | No Comments
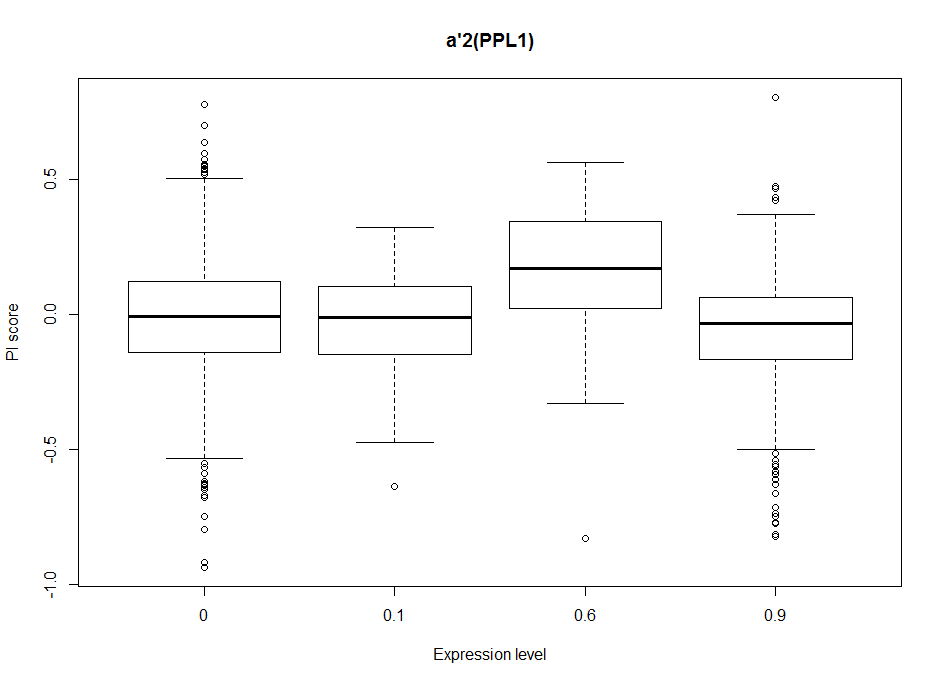
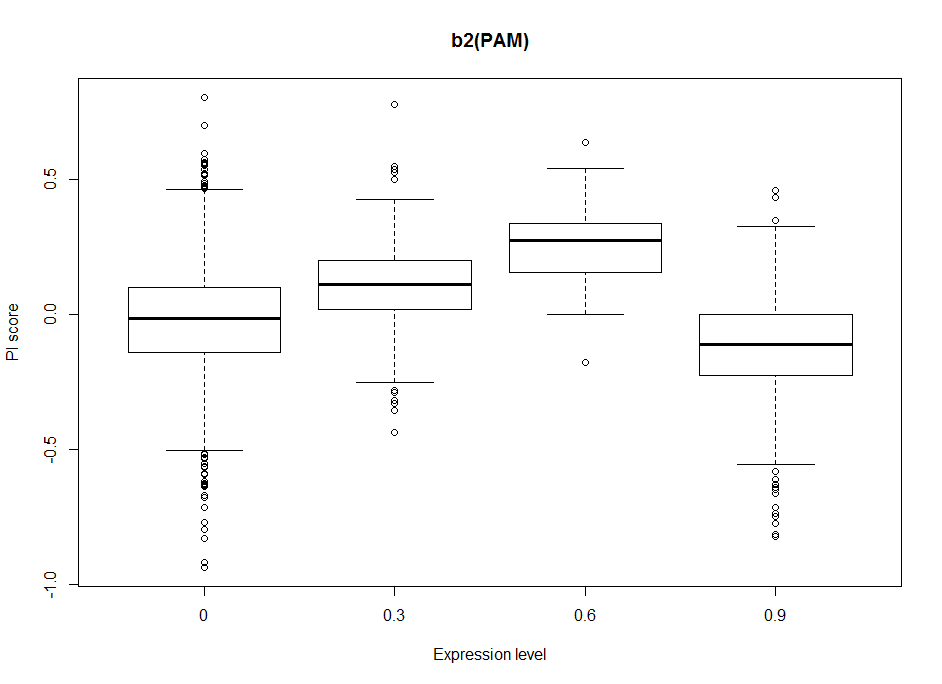
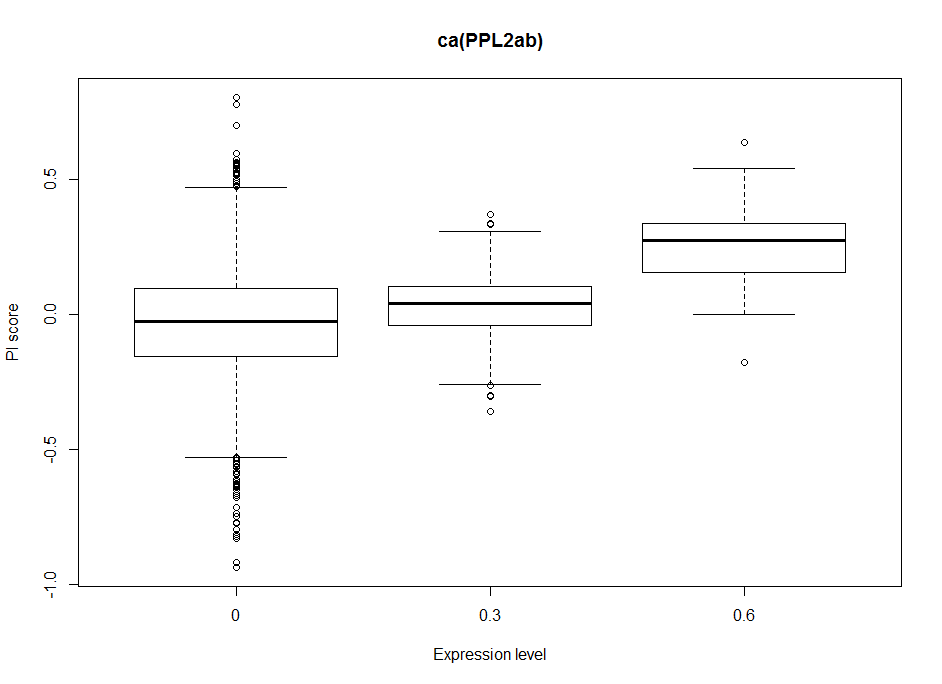
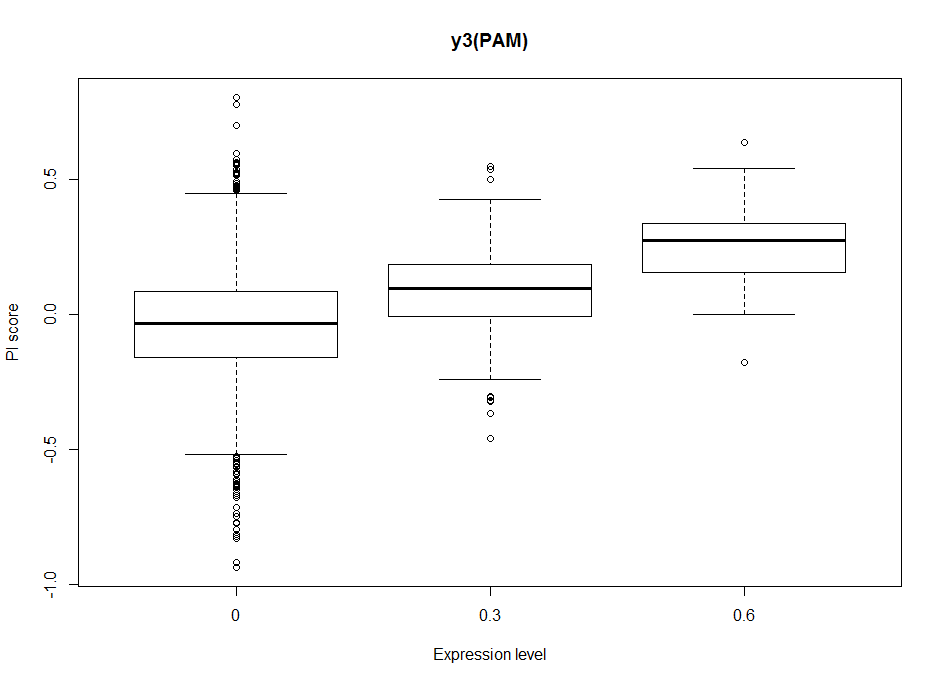
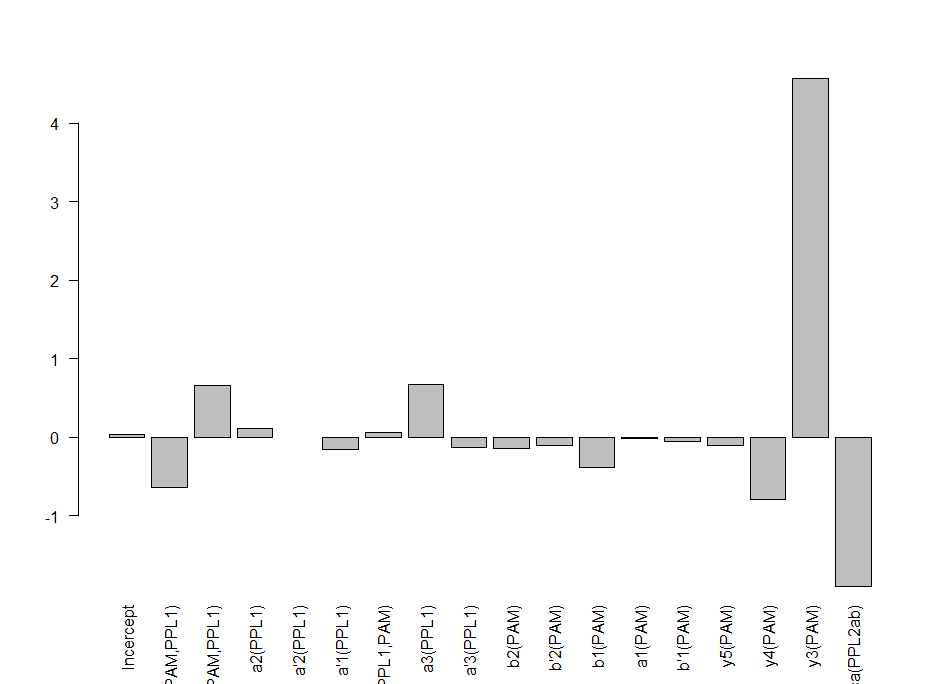
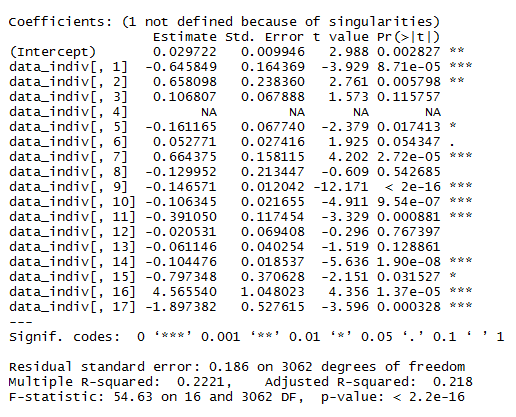
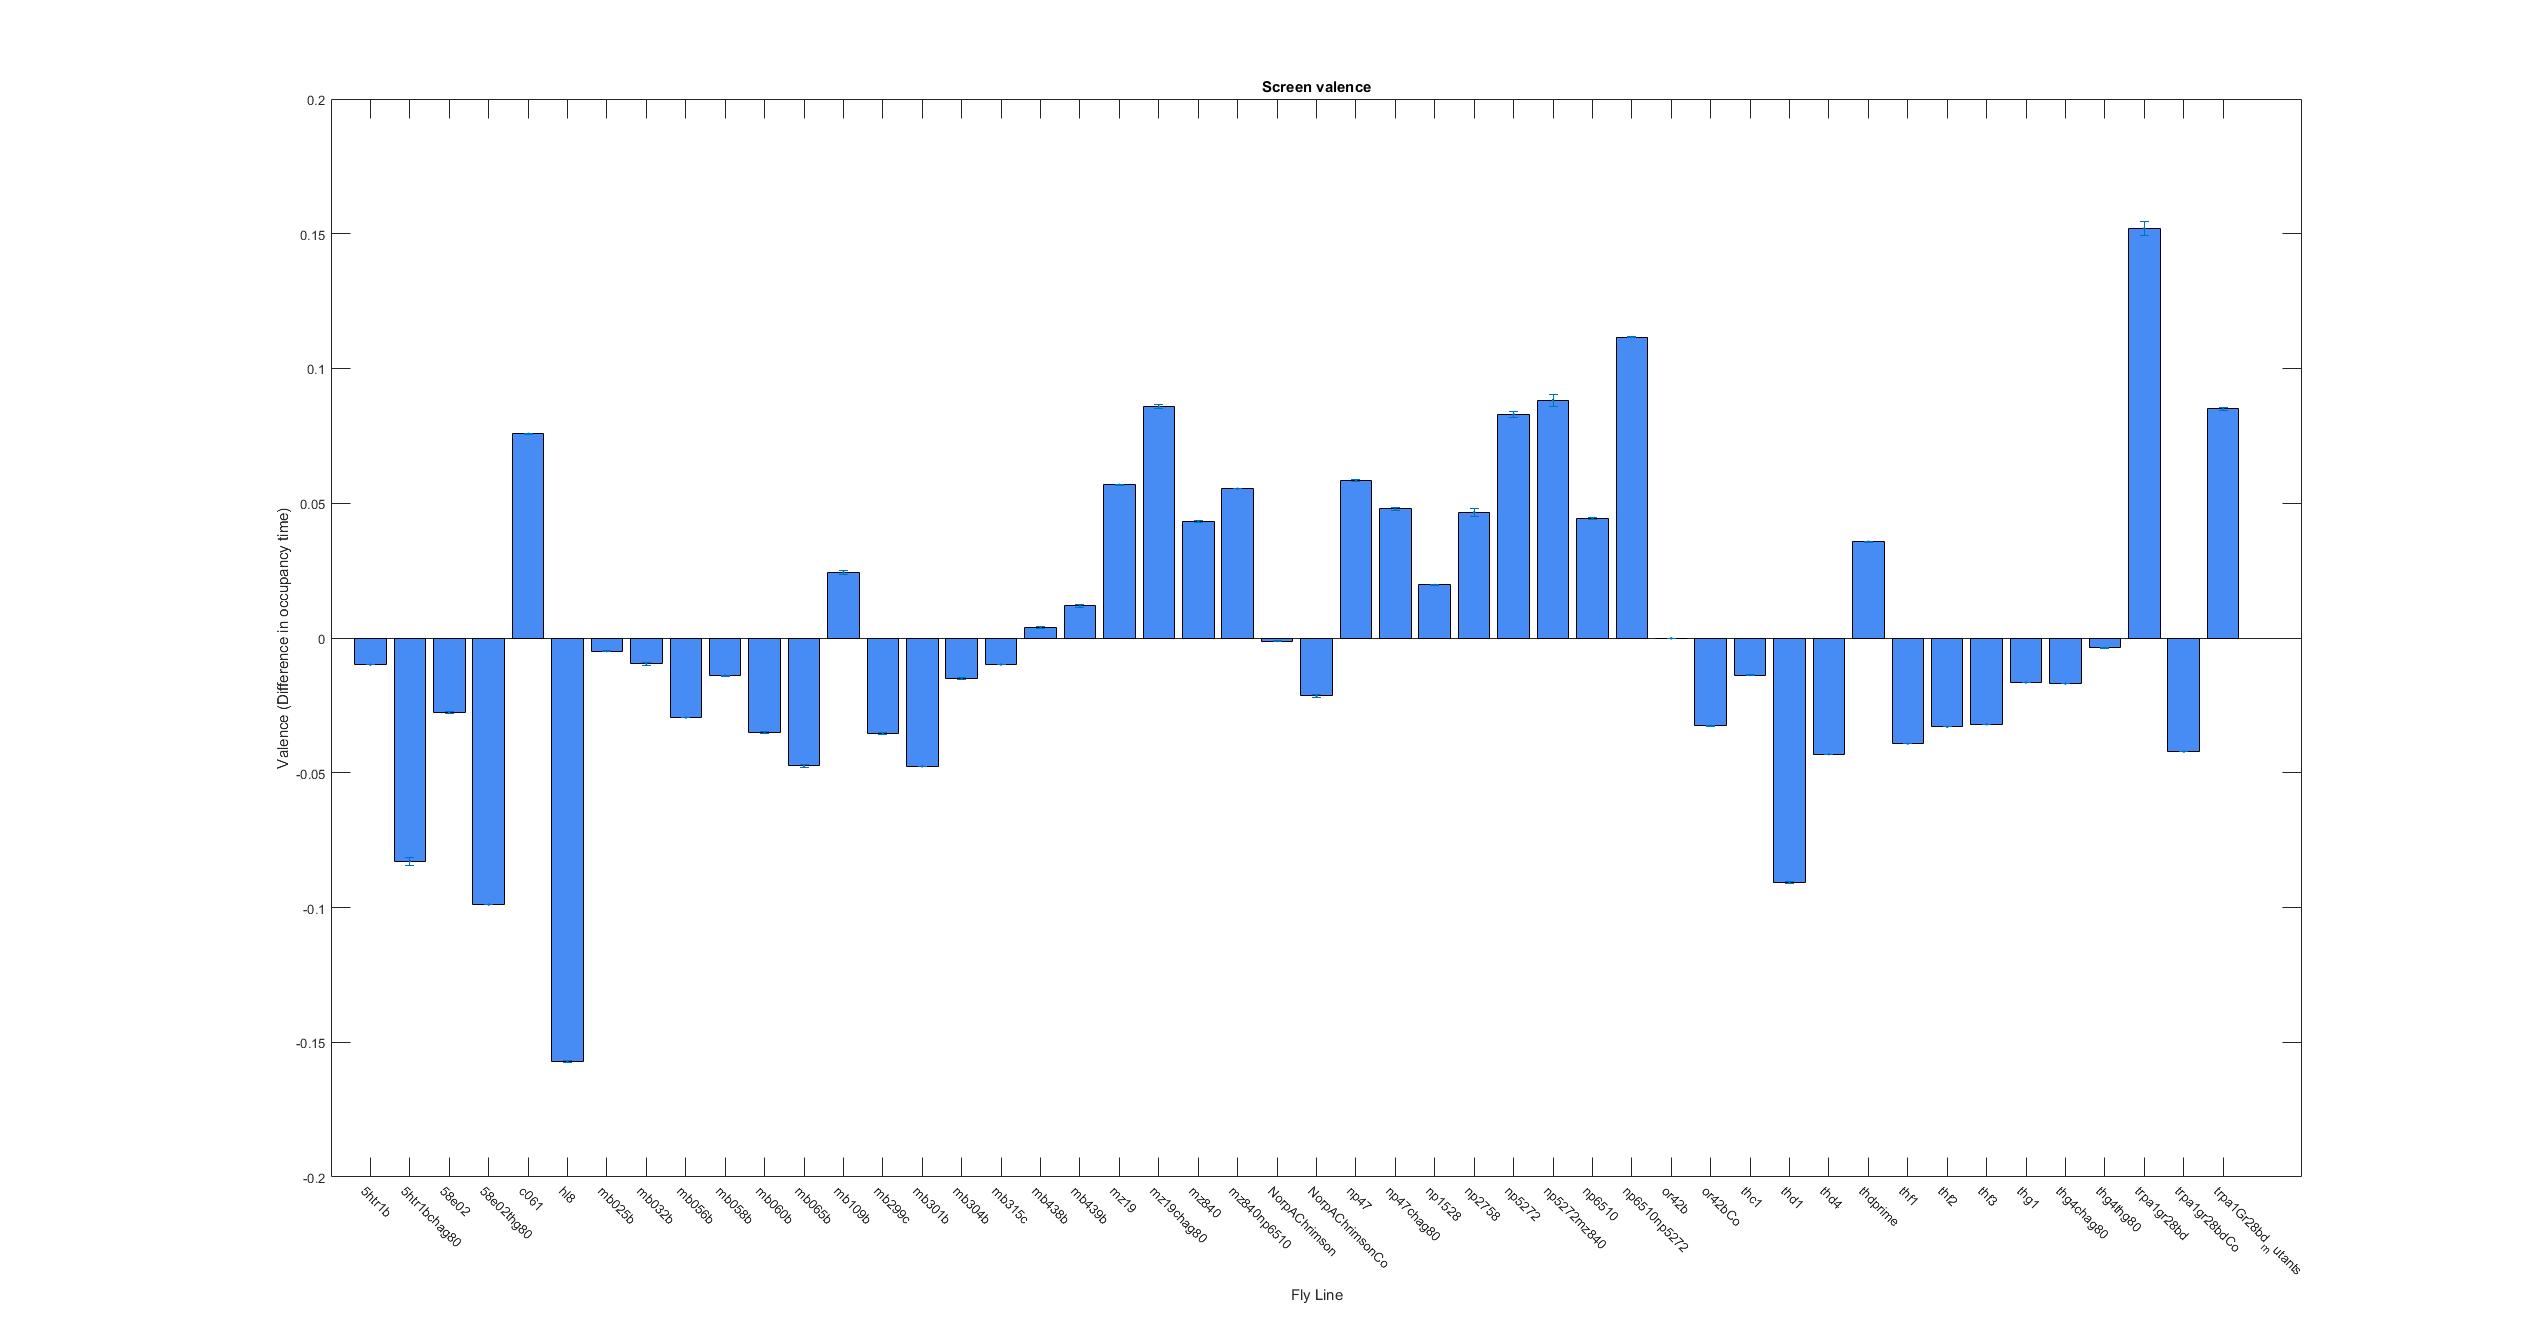
Modelling the valence of dopaminergic clusters from the Y-mazes
on Monday, June 25th, 2018 1:52 | by Christian Rohrsen
Dopaminergic clusters are differently targeted by the different Gal4s. Some of the express faintly, others stronger. Here I try to see if the dose-response curve (or expression-PI curve) seems to be linear or not. Here I put two examples from the 17 clusters, where the first two seem to have nonlinear curves, with and optimal expression level, and the last two seem to have a linear response curve.
This will be important for the modelling in order to decide to make a linear/nonlinear model. Down below I show the results from a linear model and it´s statistics. From Aso et al. 2012, one could see that activating the lines with TrpA1 shows a linear response curve. But in this case it does not necessarily seem to be the case. Therefore, light intensities might have an effect, as well as the expression level, and conclusion needs to be taken carefully.
In addition it is difficult to calculate this for all the clusters with just one single light intensity test, because not all clusters are expressed in several Gal4s to different level, so that we can estimate from there. So for the interesting lines we might need to make several experiments at different intensities, and see the dose response curve.
The G4s I have used for the modelling are the ones shown here.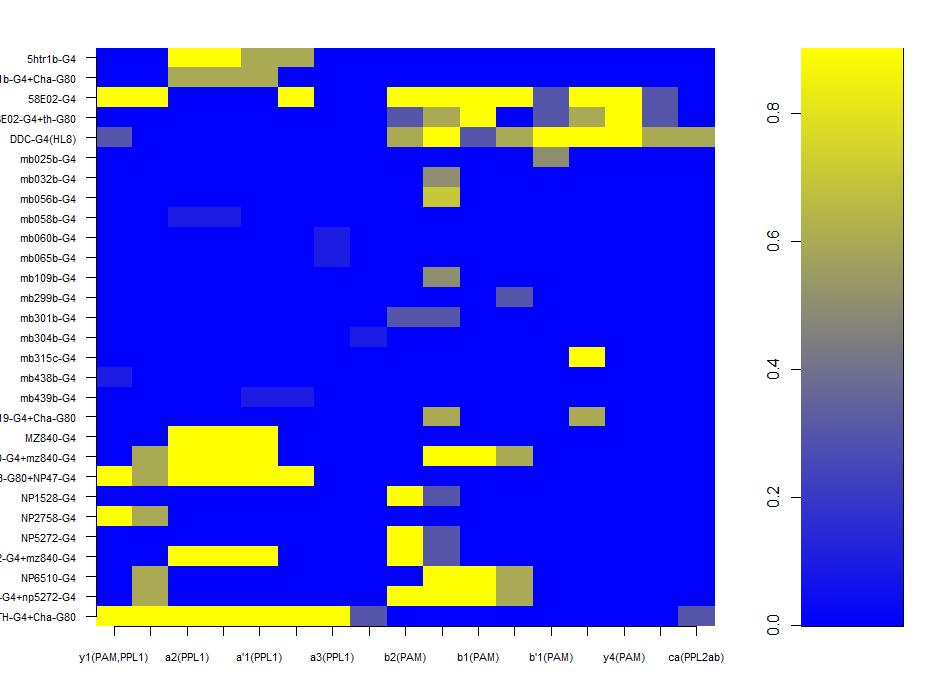
Graph for Darkpink4
on Monday, June 25th, 2018 1:37 | by Avani Koparkar
Our experiments are performed after blinding ie we do not know the genotype of the flies tested. Code for this line is Darkpink4. Intensity was approximately 400 Lux. The frequency of yellow light was 20Hz with 50:50 duty cycle.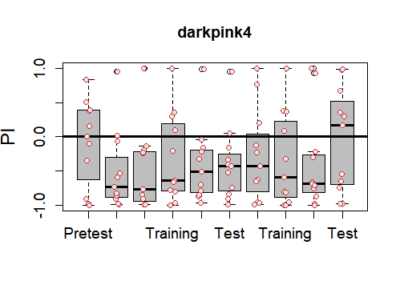
Category: Operant learning, Optogenetics | No Comments
Graph for Darkpink3
on Monday, June 25th, 2018 1:35 | by Avani Koparkar
Our experiments are performed after blinding ie we do not know the genotype of the flies tested. Code for this line is Darkpink3. Intensity was approximately 400 Lux. The frequency of yellow light was 20Hz with 50:50 duty cycle.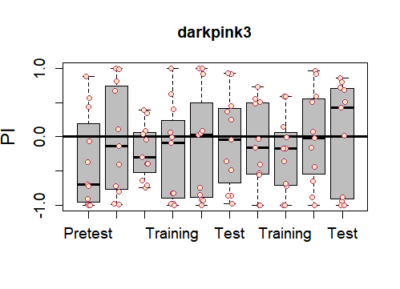
Category: Operant learning, Optogenetics | No Comments
Graph for Darkpink2
on Monday, June 25th, 2018 1:34 | by Avani Koparkar
Our experiments are performed after blinding ie we do not know the genotype of the flies tested. Code for this line is Darkpink2. Intensity was approximately 400 Lux. The frequency of yellow light was 20Hz with 50:50 duty cycle.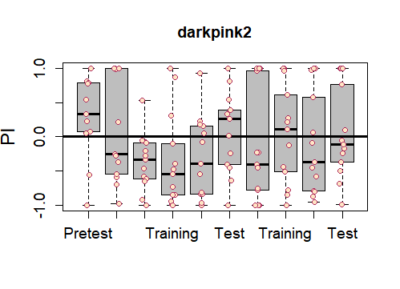
Category: Operant learning, Optogenetics | No Comments
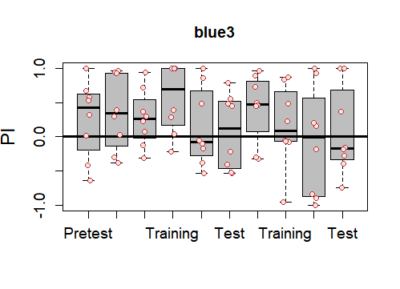
Graph for blue3
on Monday, June 25th, 2018 1:33 | by Avani Koparkar
Category: Operant learning, Optogenetics | No Comments
T-Maze experiments : screen results as on 25-06-2018
on Monday, June 25th, 2018 1:13 | by Naman Agrawal
Yellow 1 (Positive Control): Gr28bd-G4, TrpA1-G4
Parameters:
Light: intensity (500 Lux side, 1000 Lux bottom)
frequency = 20Hz
Delay = 1 ms
Duration = 9.9 ms
volts = 6.4
Category: genetics, lab.brembs.net, neuronal activation, open science, Operant learning, Optogenetics | No Comments
Making new ratios for Y-maze
on Monday, June 18th, 2018 1:55 | by Christian Rohrsen
This is just to show that I am trying to find a new ratio so that all graphs have from -1 to +1 ranges. That is why now the difference in occupancy time is divided by the total time. The same with the speed. Because speed differences are so subtle, the Y axis scale has to be lower
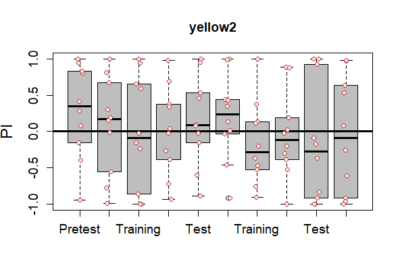
Graph for darkyellow2
on Monday, June 18th, 2018 1:47 | by Avani Koparkar
Our experiments are performed after blinding ie we do not know the genotype of the flies tested. Code for this line is Yellow2. Intensity was approximately 400 Lux. The frequency of yellow light was 20Hz with 50:50 duty cycle.
Category: Operant learning, Optogenetics | No Comments