Optimizing optomotor response, part 2
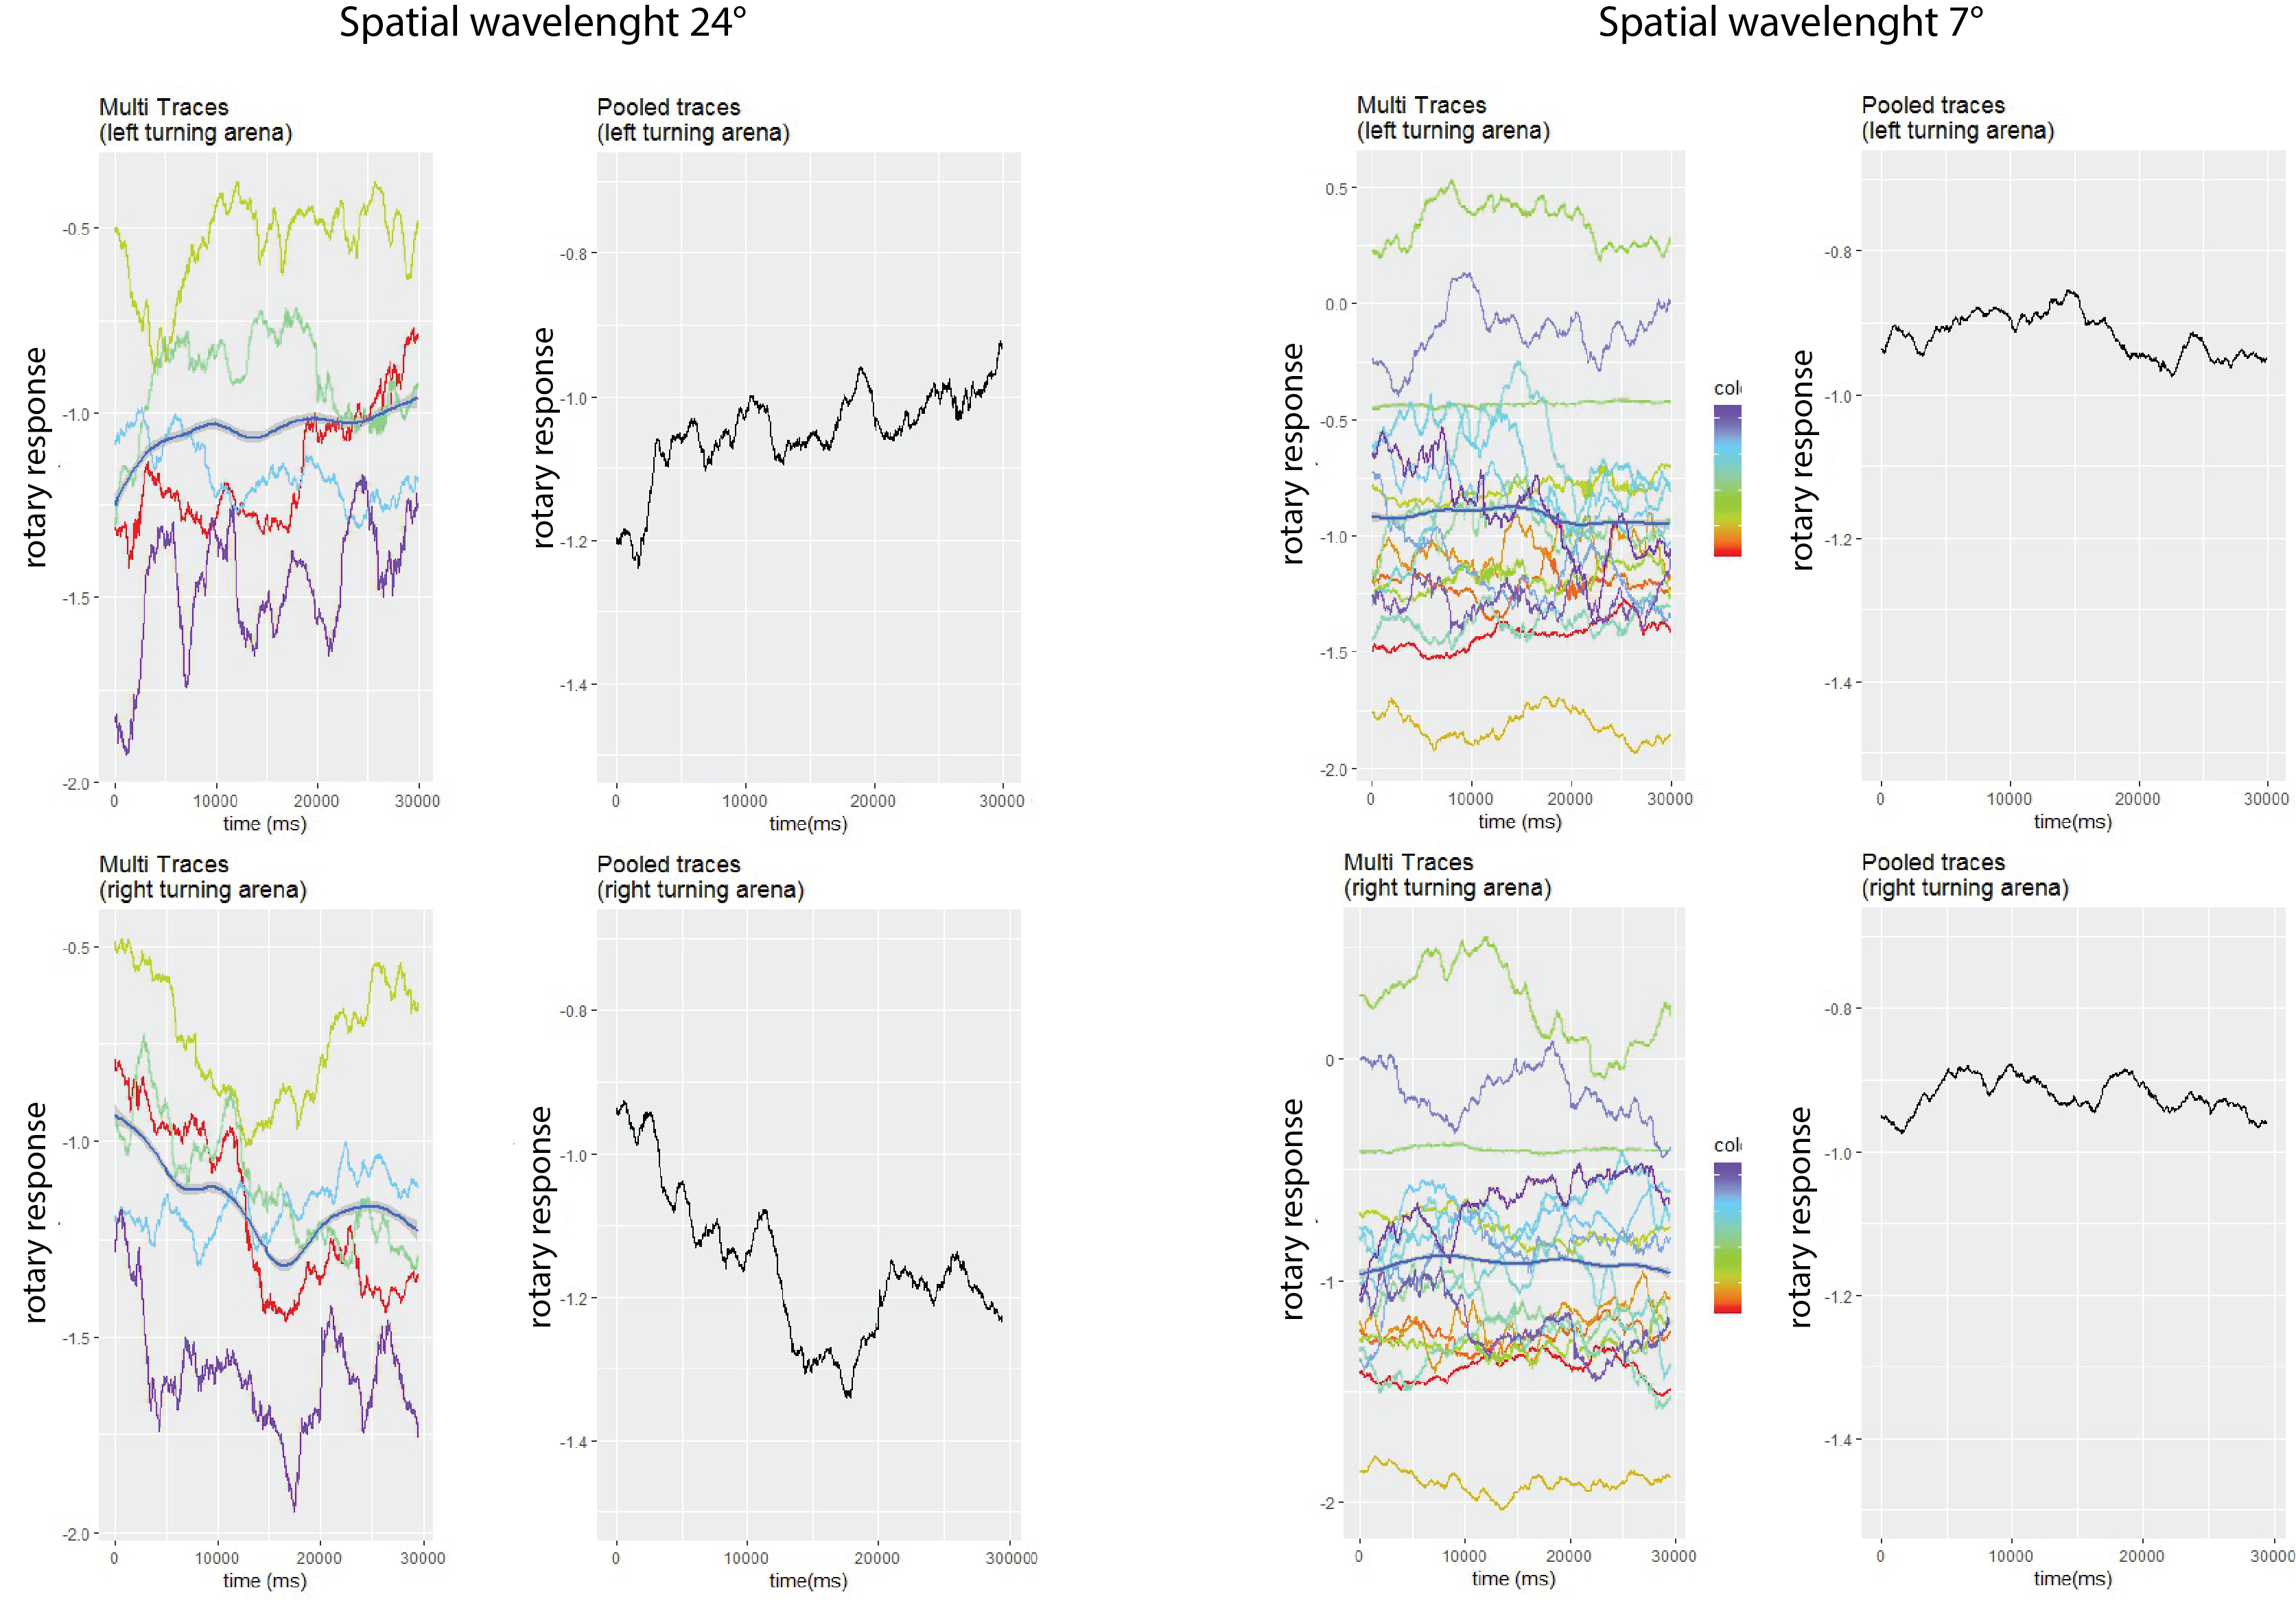
The optomotor stimulus consists of a striped arena with panoramic vertical stripes rotating horizontally around the vertical, or yaw axis. Depending on the spatial wavelenght (or spatial frequency, SF) the fly’s optomotor response (OR) is changing supposedly to reach a maximum between 20-40°
(with a pattern motion of 0° ) . As the panoramic stripes are rotating a tethered fly will actively steer in the direction of the motion. After its maximum the OR gradually decreases with an increasing spatial frequency to finally reach 0 around 9.6-6.3°. A tendency to negative/reversed OR has been observed as the SF reaches 6.3°.
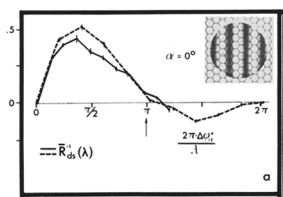
This experiment has been shown before in 1976 by E. Buchner, Elementary movement detectors in an insect visual system. Bioi Cybern 24:85- 101, Figure 8 page 93. Attaching Figure 8 as a reference.
Getting cyan in the projector
The projector we are using is not an LCD projector. It is a DLP projector with a RGB LED light engine using a digital micromirror device to project the image. I used the GUI to access the LED driver control which allows you to project each LED individually or in combination. Forcing it into manual mode changed the way the projector displayed the colors. The projector takes in our case as input 24-bit RGB data at a frame rate of up to 120-Hz. The 120-Hz value is the upper limit of the projector and is only allowed using HDMI 2.1 cables. I am fairly sure that is not what I am using, but instead a standard HDMI allowing 60 Hz. This frame rate is composed of three colors (red, green, and blue) with each color equally divided in the frame rate. So using 120 Hz would allocate about 2.78 ms for each color, as we are using 60 Hz this number would be closer to 6 ms, the flickering I saw earlier is most likely a result of this.
However, accessing the manual mode of the LED driver control allows you to turn on the colors in pairs (or in 3 if using RGB). This got rid of the flickering
Habit formation, Registered Report
Started to write the manuscript for the registered report about Habit formation. Aiming for European Journal of Neuroscience.


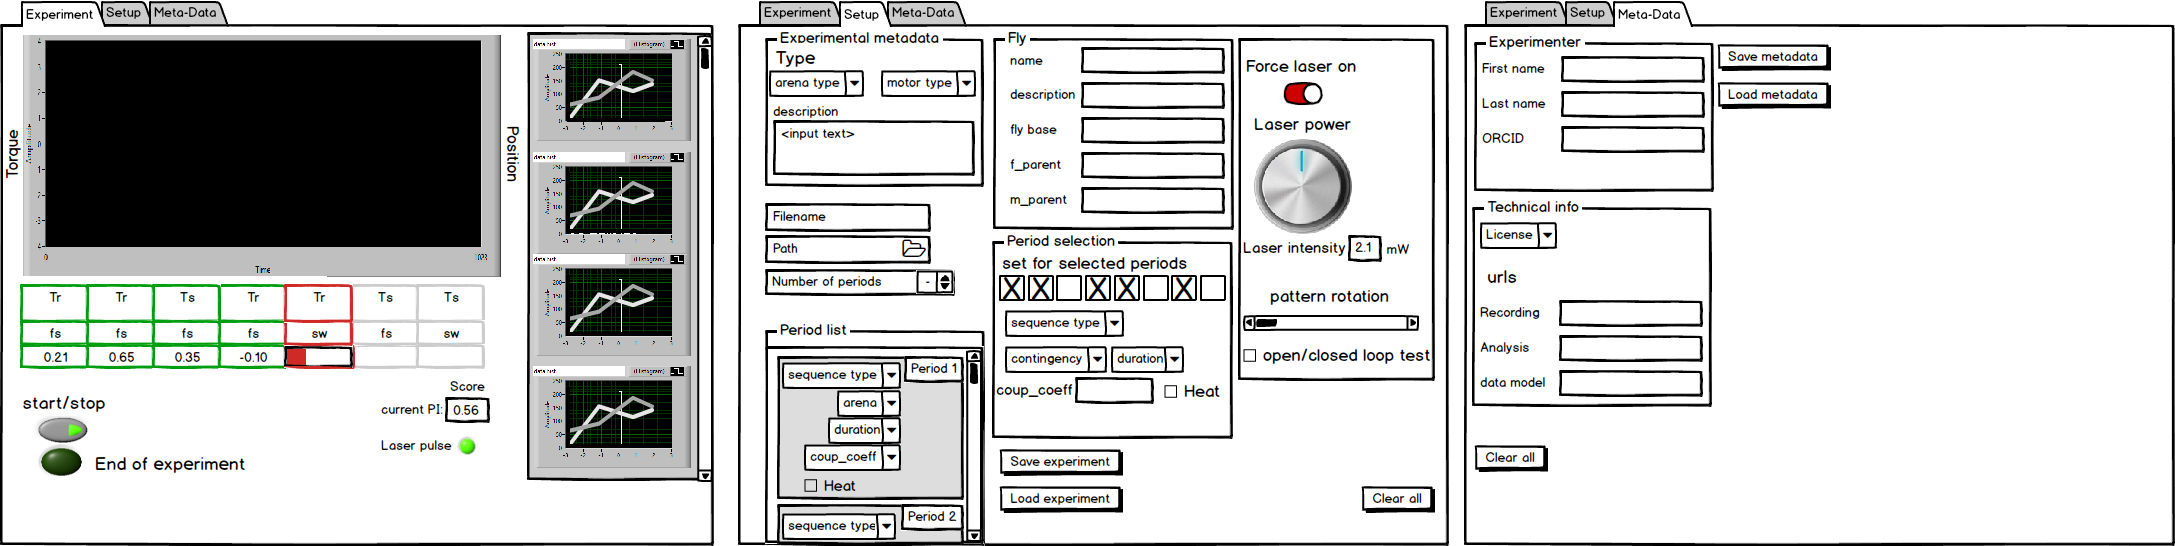
Software UI updates
Fpga transmission software has gotten a new user interface design. At least this is the preferred outline of how we would like the software to look like. Based on the limits of LabView some alterations will be made
Software stops measuring at the correct sample rate
Cyan in the LCD projector
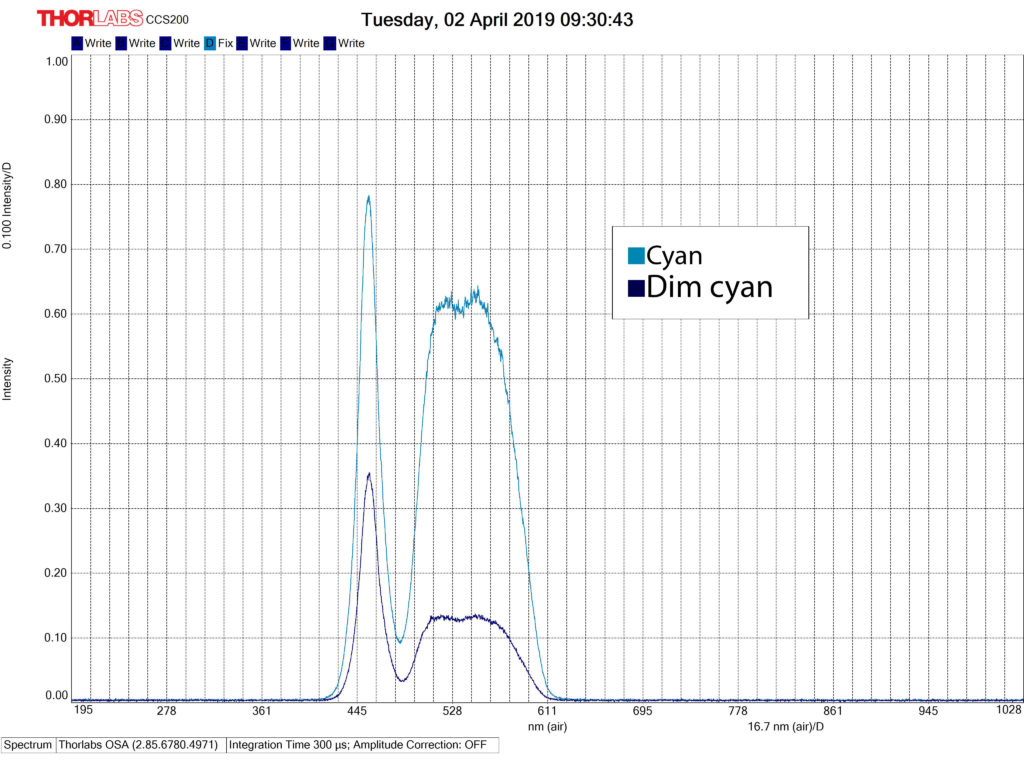
The LCD projector combines green and blue to form the color cyan. However, while using the spectrophotometer to record this wavelenght it seems to be alternating between green and blue to produce the color. The lights does not seem to be illuminated simultaneously.
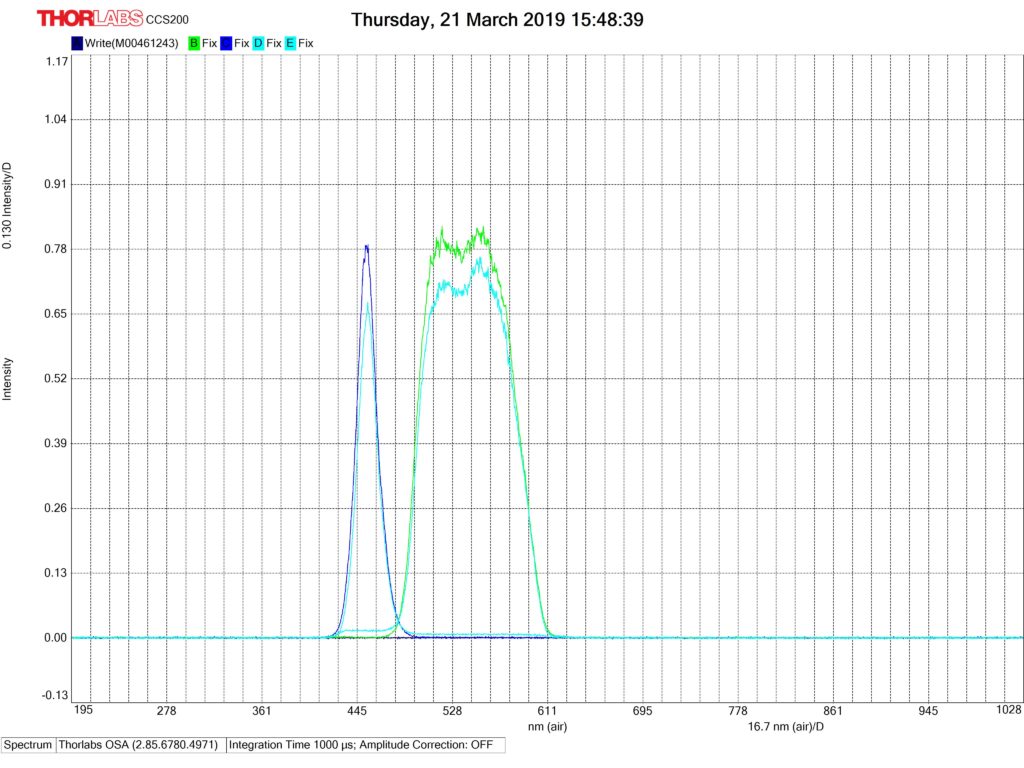
This picture is composed of four different channels. One each for green and blue, and two channels for cyan. The cyan color needed to be put into separate channels because they were never illuminated at the same time.
Inhibition of habit formation screening (MB011B)
A flight performance test to see how the flies are behaving while flying. They have a slightly lower flight duration compared to the genetic controls but nothing that should impair them in the experiment.

The learning experiments are ongoing. I am doing n=15 for each line and each experiment, both Composite Control and also a Isolated Operant experiment. The Composite control experiment is done but I only got 13 flies for Isolated Operant. I do not want to preanalyze the data and will therefor post it when all the flies are done.
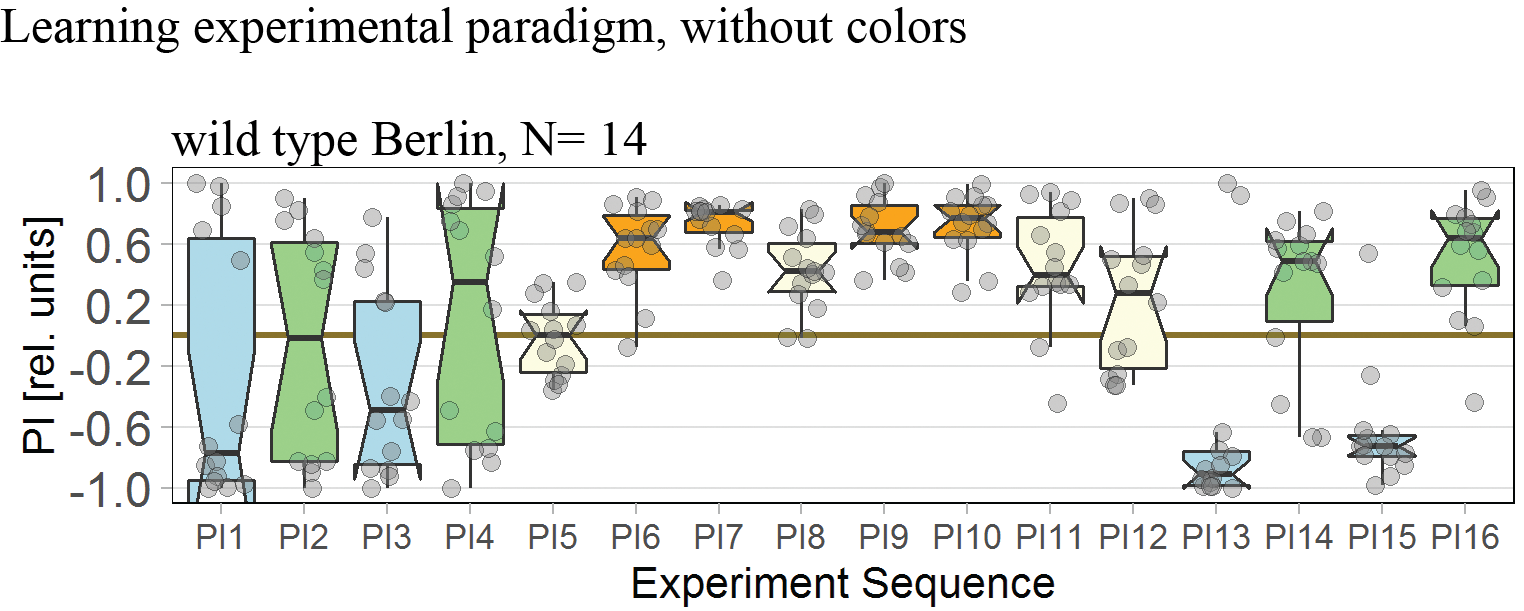
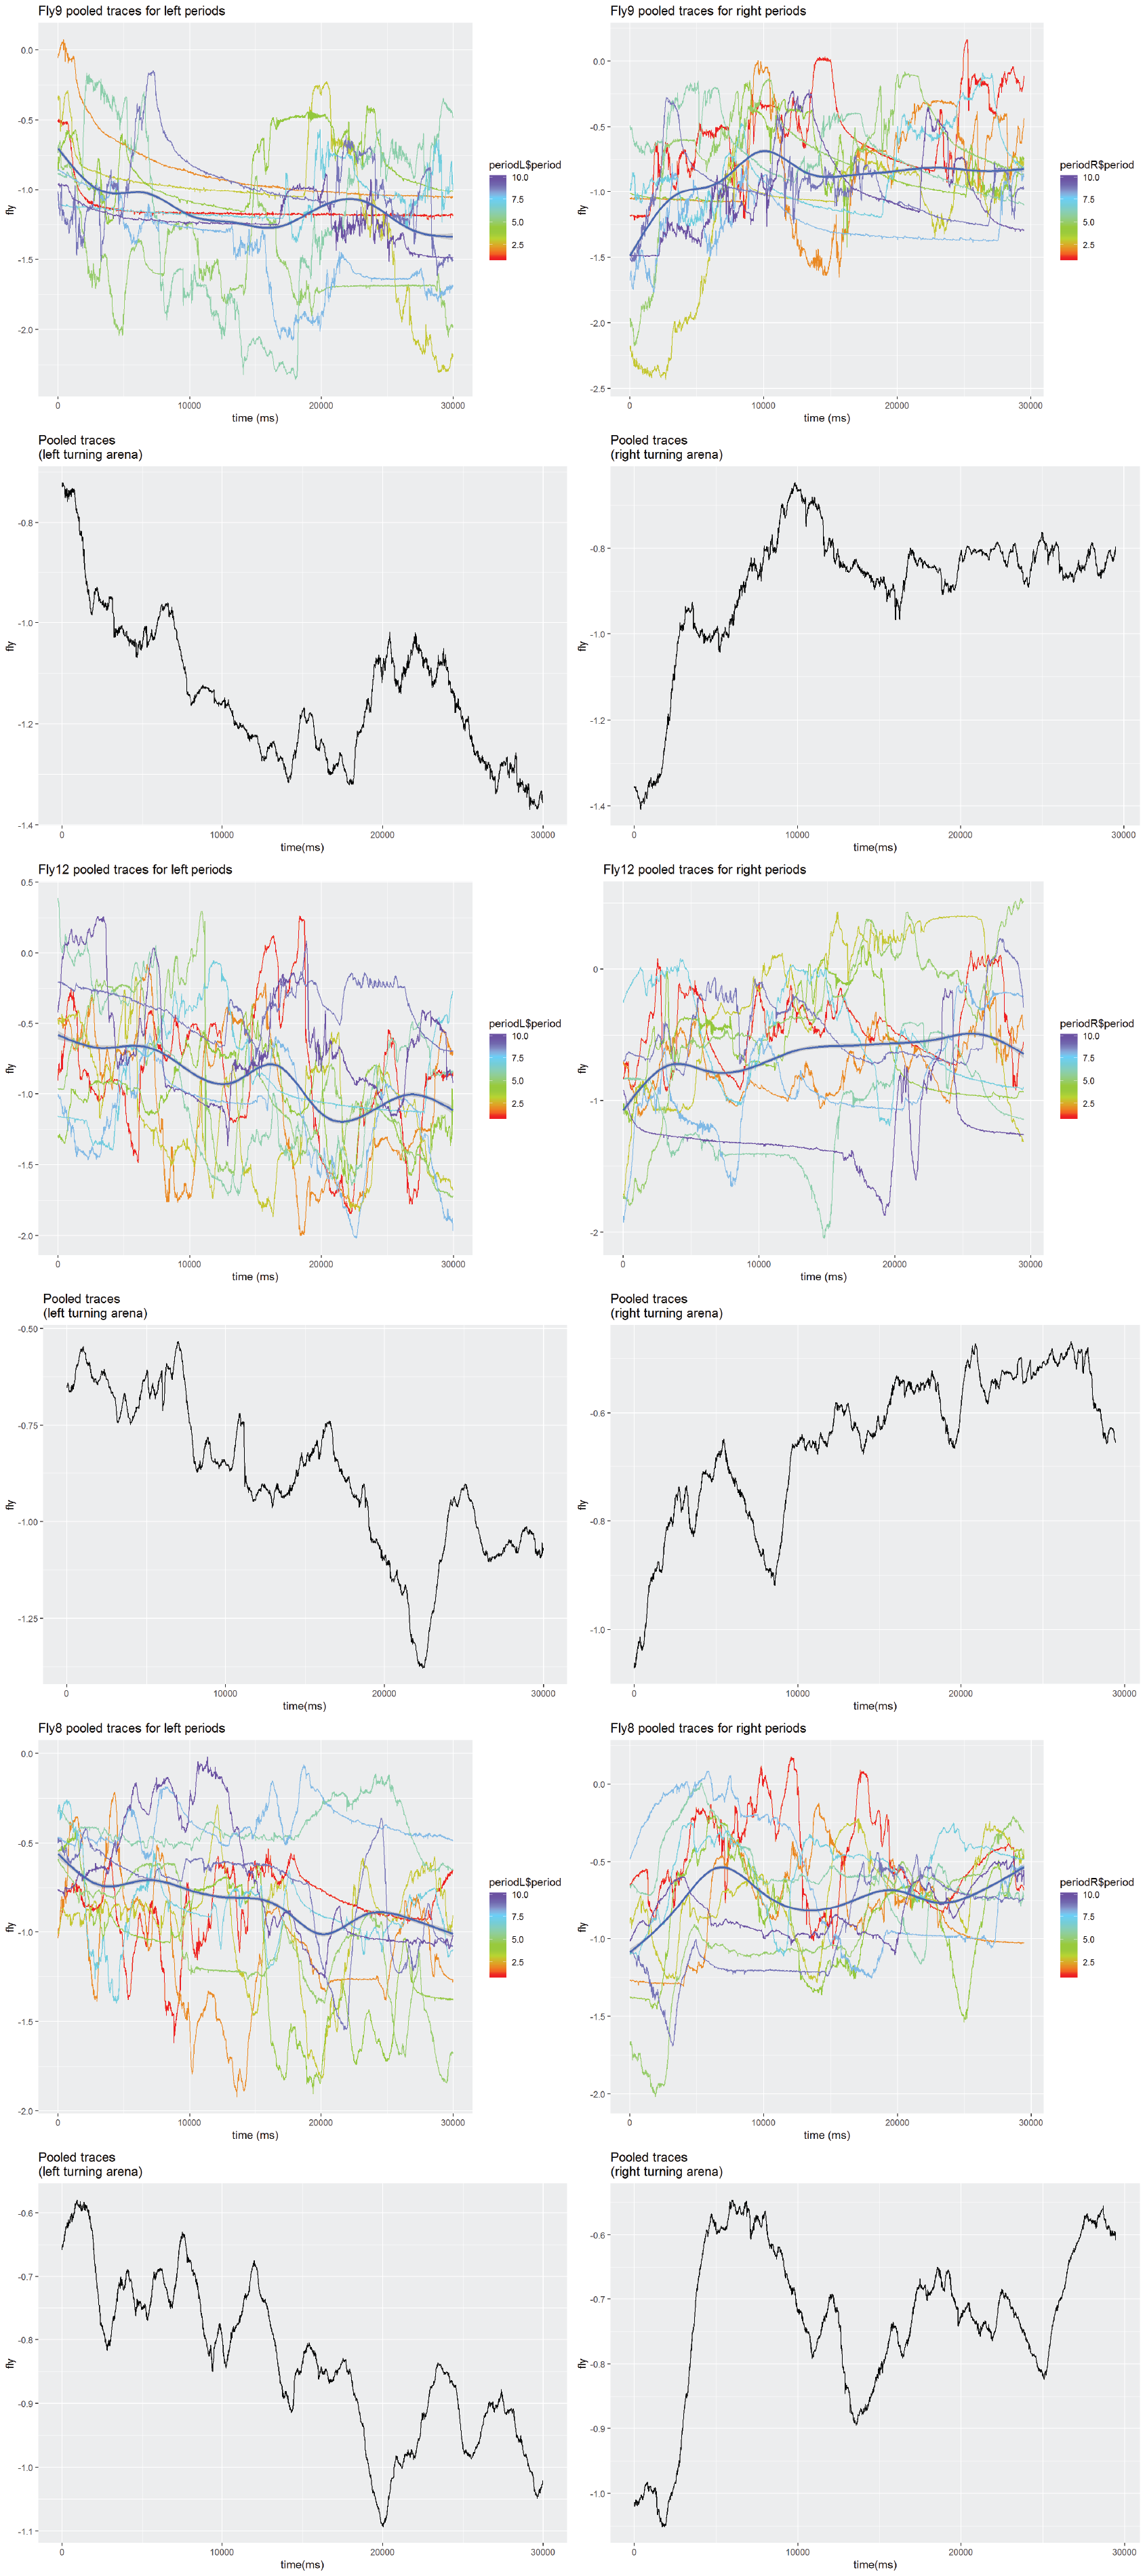
Control experiments
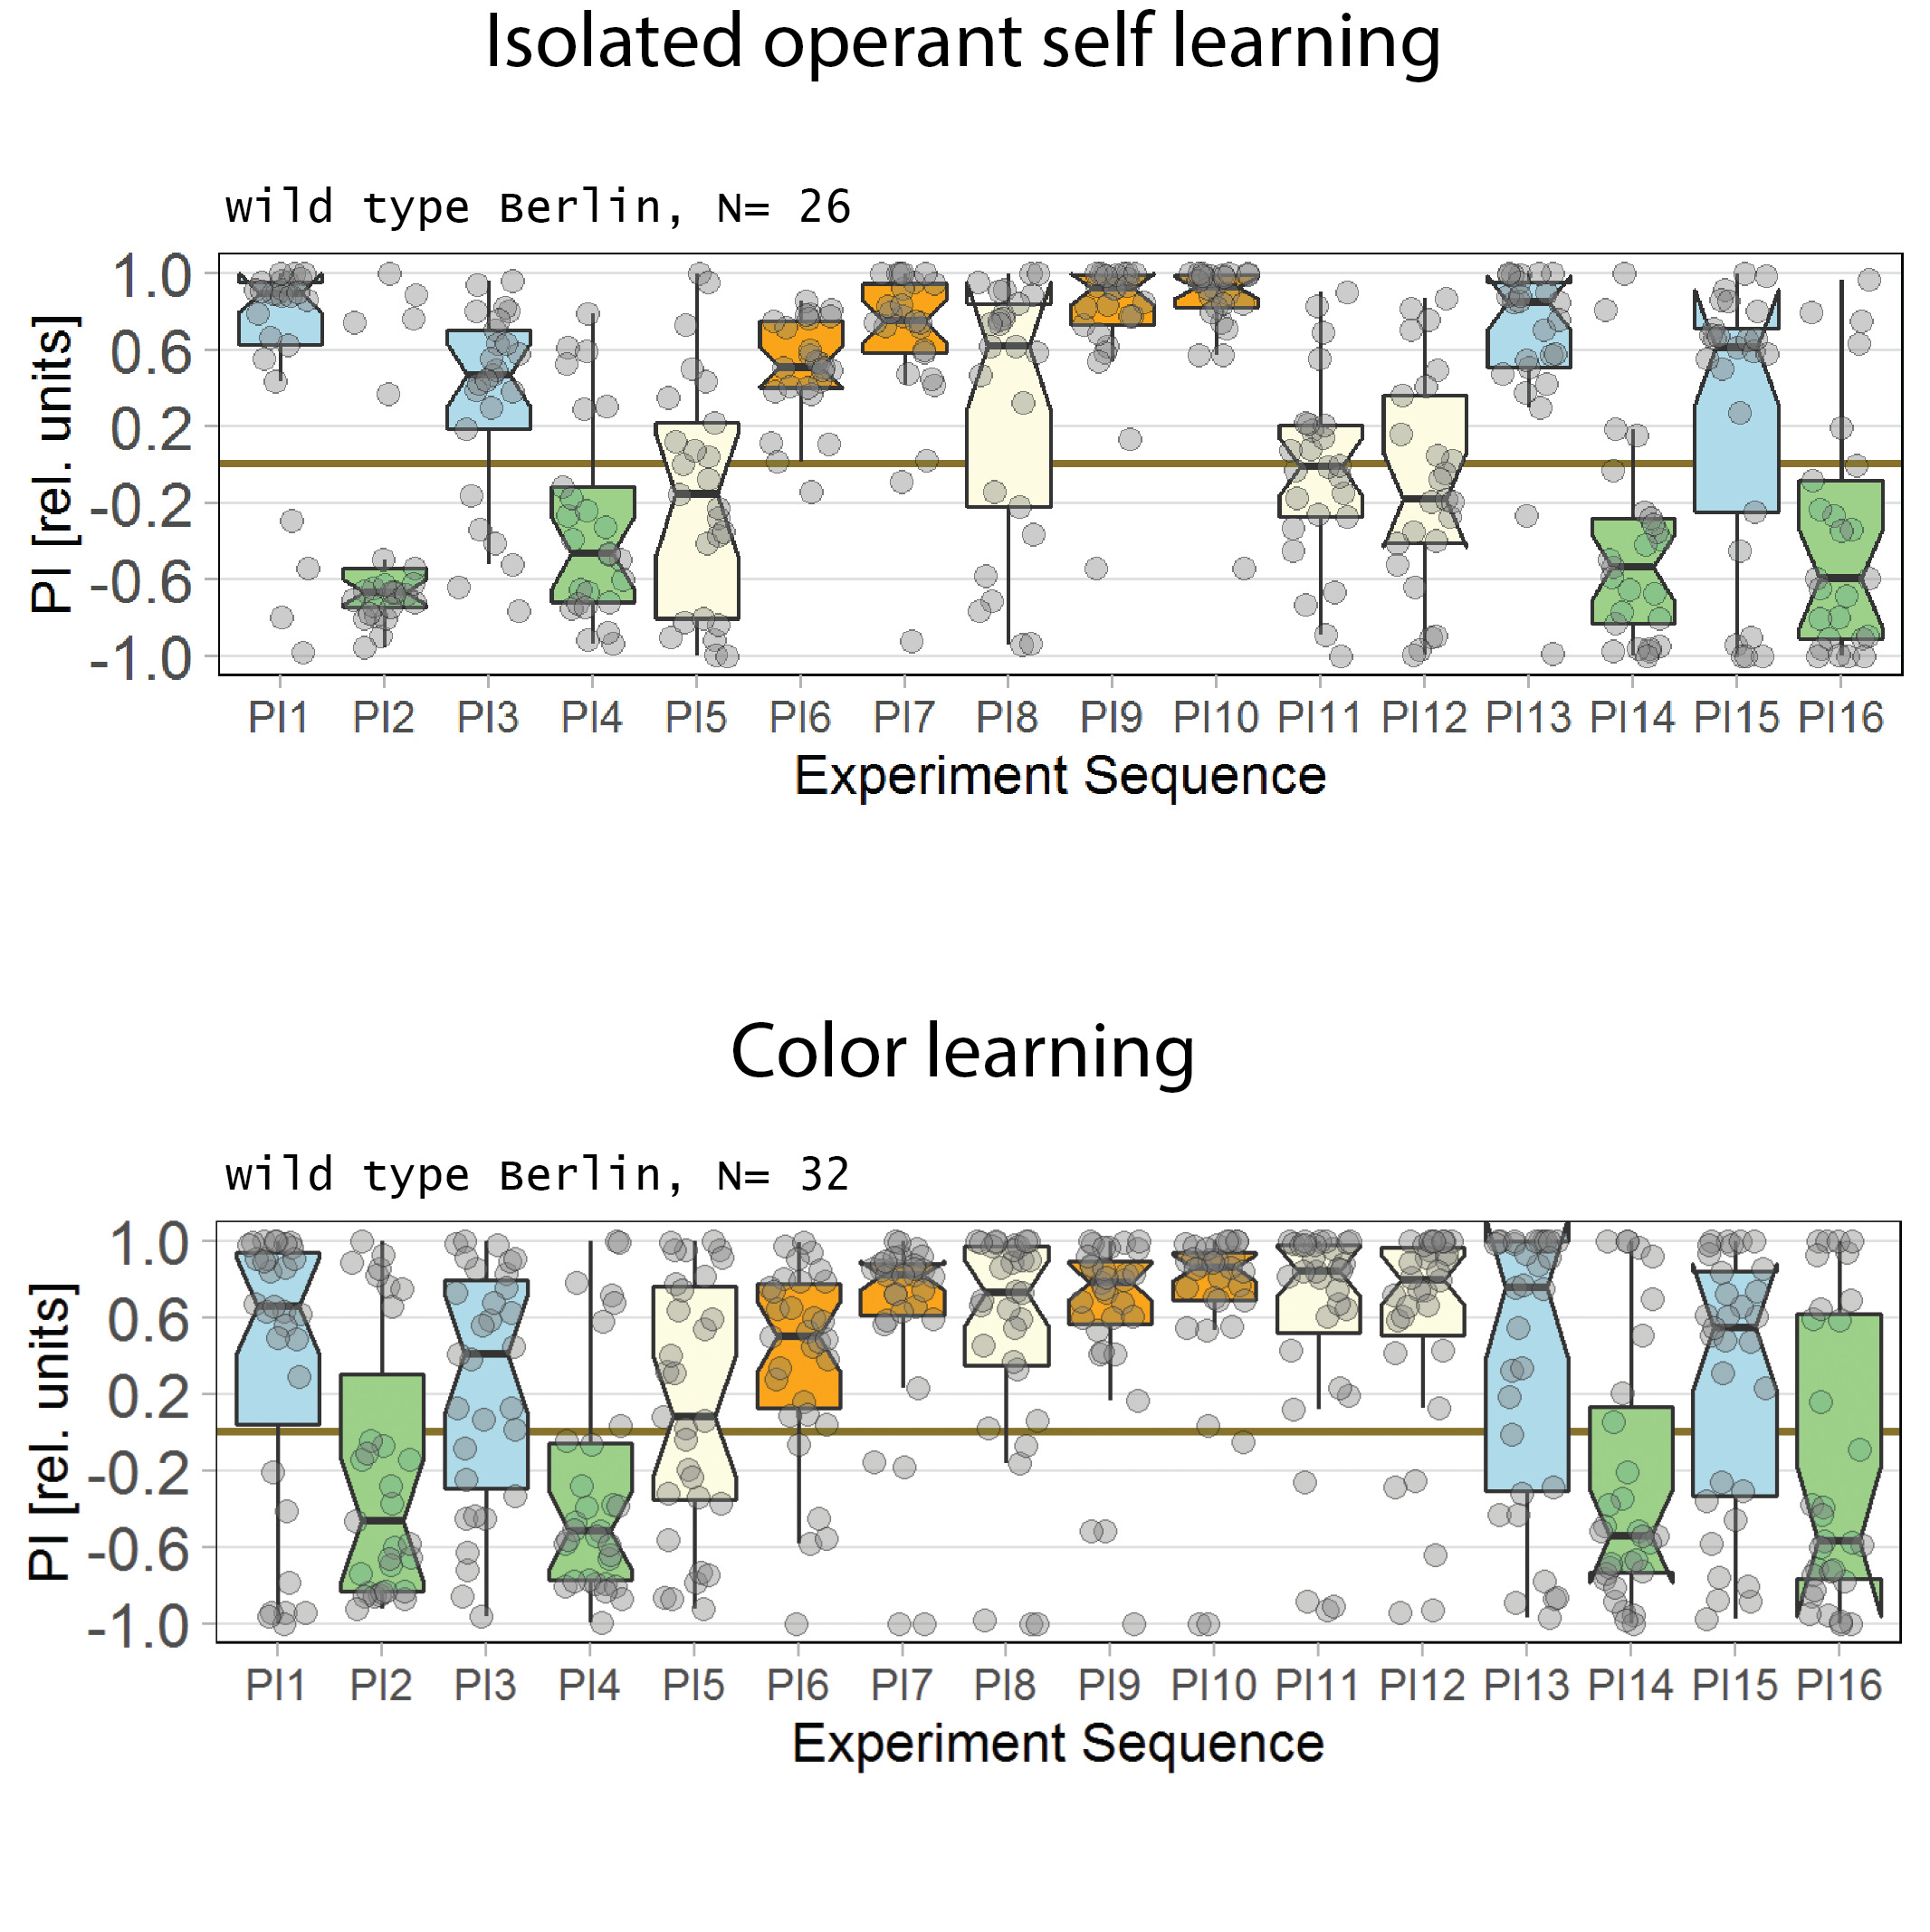
Been conducting a few control experiments to validate the “new” torque machine. Did a set of color learning and also isolated operant self learning. They do behave as expected. There is a small lumping together in the data the first period after the optomotor response in which the flies are in a neautral setting. It should be noted that it is a combined experiments of alternating right and left optomotor response. Also, the data in this figure is also a combination of the A/D converted “correctly” installed and “incorrectly”, i.e. inverted and reversed.