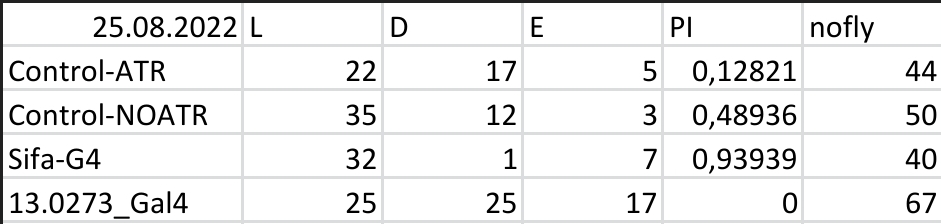
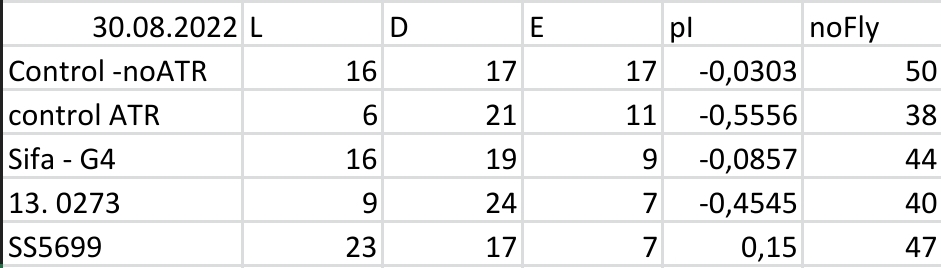
JoyStick results for re-testing PPM2 flies
on Monday, June 2nd, 2025 1:58 | by Daniel Döringer
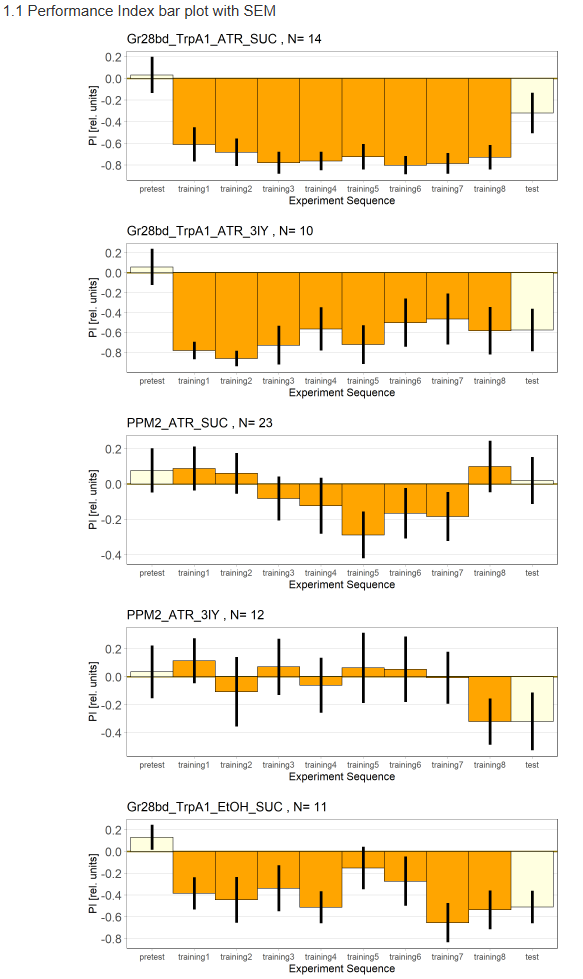
It’s not yet confirmed, that the 3IY treatment is working
Category: Optogenetics, Uncategorized | No Comments
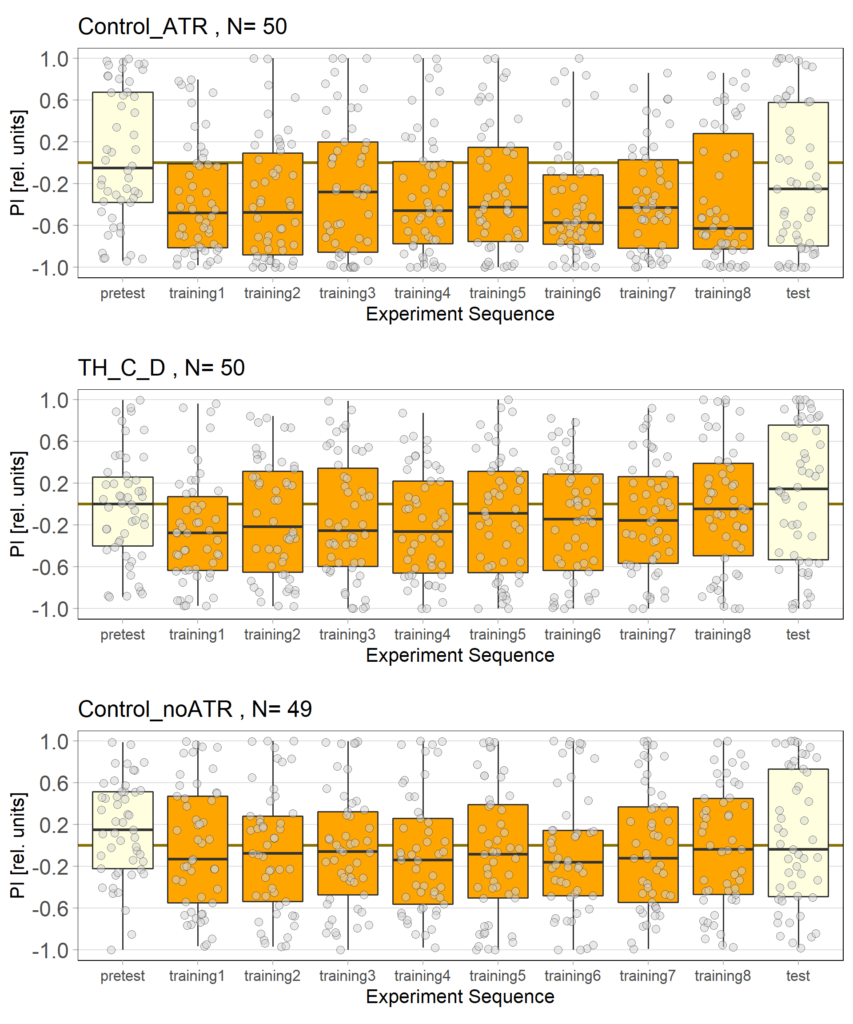
Update: T-Maze results after QC
on Sunday, September 15th, 2024 1:33 | by Daniel Döringer
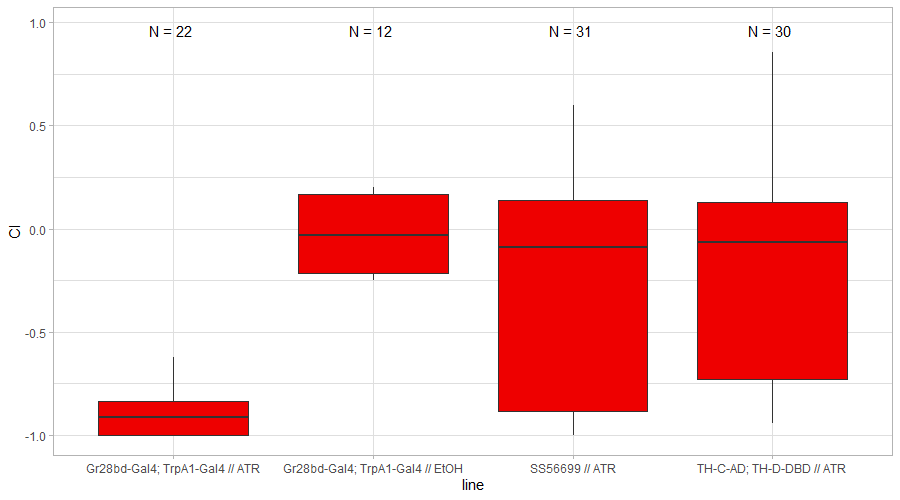
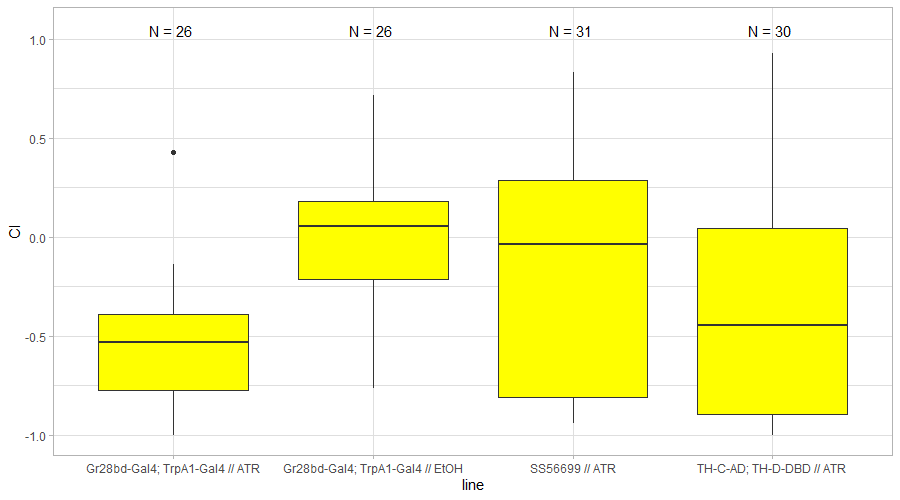
For all experiments 30 or more flies were introduced to the T-Maze.
Results for red light
Results for yellow light
Category: Optogenetics | No Comments
Updated (and visually more appealing) pre-vacation results
on Sunday, September 15th, 2024 1:26 | by Daniel Döringer
Results for red light
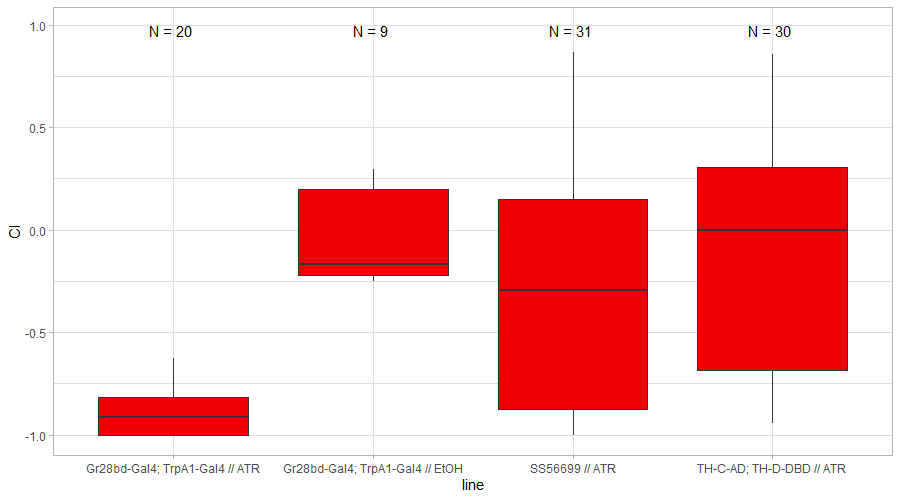
Results for yellow light
Category: Uncategorized | No Comments
Red light Joystick Results
on Monday, April 3rd, 2023 12:33 | by Luisa Guyton
Category: Optogenetics | No Comments
Aslıhan Enes Red Light T-Maze Results
on Monday, September 5th, 2022 10:15 | by Aslihan Dilara Gülay
Results for Red Light T-Maze experiments.
Category: Optogenetics | 1 Comment
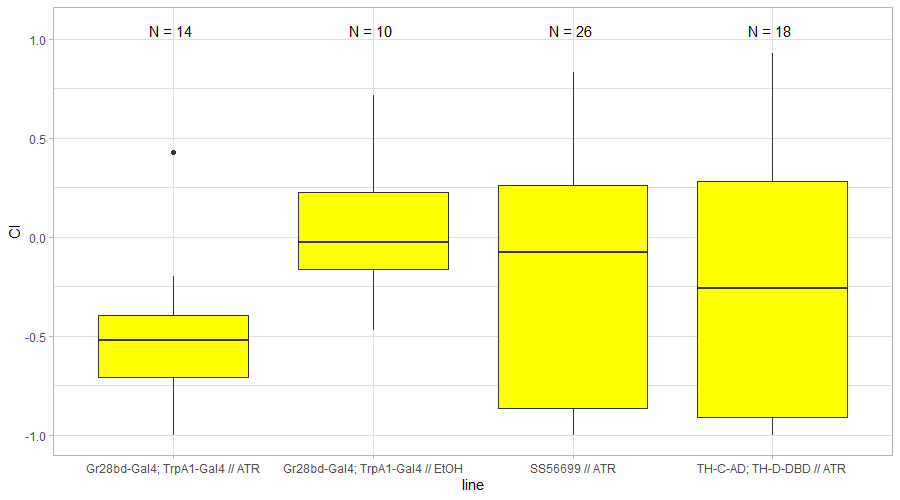
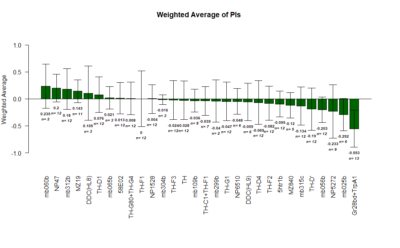
Role of dopaminergic neurons in operant behaviour
on Friday, July 27th, 2018 3:54 | by Gaia Bianchini
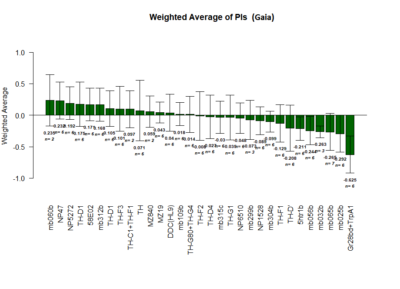
Positive Control: Gr28bd-G4, TrpA1-G4
Parameters: Light: intensity (500 Lux side, 1000 Lux bottom); frequency = 20Hz; Delay = 1 ms; Duration = 9.9 ms; volts = 6.4
Red lines: completed
mb025b: not selected against tubby
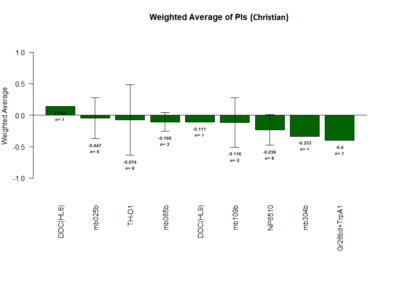
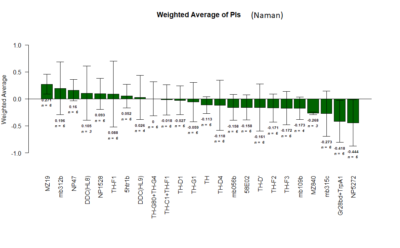
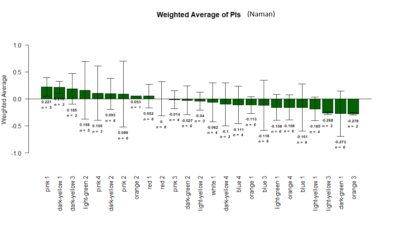
The Tmaze Experiments : Screen results as on 22-7-18
on Sunday, July 22nd, 2018 6:41 | by Naman Agrawal
Yellow 1 (Positive Control): Gr28bd-G4, TrpA1-G4
Parameters: Light: intensity (500 Lux side, 1000 Lux bottom); frequency = 20Hz; Delay = 1 ms; Duration = 9.9 ms; volts = 6.4
Category: neuronal activation, open science, Operant learning, Optogenetics | No Comments
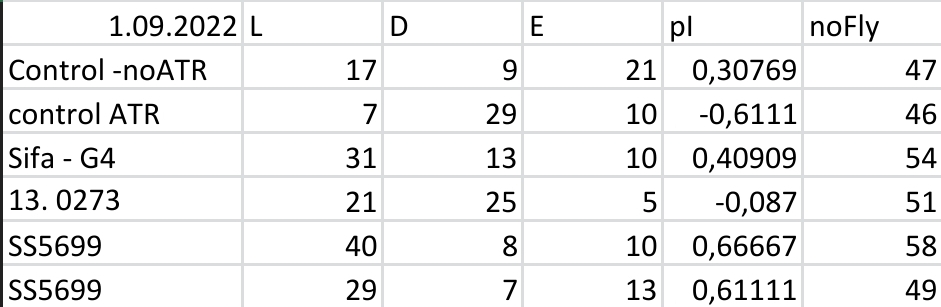
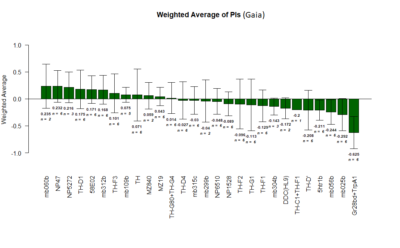
T-Maze experiments : screen results as on 16-07-2018
on Monday, July 16th, 2018 1:32 | by Gaia Bianchini
Results of the T-maze screen analysis, both individual and combined.
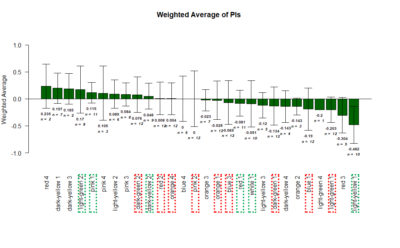
Yellow 1 (Positive Control): Gr28bd-G4, TrpA1-G4
Parameters: Light: intensity (500 Lux side, 1000 Lux bottom); frequency = 20Hz; Delay = 1 ms; Duration = 9.9 ms; volts = 6.4
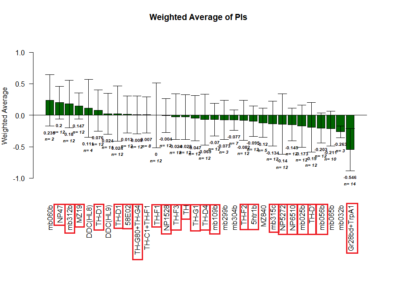
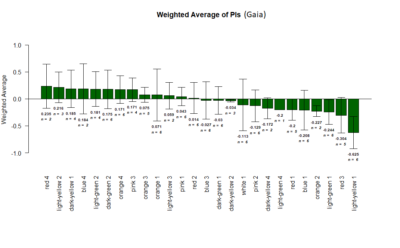
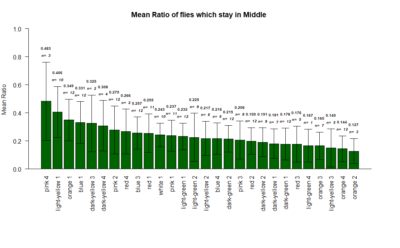
The T-Maze experiments : Middle analysis and Correlation plot
on Saturday, July 14th, 2018 12:06 | by Naman Agrawal
The mean ratio of the flies that stay in the middle during the experiments.
Correlation plot between the mean ratio of the flies that stay in the middle versus the Weighted PIs
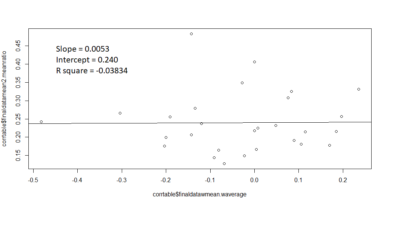
Slope = 0.0053
Intercept = 0.240
R square value = -0.03834
contrary to the expectations, there seems to be no correlation .
Category: lab.brembs.net, neuronal activation, operant self-learning, Optogenetics, R code | No Comments
T-Maze experiments : screen results as on 02-07-2018
on Monday, July 2nd, 2018 2:09 | by Gaia Bianchini

Yellow 1 (Positive Control): Gr28bd-G4, TrpA1-G4
Parameters:
Light: intensity (500 Lux side, 1000 Lux bottom)
frequency = 20Hz
Delay = 1 ms
Duration = 9.9 ms
volts = 6.4