Analysis for spontaneity in platform
on Monday, September 21st, 2015 2:26 | by Christian Rohrsen
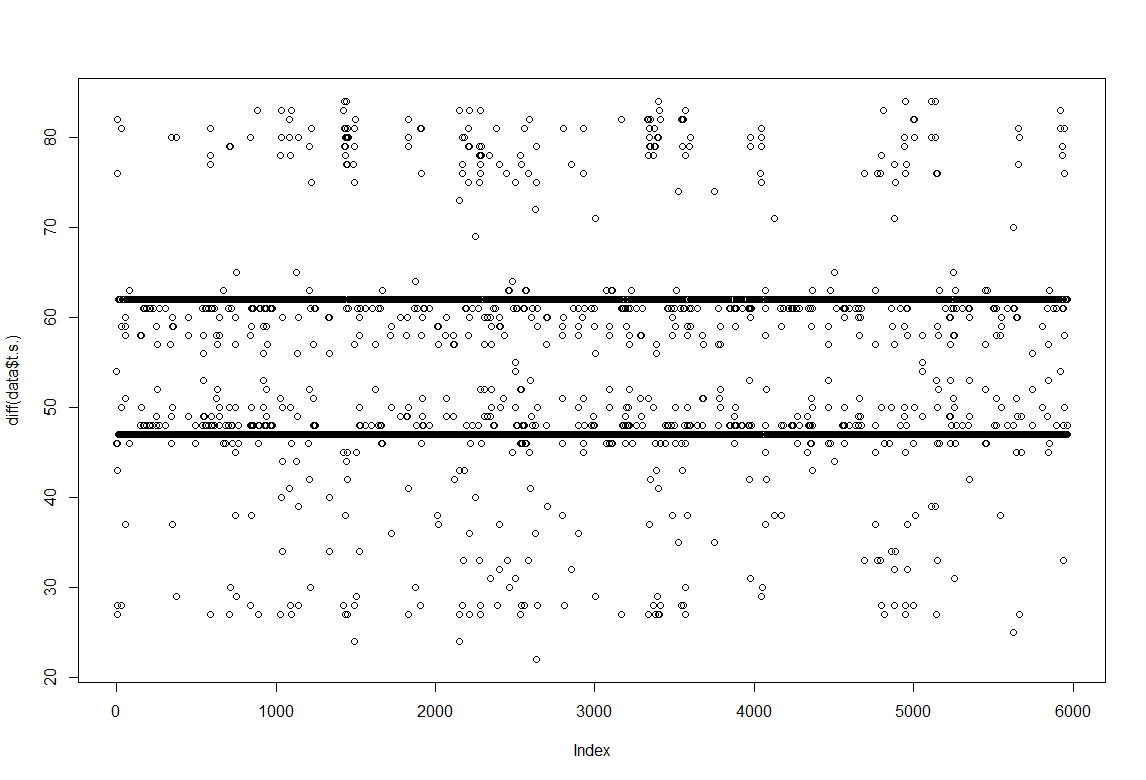
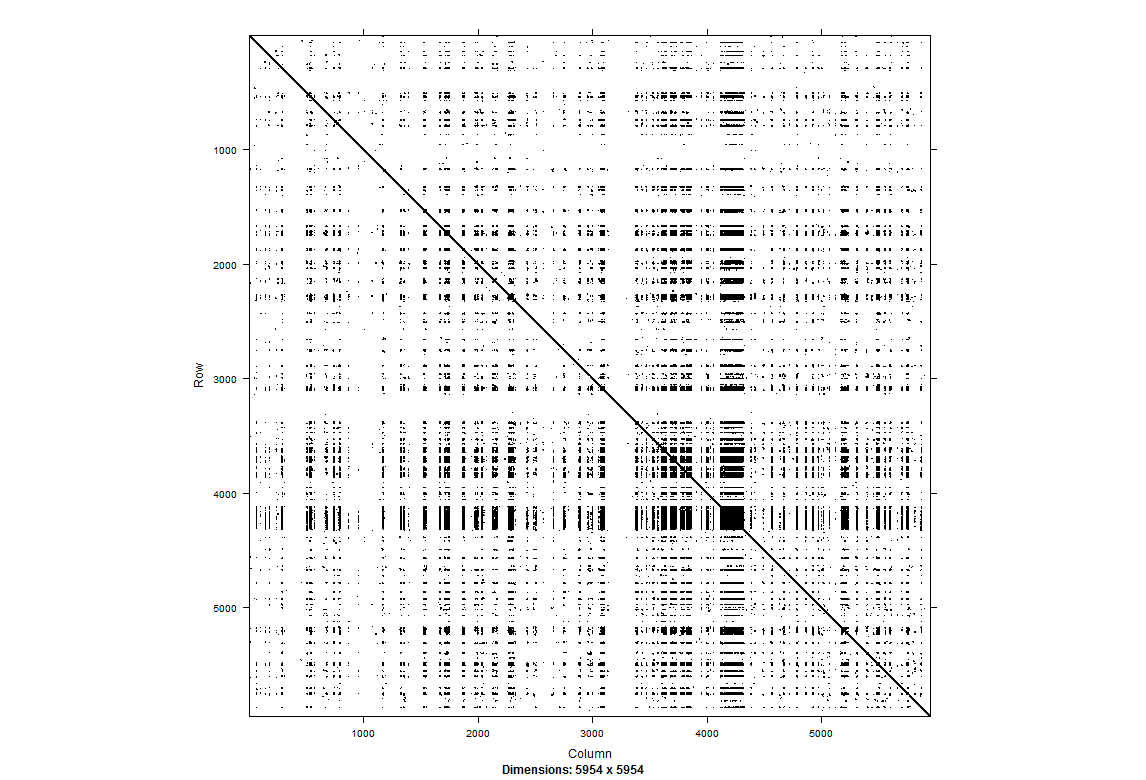 The sampling rate is not homogeneous and this affect a lot the processing of the data for non linearity. What can be done? On the right we see a recurrent plot of one single fly in darkness for 5 min. It seems to be to some extent periodic, not much chaotic (but I need more experience to really guess that) For more information https://www.recurrence-plot.tk/rqa.php.
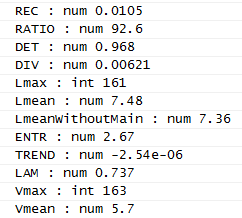
In the table below we see a low recurrence but high determinism among many other parameters.
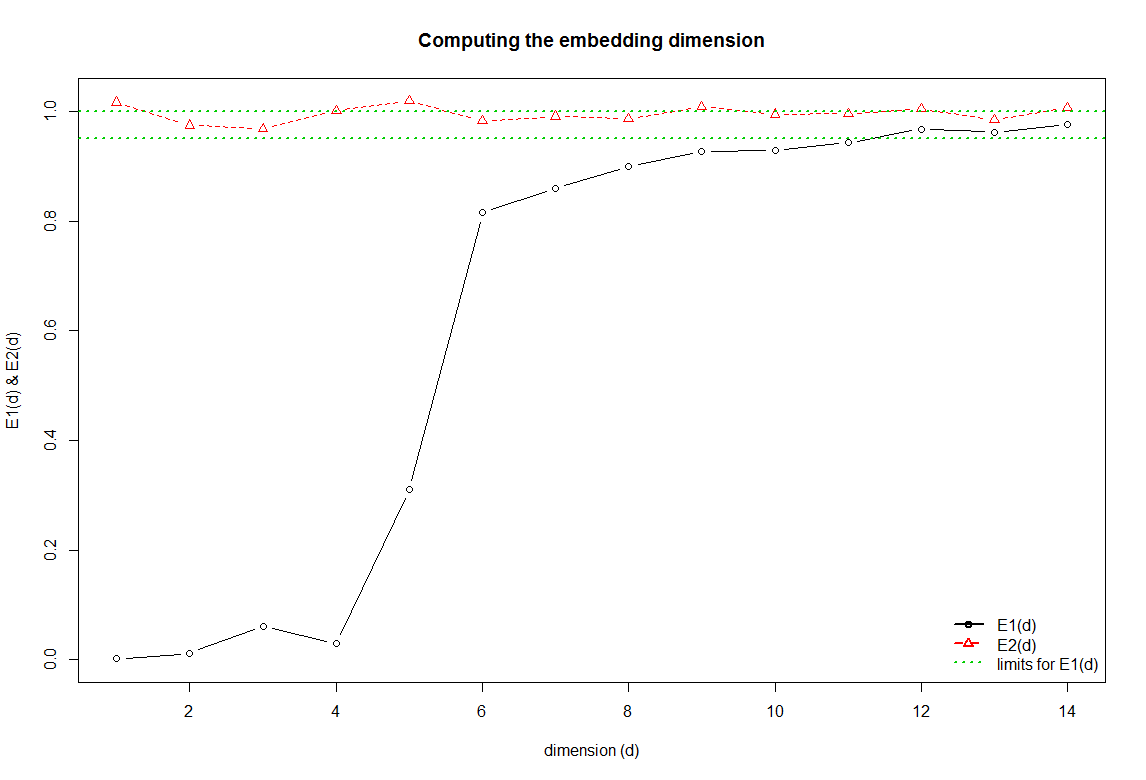
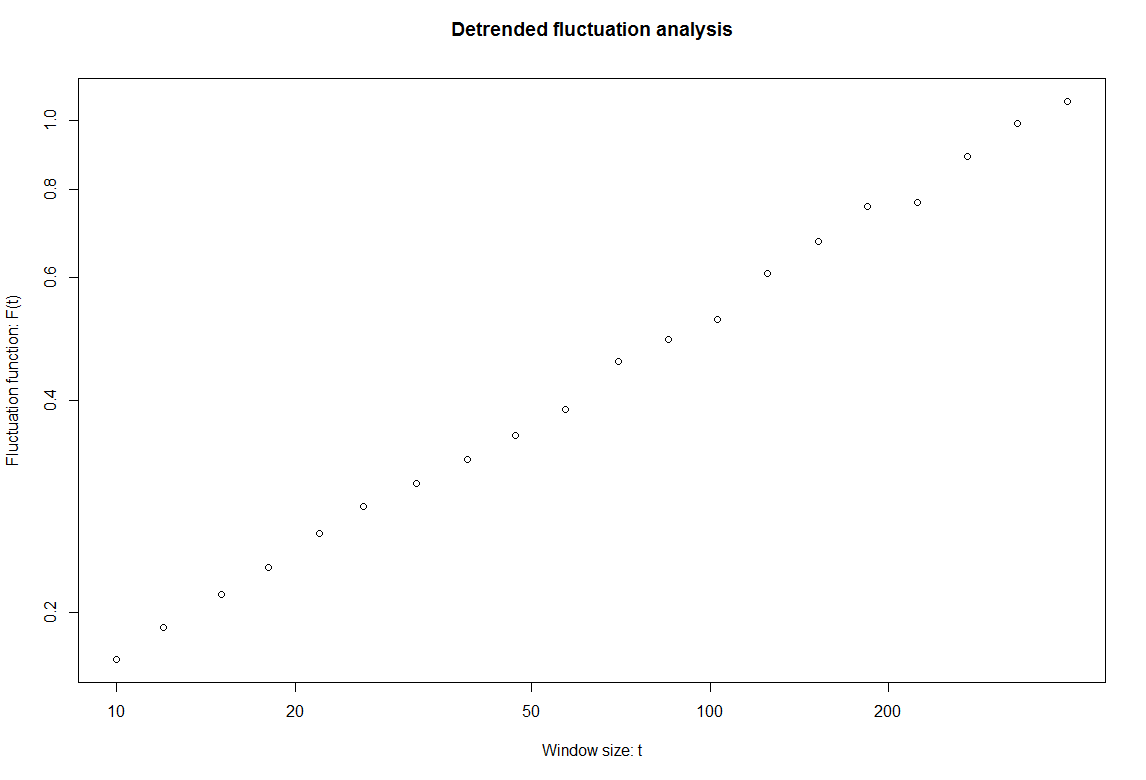 The E2 line shows values around 1 the whole time when the sample is random. This is contradicting the above. The detrended fluctuation analysis show a value around 0.5, which means that if these data was modelled as random it would look like white noise.

Category: R code, Spontaneous Behavior | No Comments
publishing torque meters comparison
on Wednesday, March 6th, 2013 11:17 | by Julien Colomb
here is the draft: https://figshare.com/preview/_preview/644625
Is there any good publication describing the wing beat analyser?
other remarks?
Category: flight, open science, Spontaneous Behavior, writing/publishing | No Comments
Trajectory data: database structure
on Thursday, December 20th, 2012 5:16 | by Julien Colomb
CeTrAn is our software to analyse trajectory data, written in R it is free and open source . It was designed to analyse data obtained in the Buridan’s experiment setup. I am now trying to have a larger scope and incorporate different type of data:, for instance:
– Buridan’s experiment done with a different tracker
– Walking honeybee tracking in a rectangular arena, with a rewarded target
– Animal (flies/bees) walking on a ball, using open- or closed-loop experiment setup
– trajectory data obtained from the pysolo software (flies)
– larval crawling data
I want to include an automatic depository of the data in a database. Automatic entries in Figshare is for instance possible. (see older posts). My problem is to find a way to treat the data such that:
1. the raw data is uploaded
2. all data is uploaded also if we use only the centroid displacement (in some data file the head position is also given)
3. the data can be reused and data obtained in different lab, animal, setup can be compared. (data should be organized such that it can be searched and queried).
4. probably other elements that I do not think of….
My main problem: I have nearly no experience in data management/design, ontology or semantic web. Here is a first draft of a database structure that I have thought of. Every feedback would be welcome:

Category: buridan, open science, Pysolo, Spontaneous Behavior | 1 Comment
C105-Gal4 S-Map results
on Wednesday, December 5th, 2012 5:49 | by Sathish K Raja
Here I post the S-Map results of the C105 gal4 lines crossed with TNT. Its part of the double line c105-c232 Gal4 that showed phenotype. Seems tetanus has some effect. C105-C232 Gal4 slope range was around 0.005.
N – 34, 37, 29 respectively
Rest of the analysis on the way !

Category: Spontaneous Behavior | 1 Comment
c105 Gal4 test
on Wednesday, November 21st, 2012 8:34 | by Sathish K Raja
Currently I am testing C105-Gal4 line and two groups seem to fly so weak(8/24 so far). I will be testing them until I have reasonable number.
Alongside, writing results and nearing completion on this chapter (thesis).But yet to prepare quality figures.
By the way, tag cloud is awesome !
Category: Spontaneous Behavior, writing_publishing | No Comments
log sathish
on Wednesday, October 31st, 2012 7:14 | by Sathish K Raja
1. Very relevant nature news on two layers of behavioural variability
https://www.nature.com/neuro/journal/v15/n11/full/nn.3247.html
This article argues about the presence of variability during the onset of stimuli.
2. detailed the formulae behind the fft function and relevant mathematical equations.
3. Started writing introduction part of my thesis; finished writing material and methods section except some cartoons.
May be I should start writing the results section alongside.
3. Third round of cross for self learning experiment with c105-c232 gal4 lines under way.
Category: Spontaneous Behavior, writing/publishing | 1 Comment
c232,105yx UAS-TNT self learning
on Saturday, October 27th, 2012 4:44 | by Julien Colomb
none of the group learn. Flies are quite weak. The two groups with UAS show a clear problem in operant behavior (low score during learning phases)…

Category: operant self-learning, Spontaneous Behavior | 3 Comments
Torque distribution
on Wednesday, October 24th, 2012 2:17 | by Julien Colomb
I had seen beautiful bell shaped distribution of torque (around 0) from the Heisenberg’s lab. We thus checked the data we have (the 6 minutes data we produced with the same flies for the torque meter and compensator. Data produced on the same day, or later (when sathish was mastering the preparation a bit better).
Here is the distributions:

Our distribution are close enough to the bell shape obtain by the Heisenberg’s group. The wing beat analyser seem to lead to different torque calculation, though.
PS: no difference seen in the frequency of spikes on the other hand.
Category: open science, Spontaneous Behavior, Uncategorized | 1 Comment
SMap before and after self-learning: no difference
on Friday, October 19th, 2012 6:33 | by Julien Colomb
small but significantly different from 0 slope in the S-Map procedure, both before and after self-learning.


No difference in the slope while comparing before and after learning for each fly.

n>130 for each group.
Category: operant self-learning, Spontaneous Behavior, Uncategorized | 4 Comments
grip analysis on Buridan activity data
on Wednesday, October 17th, 2012 7:49 | by Sathish K Raja
Grip analysis on:
1. Interval between activities (temporal)
2.Difference between the subsequent activity (temporal) like [X2-X1,X3-X2]
3.Difference between the subsequent distance travelled during the activity period (spatial)
4.Pysolo midline crossing data. Data sampling at 1 min interval. number of time fly crosses the virtual midline over the period of 60 s.
Bar: 1.c105;c232-wtb
2.c105232-TNT
3. Wtb-TNT
Inter-activity interval of buridan activity

2.Difference between the subsequent activity
")
Difference between the subsequent distance travelled during the activity period

pysolo midlines crossing

Category: buridan, Pysolo, Spontaneous Behavior | 5 Comments