Salt (1.5 M) avoidance of 3rd instar larvae
on Sunday, October 12th, 2025 11:53 | by Radostina Lyutova

Category: Biogenic Amines, DAN, Food preference, Larve, neuronal activation, Optogenetics | No Comments
Salt (1.5 M) avoidance of 3rd instar larvae
on Sunday, September 28th, 2025 12:21 | by Radostina Lyutova
Category: Biogenic Amines, DAN, Food preference, Larve, Mushroom Body, neuronal activation, Optogenetics | No Comments
Trying to fix the negative control
on Monday, September 8th, 2025 12:57 | by Daniel Döringer
My previous JoyStick and T-Maze experiments revealed problems concerning our control groups. While control flies that were fed with ATR supplemented food avoided the light nicely, we also observed avoidance in our negative control who did not receive any ATR. In our experiments we use the CsChrimson channel, which should need ATR to be functional.
My hypothesis for why also our negative control now shows avoidance was, that some mutation in the gene encoding for the CsChrimson channel might have affected its sensitivity and now there was at least some residual activation, even without ATR.
As an attempt to identify the underlying problem I crossed new control flies, this time using NorpA;20xUAS-Chrimson flies from our stock. If there had been a mutation in the flies I used earlier the new flies should not show avoidance.
As of now, the results are hard to interpret. There seems to be also avoidance with the new flies, however this might also be due to low sample size. If increasing the sample size will only show more robust avoidance, we’ll have to think about other causes for the problem…
Update 17.09.25:
The flies used in the previous experiments unfortunately turned out to be not blind. I conducted a new set of experiments, this time with blind flies, and I also changed the light used to red light, at a peak intensity of 500 Lux.
With this setup the results look more like what we would expect from our negative control. Of course the sample size is too low for me to really be able to tell whether the negative control will not show a preference.
Update: 07/10/25: The results below were obtained from a new set of experiments. I reared new flies (this time the blind flies actually should be blind) and crossed them to Gr28bd-Gal4; TrpA1-Gal4 flies from our stock. If the problem was indeed the driver line, this negative control should not show avoidance. Its a bit early to say but for now it seems as I might be on the right track.
Category: Optogenetics | No Comments
Final JoyStick results from Alisa’s trials
on Monday, August 4th, 2025 1:53 | by Daniel Döringer
Control groups fed with ATR (Gr28bdTrpA1_Suc_ATR and Gr28bdTrpA1_Suc_ATR) look fine and for now the avoidance by activating heat sensing neurons does not seem to depend on dopamine. The negative control (Gr28bdTrpA1_Suc_EtOH) shows stronger avoidance than we would expect. Also PIs of PPM2 lies do not follow the same pattern as we previosly observed… My current hypothesis is that some sort of mutation led to the Chrimson channel being more sensitive to light, even without ATR. Since we rear the PPM2 flies in light until they receive the ATR this might affect their behavior.

Luisa’s results for yellow light:
Category: Optogenetics | No Comments
T-Maze results dopamine inhibition
on Monday, July 28th, 2025 11:54 | by Daniel Döringer
Confirmation of 3IY+ATR
After figuring our how to apply 3IY to the flies and confirming that we can simply mix in the ATR with the sucrose to apply it, I stumbled upon another problem: when 3IY and ATR are used together the tissue paper will go from yellow to orange:
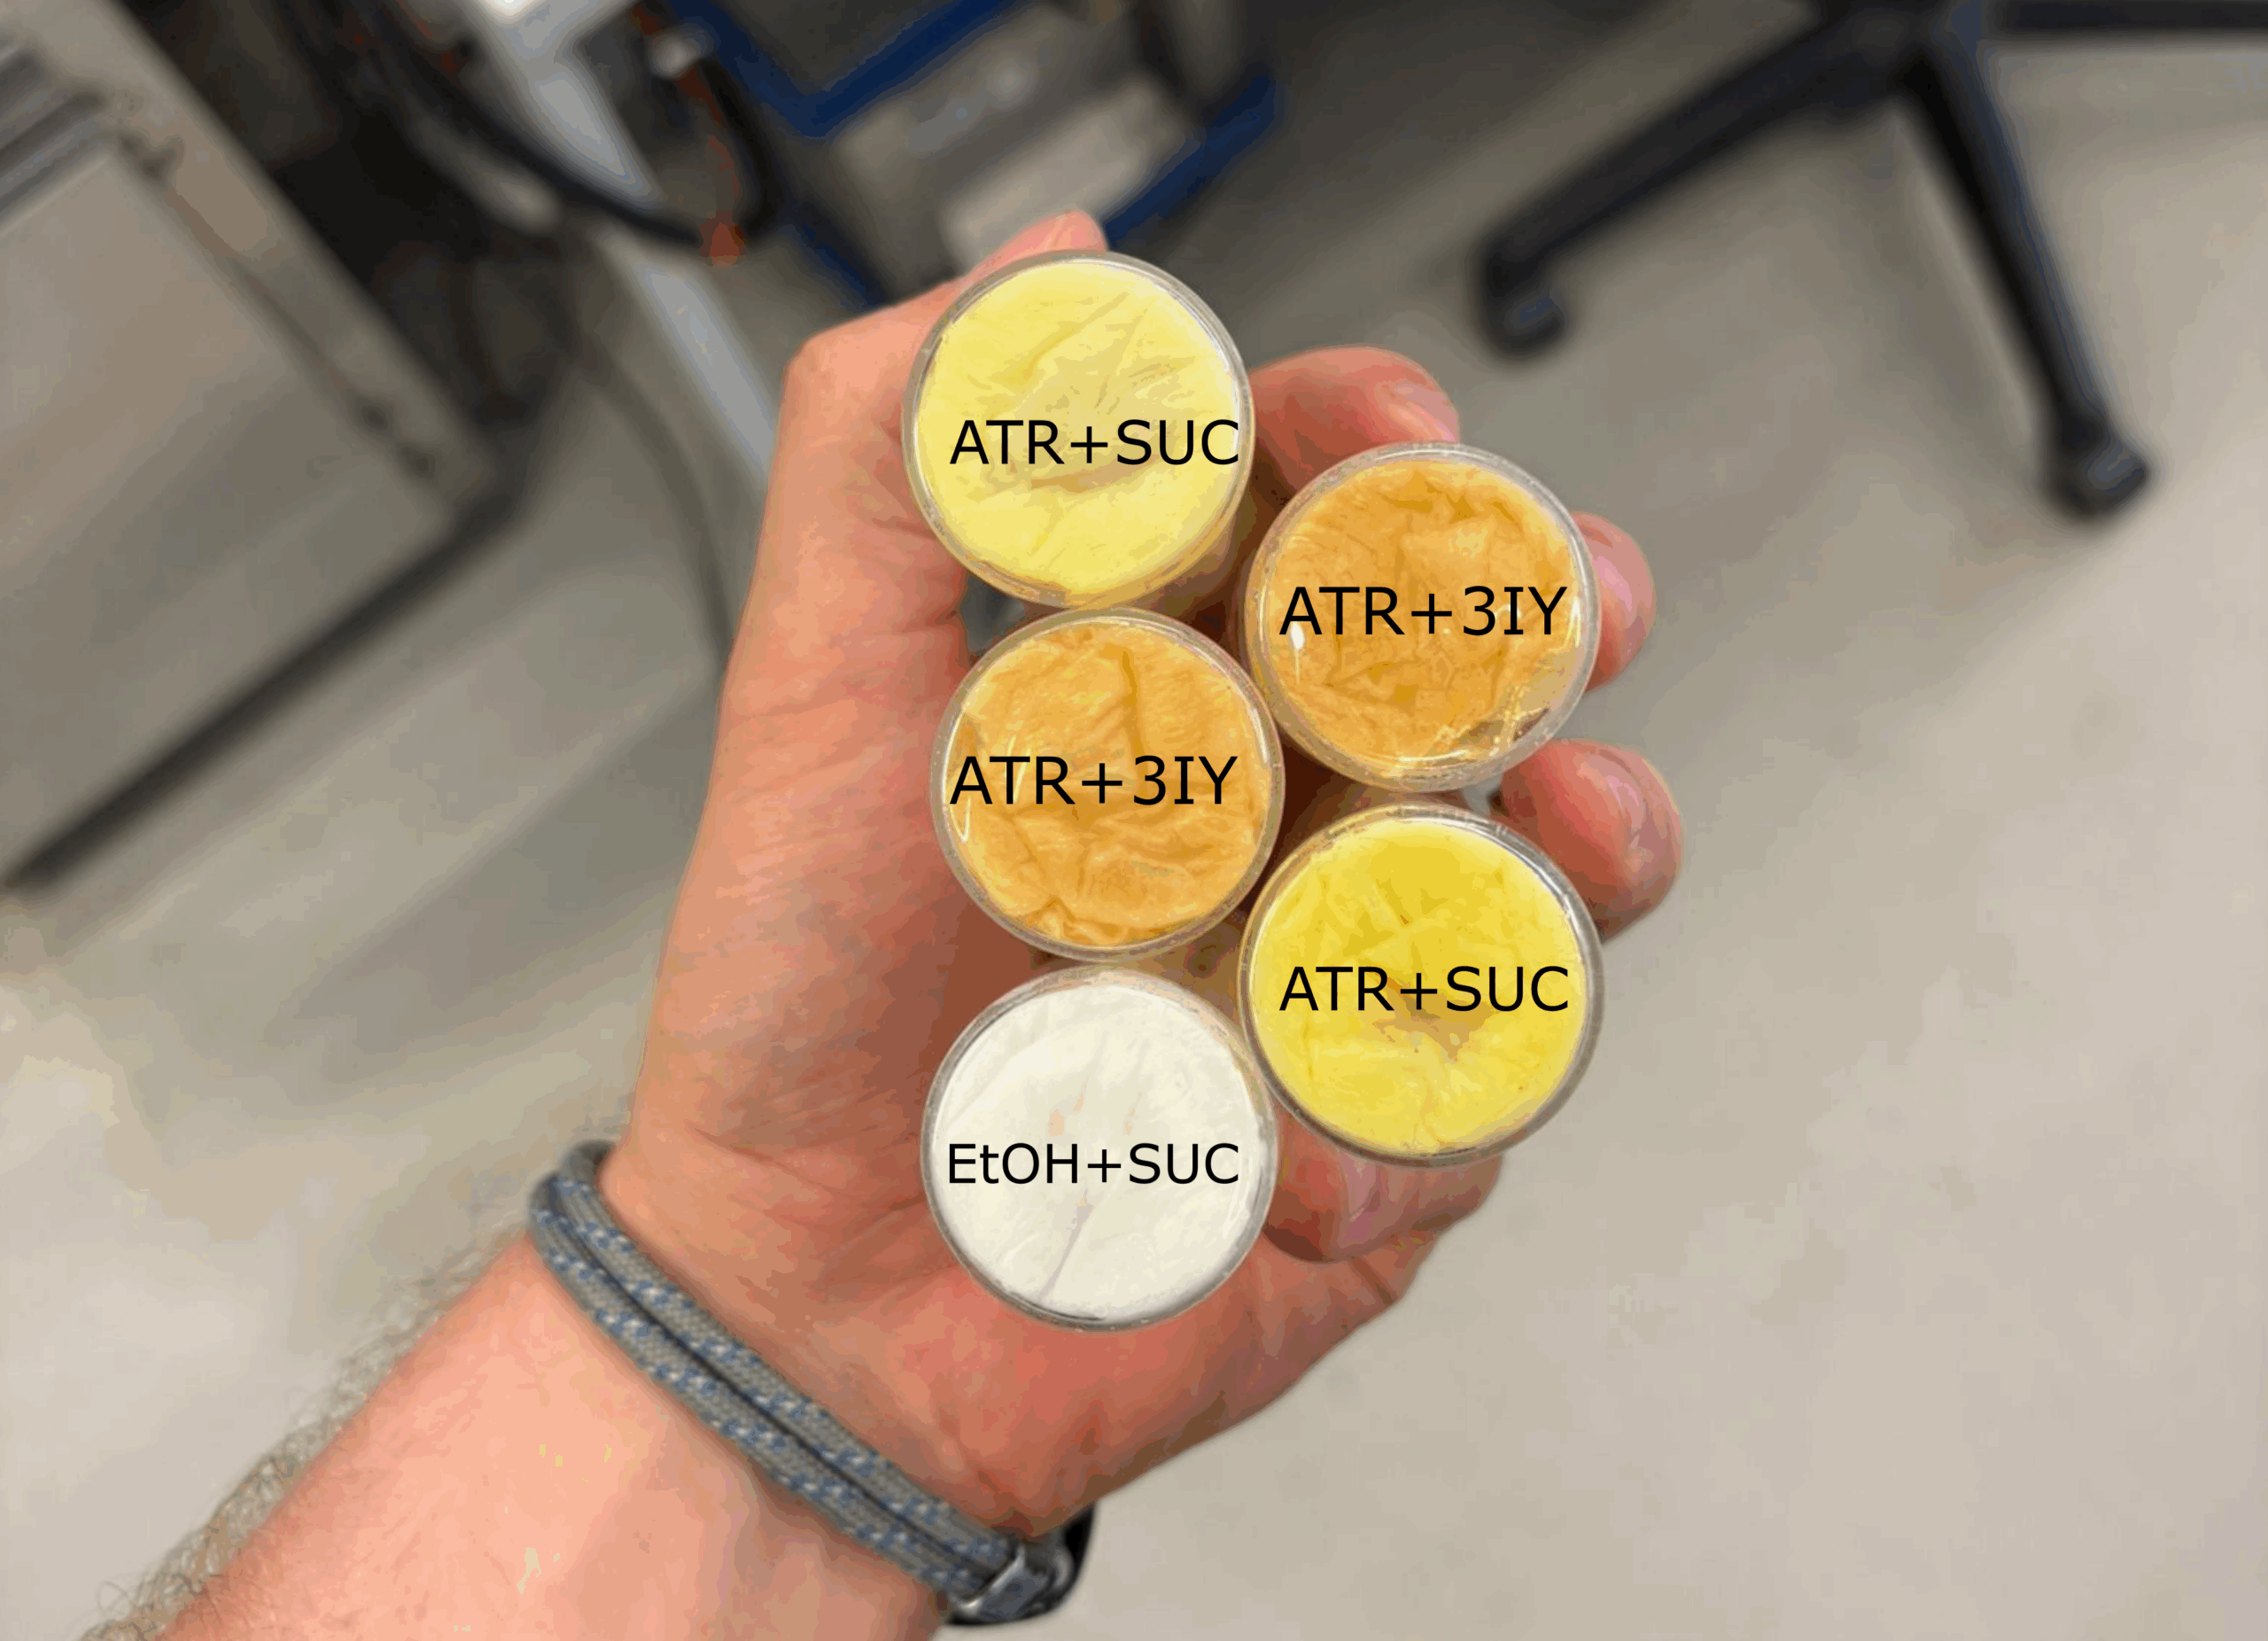
Since we cannot know if this affects the action of 3IY I conducted a final trial in the open field, measuring locomotion of WTB flies after treating them with 3IY and ATR for 48h.
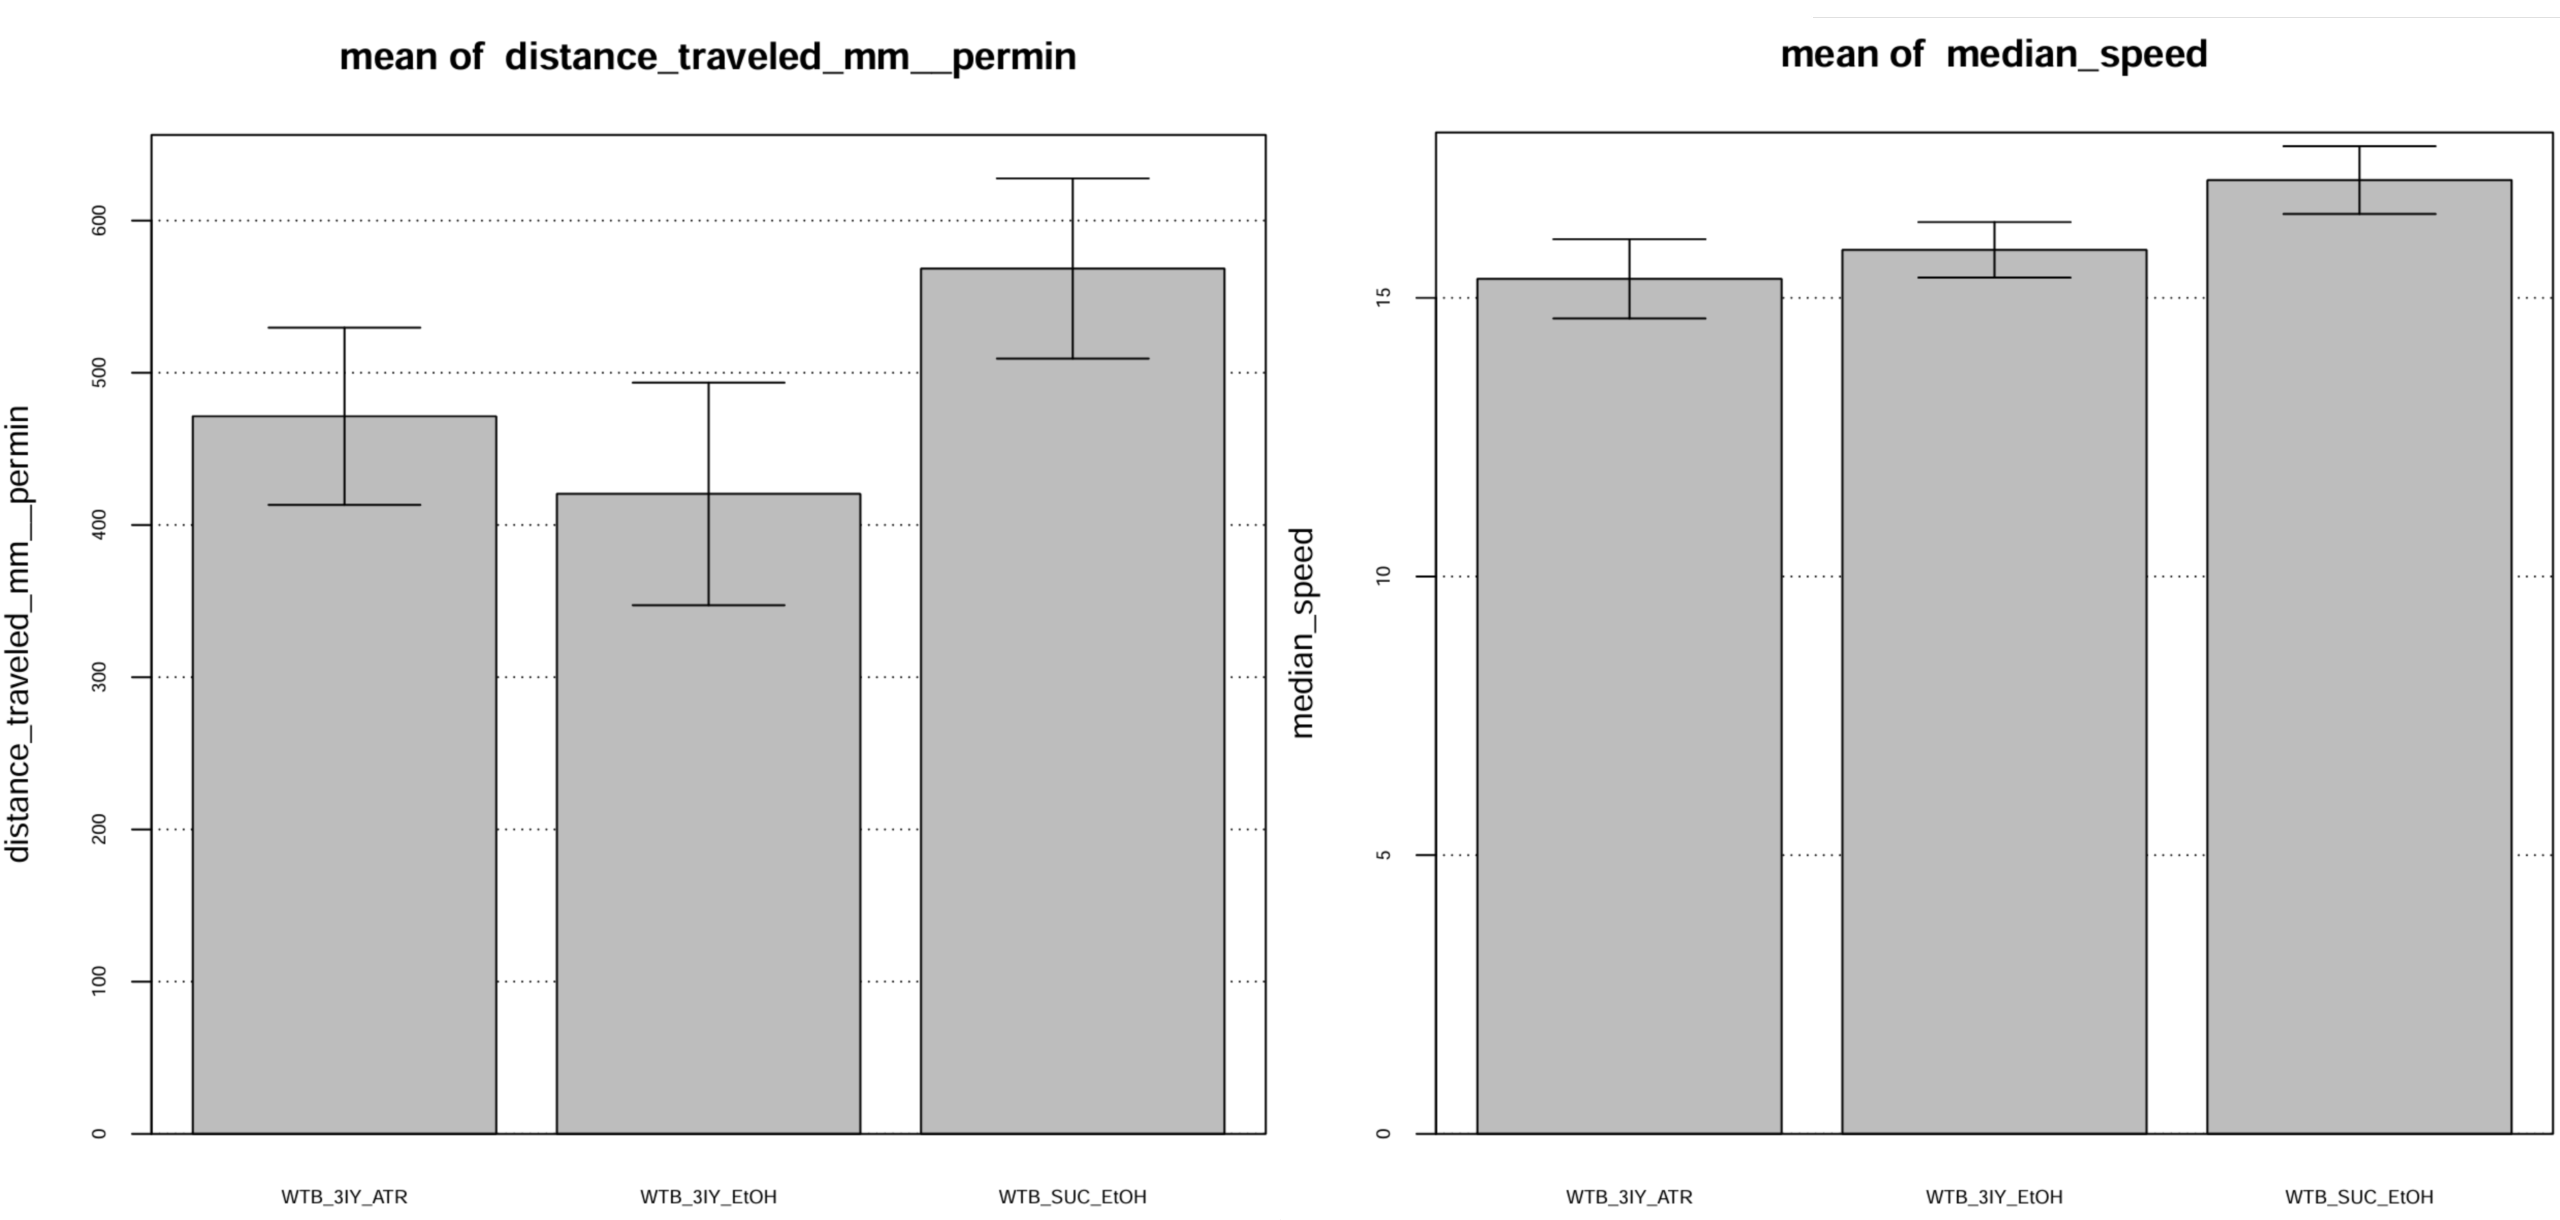
NWTB_3IY_ATR = 16 ; NWTB_3IY_EtOH = 13; NWTB_SUC_EtOH = 8
It seems, that ATR does not affect the action of 3IY and we can proceed with our experiments.
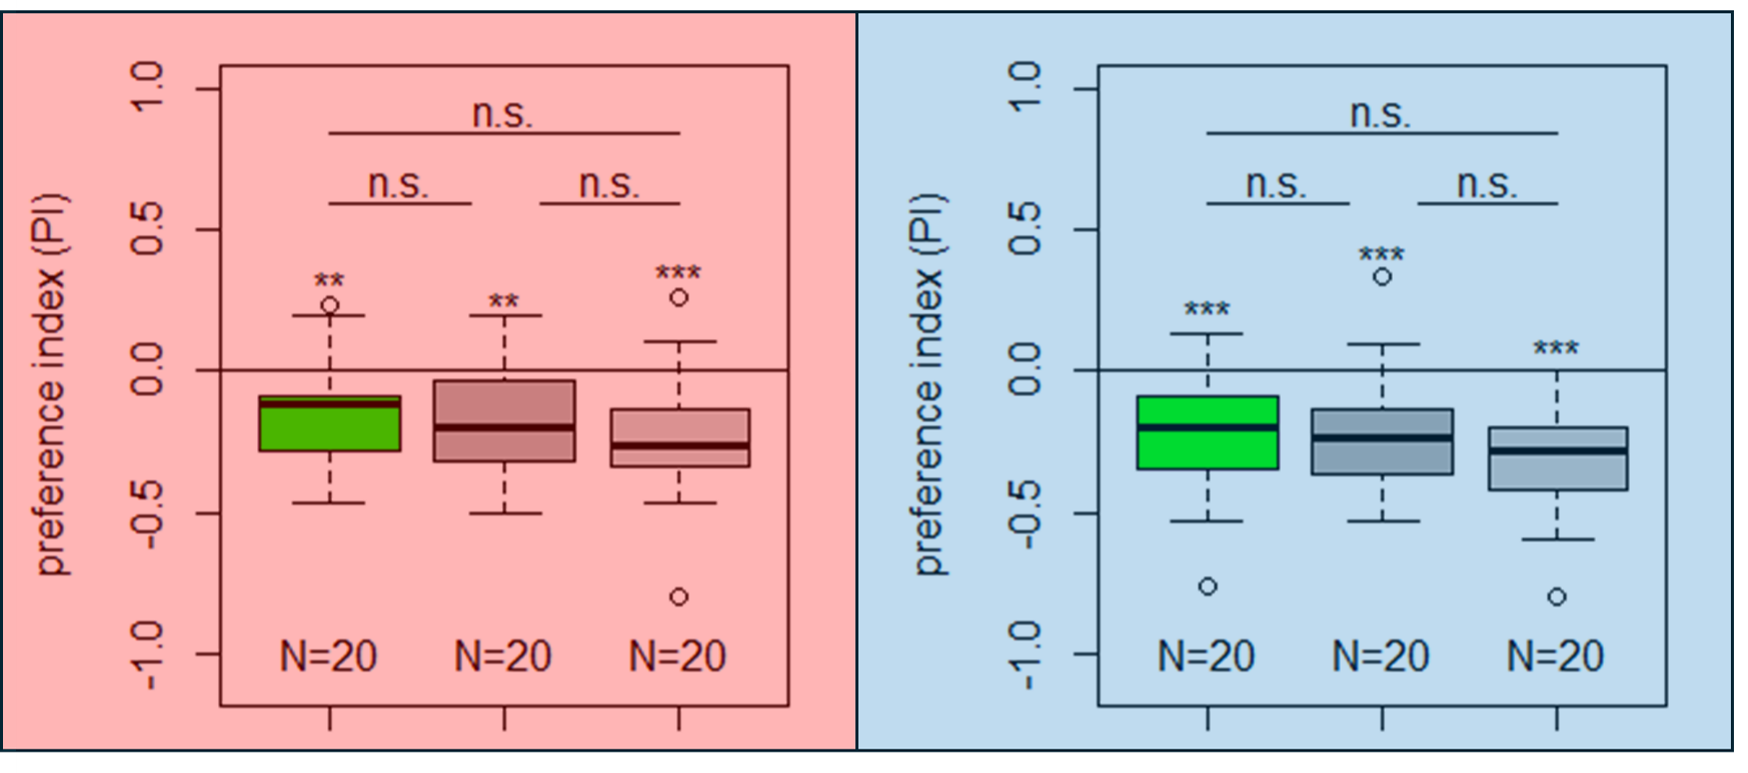
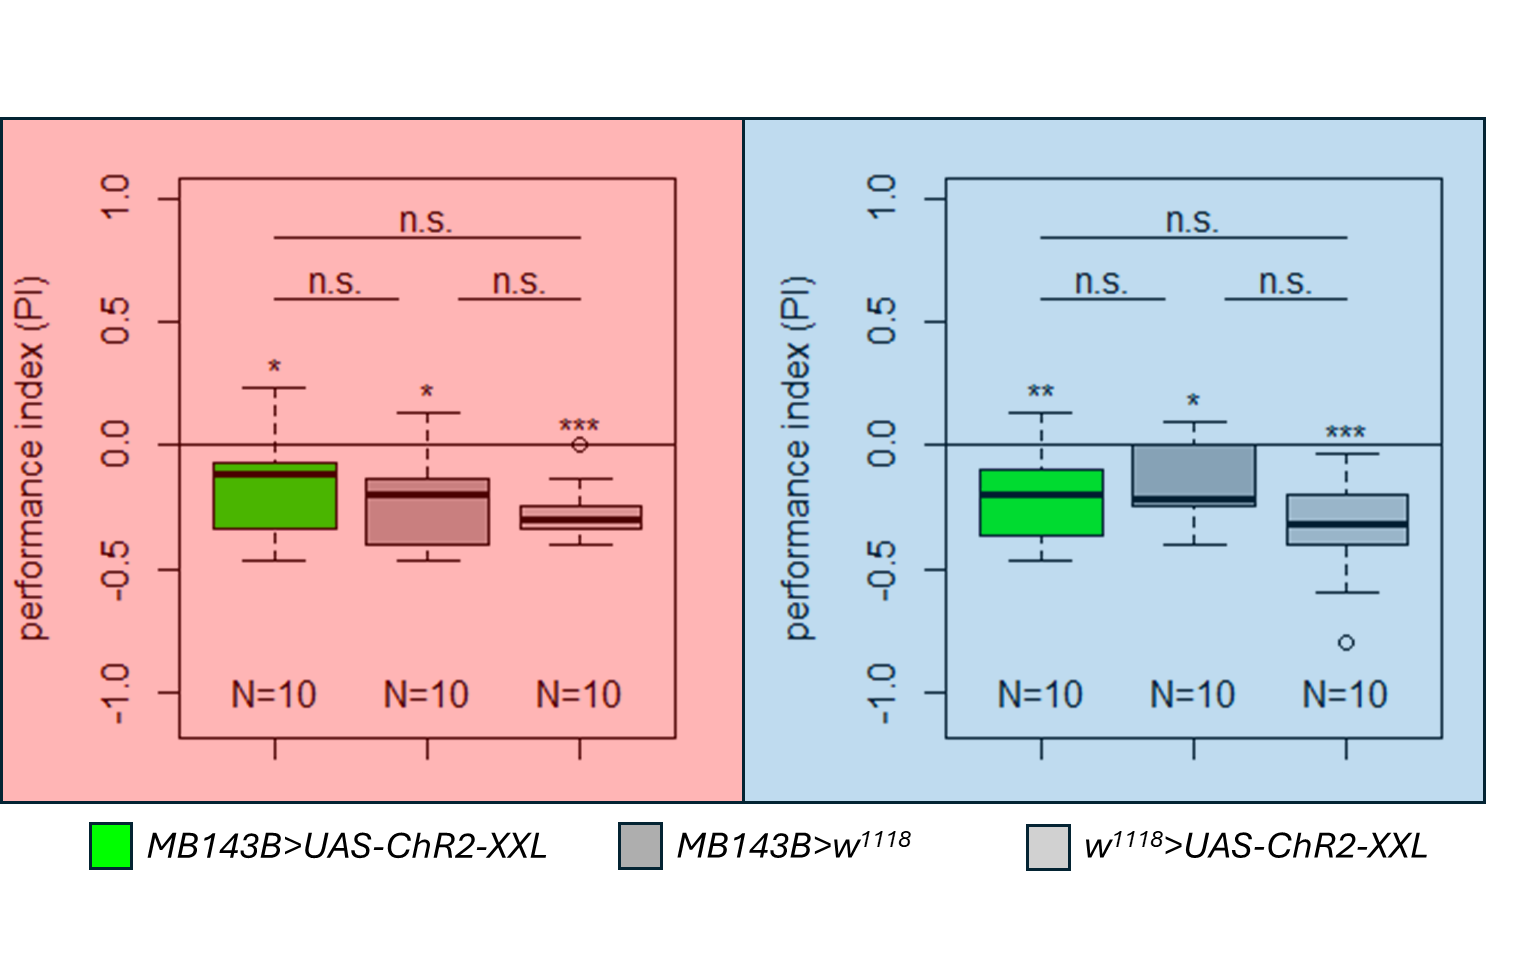
T-Maze results
These are the first results from the set of T-Maze experiments with 3IY treatment. I used red light (1600 Lux) with a decision time of one minute. P-values above plots indicate results of Wilcoxon’s test.

Category: Optogenetics | No Comments
JoyStick results with 800 Lux yellow light for PPM2 flies
on Monday, July 28th, 2025 11:15 | by Alisa Gücker
Gr28bd+TrpA1+SUC+EtOH: Control without DA inhibition and no ATR (Negative CTRL)
Gr28bd+TrpA1+SUC+ATR: Control without DA inhibition and ATR (Positive CTRL without DA-inhibition)
Gr28bd+TrpA1+3IY+ATR: Control with DA inhibition and ATR (Positive CTRL without DA-inhibition)
PPM2+SUC+ATR: Experimental group without DA inhibition and ATR
PPM2+3IY+ATR: Experimental group with DA inhibition and ATR
Category: Optogenetics | No Comments
First results from optgenetic experiments with PPM2 flies after inhibiting dopamine synthesis with 3IY
on Monday, July 21st, 2025 1:43 | by Daniel Döringer
After last week’s “breakthrough” with our method to sufficiently inhibit dopamine synthesis with 3IY it is time to start testing flies that express the optogenetic Chrimson channel in dopaminergic neurons from the PPM2 cluster.
ATR-Trial: Mix ATR directly with Sucrose / 3IY
Initially I stumbled across another problem, namely that the ATR, which is needed for the Chrimson channel to open, could not be applied in the same way as I did before. Usually, to prepare flies for JoyStick or T-Maze experiments, I would pipet 15µL of ATR onto their food. Here it was important to make sure to spread the ATR evenly across the surface since it has a bitter taste and flies would avoid consuming it if possible. This obviously would be problematic since then the basis of our experiment, optogenetic activation of the target neurons, could not be ensured.
Since for the 3IY treatment flies will not be kept in vials with the standard fly food, but vials with tissue paper soaked with sucrose, it was problematic that the tissue paper would simply soak up all the ATR in one spot. To battle this problem I tried mixing 20µL of ATR directly into the 3IY or sucrose solution. To confirm that this method still works I conducted a first trial only with control flies:
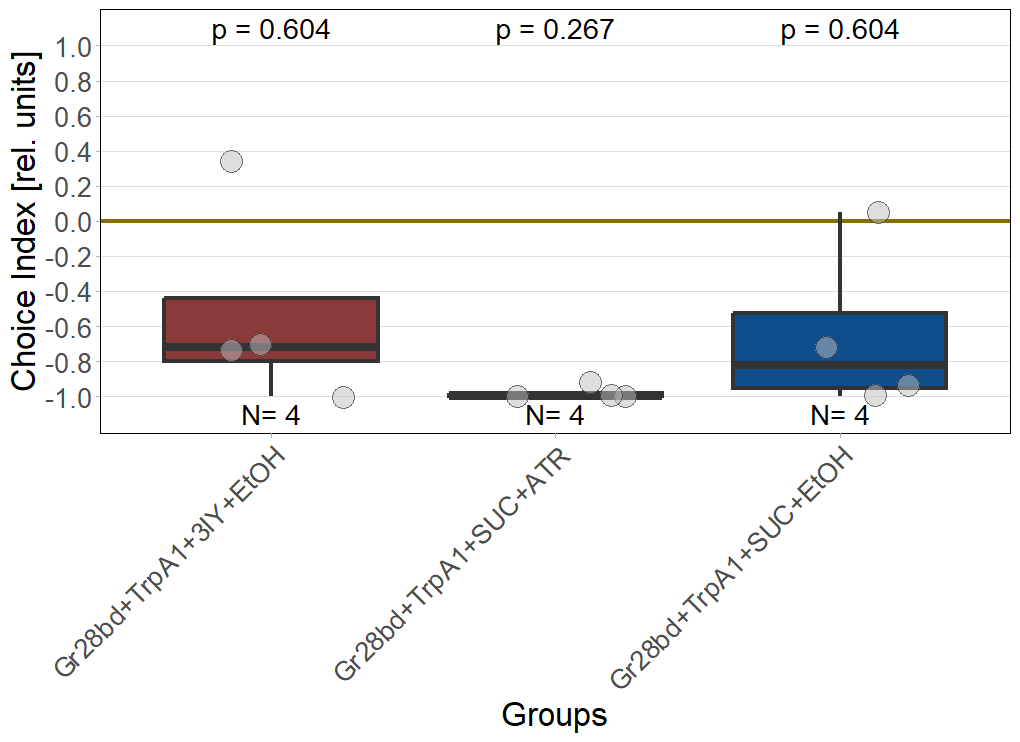
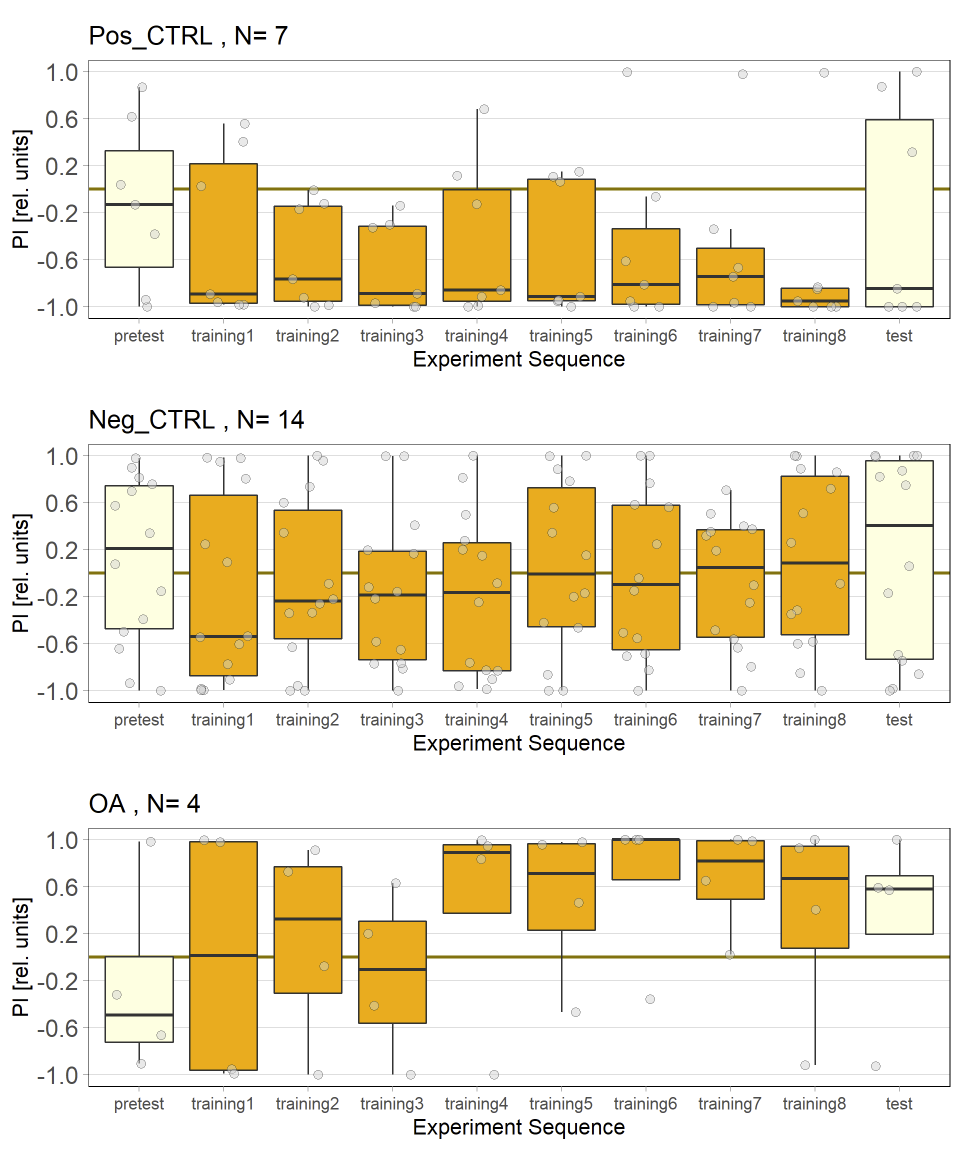
Flies that were kept in vials where the sucrose/3IY solution was not supplemented with ATR should not be affected by the light and should therefore not show any preference (CIs close to zero). Flies that could feed on ATR should avoid the light and show negative CIs, since the fly strain expresses the optogenetic channel in heat-sensing neurons and activation of these neurons would lead to an unpleasant sensation of heat.
The very low sample size is most likely the reason why both Negative control are not 0, but the fact that the group which was supplemented with ATR shows CIs close to -1 indicates that it’s okay to simply mix the ATR with the sucrose/3IY solution.
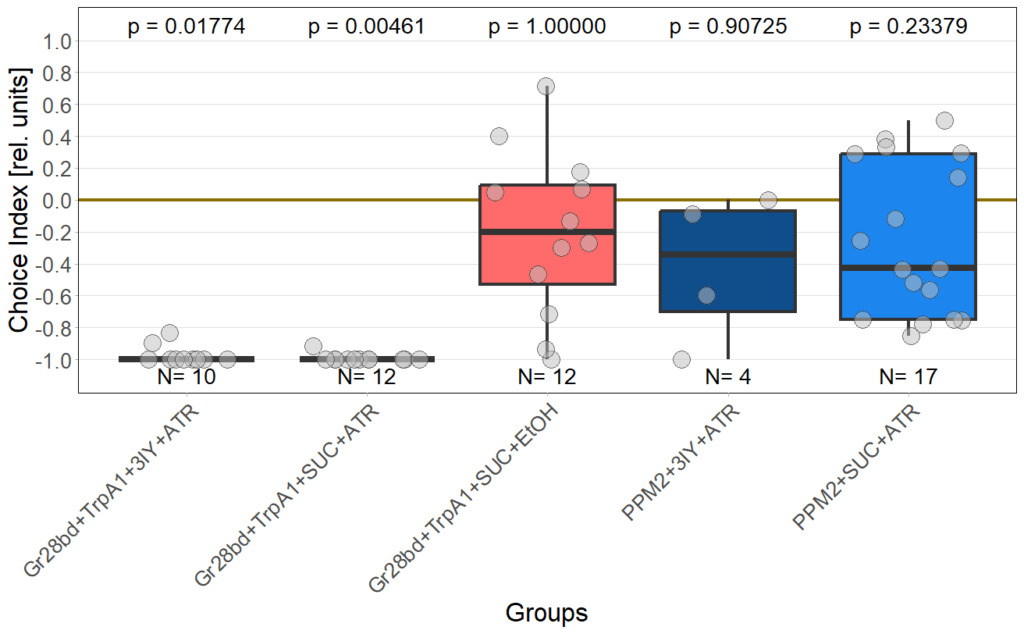
JoyStick-Results
After confirming the method to apply ATR we started JoyStick experiments with 5 groups:
Gr28bd+TrpA1+SUC+EtOH: Control without DA inhibition and no ATR (Negative CTRL)
Gr28bd+TrpA1+SUC+ATR: Control without DA inhibition and ATR (Positive CTRL without DA-inhibition)
Gr28bd+TrpA1+3IY+ATR: Control with DA inhibition and ATR (Positive CTRL without DA-inhibition)
PPM2+SUC+ATR: Experimental group without DA inhibition and ATR
PPM2+3IY+ATR: Experimental group with DA inhibition and ATR

For now the results look okay. CTRL groups with ATR already tend to avoid optogenetic activation, which is good. For all other groups a larger sample size (target = 50) is needed.
Category: Optogenetics | No Comments
Final JoyStick results with 800 Lux yellow light for 17D-Gal4
on Monday, July 21st, 2025 12:46 | by Alisa Gücker

Category: Optogenetics | No Comments
The never ending story has ended
on Monday, July 14th, 2025 2:00 | by Daniel Döringer
After 7 attempts to figure out the treatment with the dopamine-synthesis inhibitor 3IY we finally managed to get it right.
Trial 6 was a minor set back since I used the same method that had worked before but prepared 8 mL instead of 2 mL. 3IY is not really soluble so I thought that the first “fraction” of the solution might not contain enough of the inhibitor to sufficiently deplete dopamine. I tested WTB flies with the first fraction of the 8 mL preparation.

I did not observe differences between groups. N(3IY)= 14; N(SUC) = 12
Since I cannot prepare the 3IY for each vial I am going to use (~ 8 per testing day) separately and put them on the vortex for 30 minutes each I tried if shortly vortexing and stirring afterwards would enough. Additionally, I tried tissue and filter paper again since the previous tissue paper trial might have had the same problem that 3IY was not present in high enough amounts in the first fraction.

N= 14 for each group; FP = fitler paper; TP = tissure paper
Since this method seems to work, I can now prepare enough vials at the same time and start with the actual experiments. I only need to figure out how to apply the ATR….
Category: Optogenetics | No Comments
on Monday, July 14th, 2025 1:56 | by Julia Schulz


Category: operant self-learning, Optogenetics | No Comments