Preference results: pure vs salt
on Monday, June 26th, 2023 1:45 | by Maja Achatz
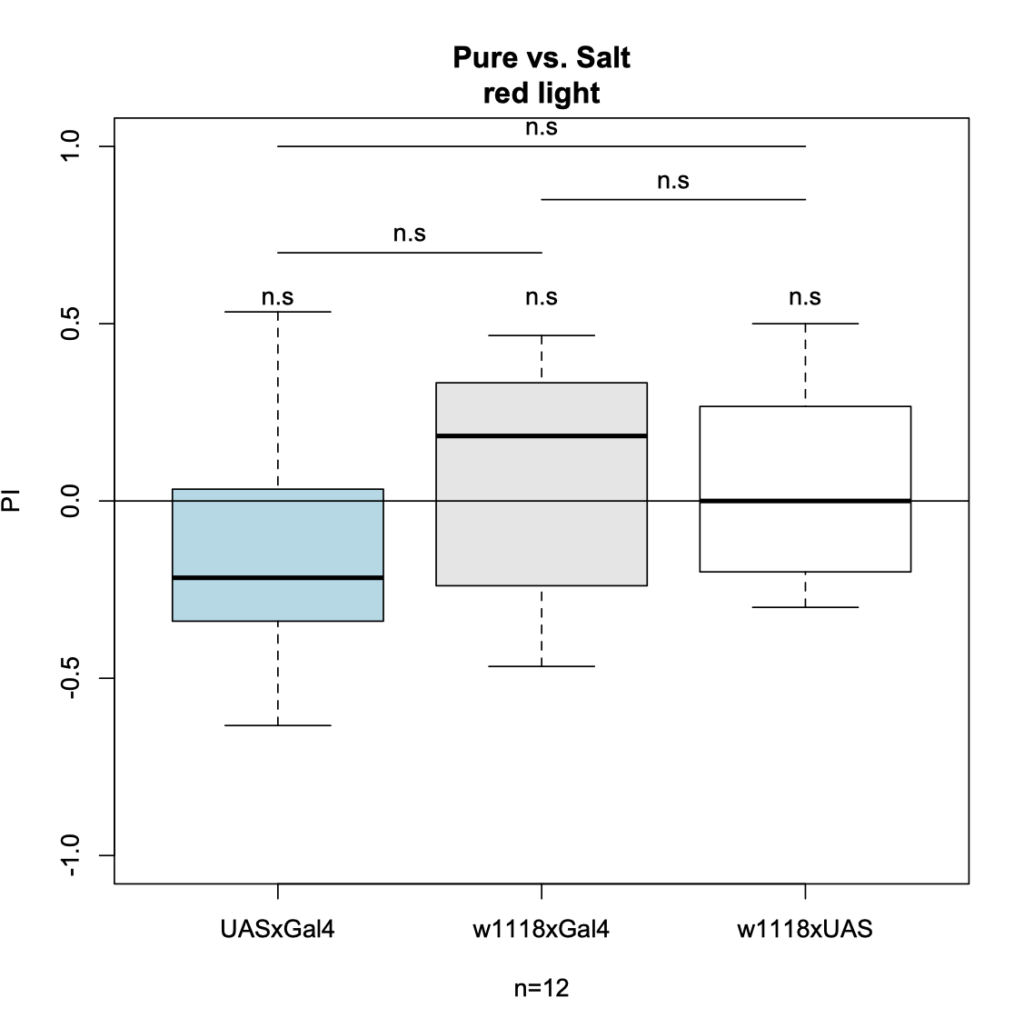
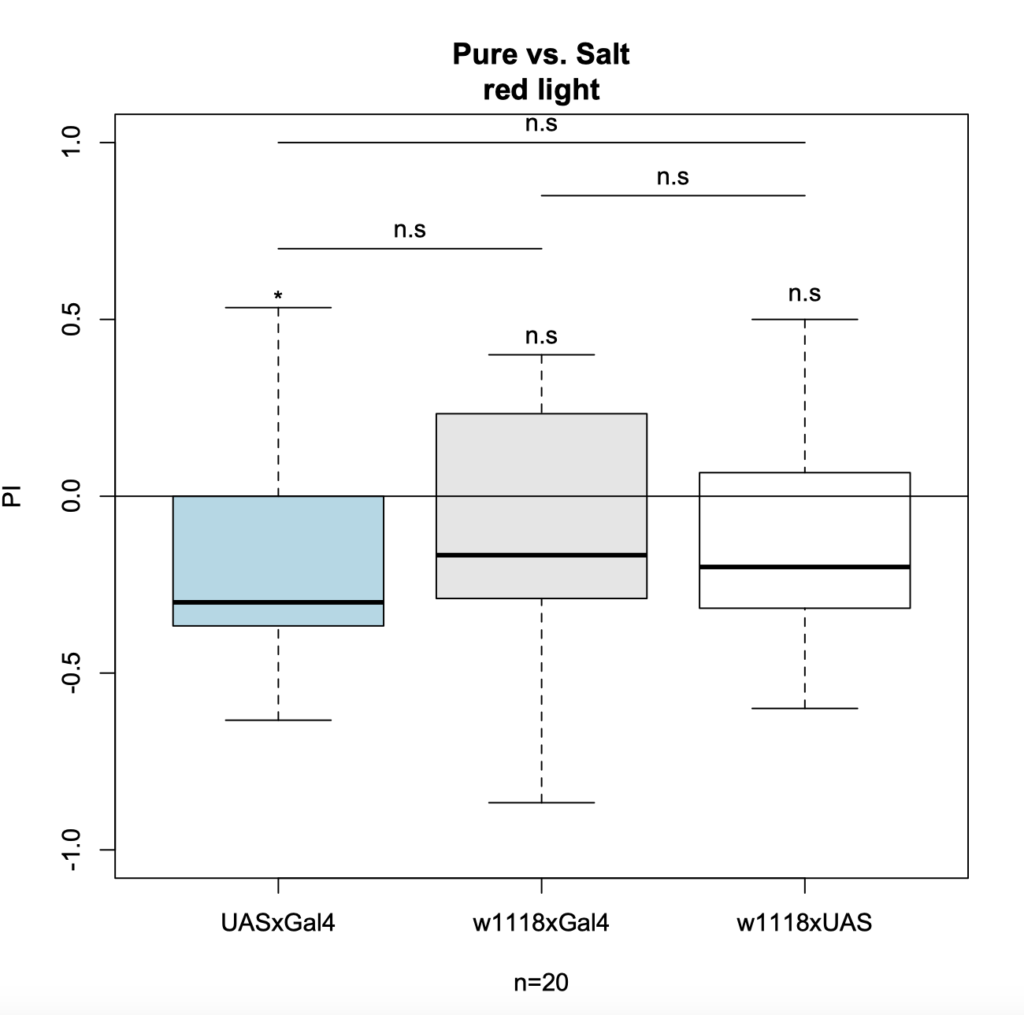
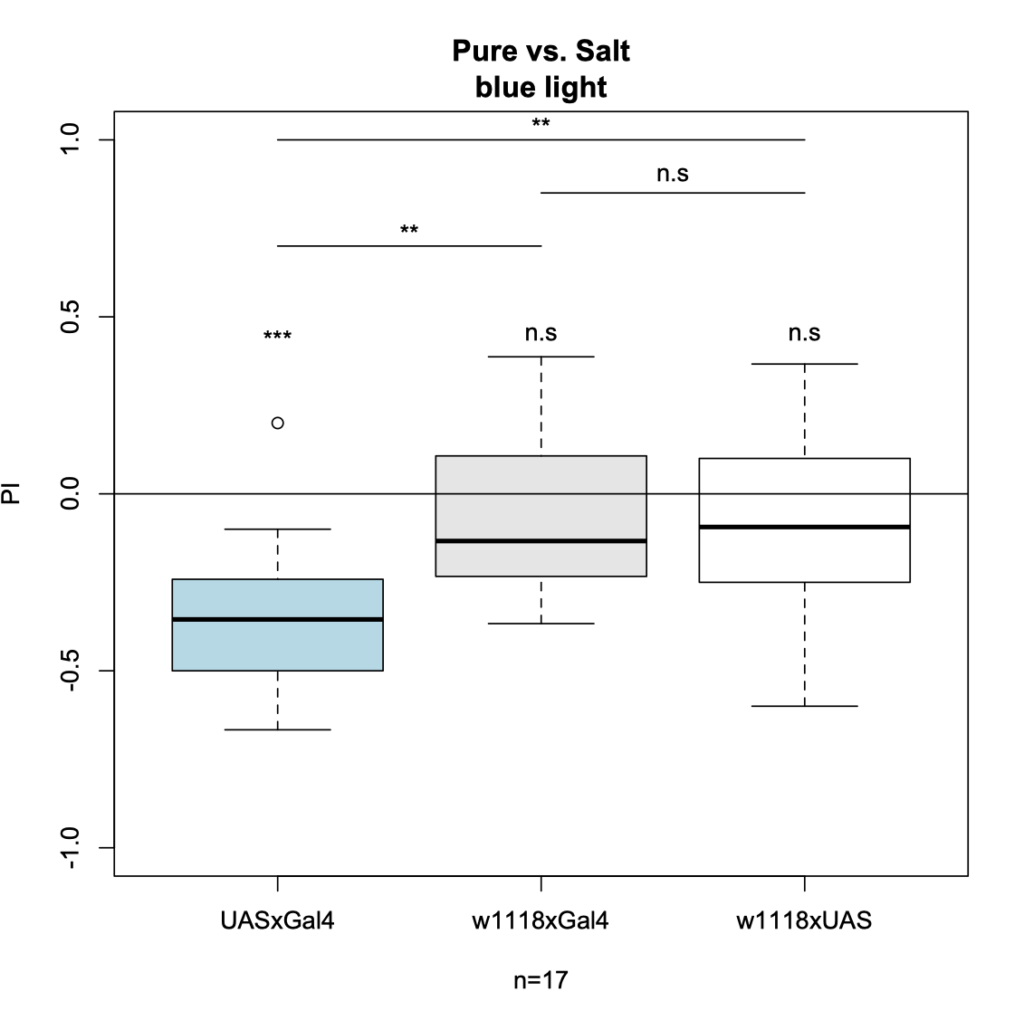
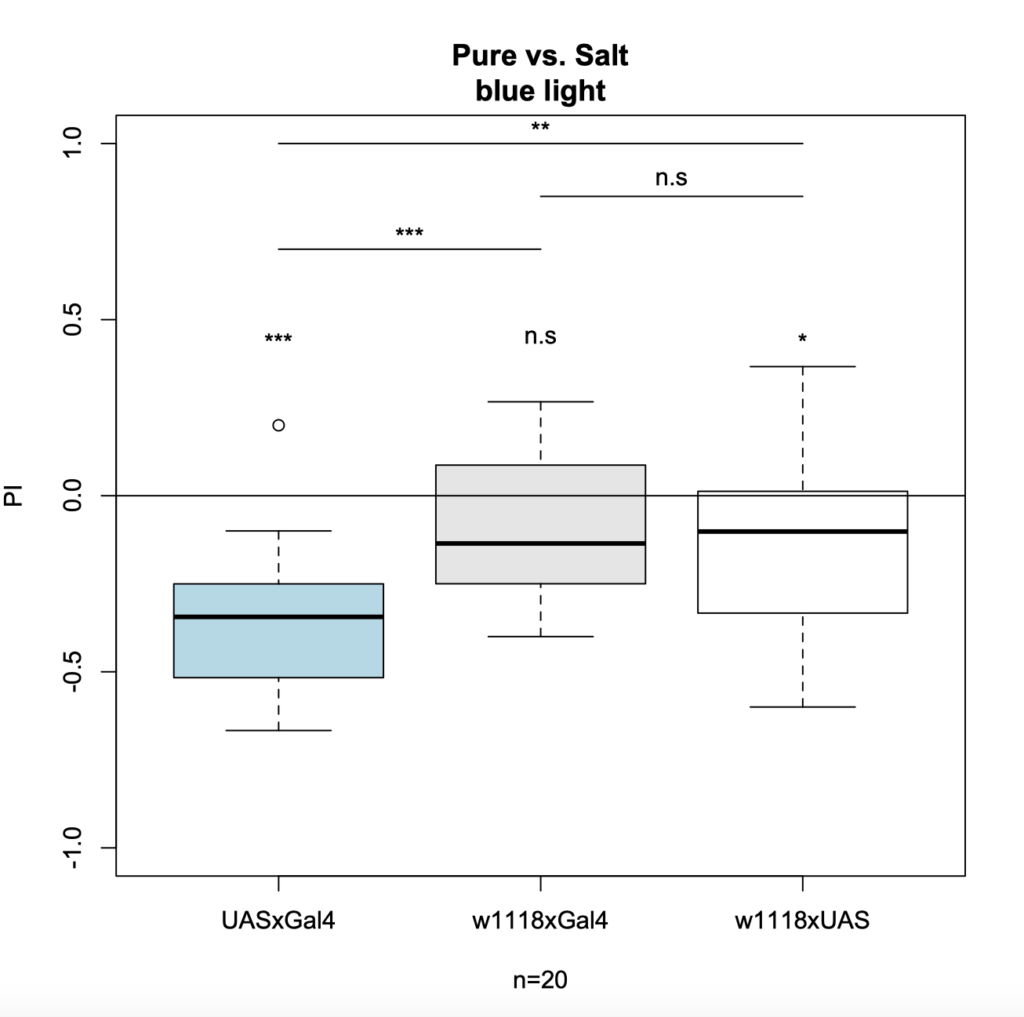
The first plot of each group show my results from the week before, and the ones beneath show the final results for red and blue light, after filling the sample size up to 20n.
Red light:
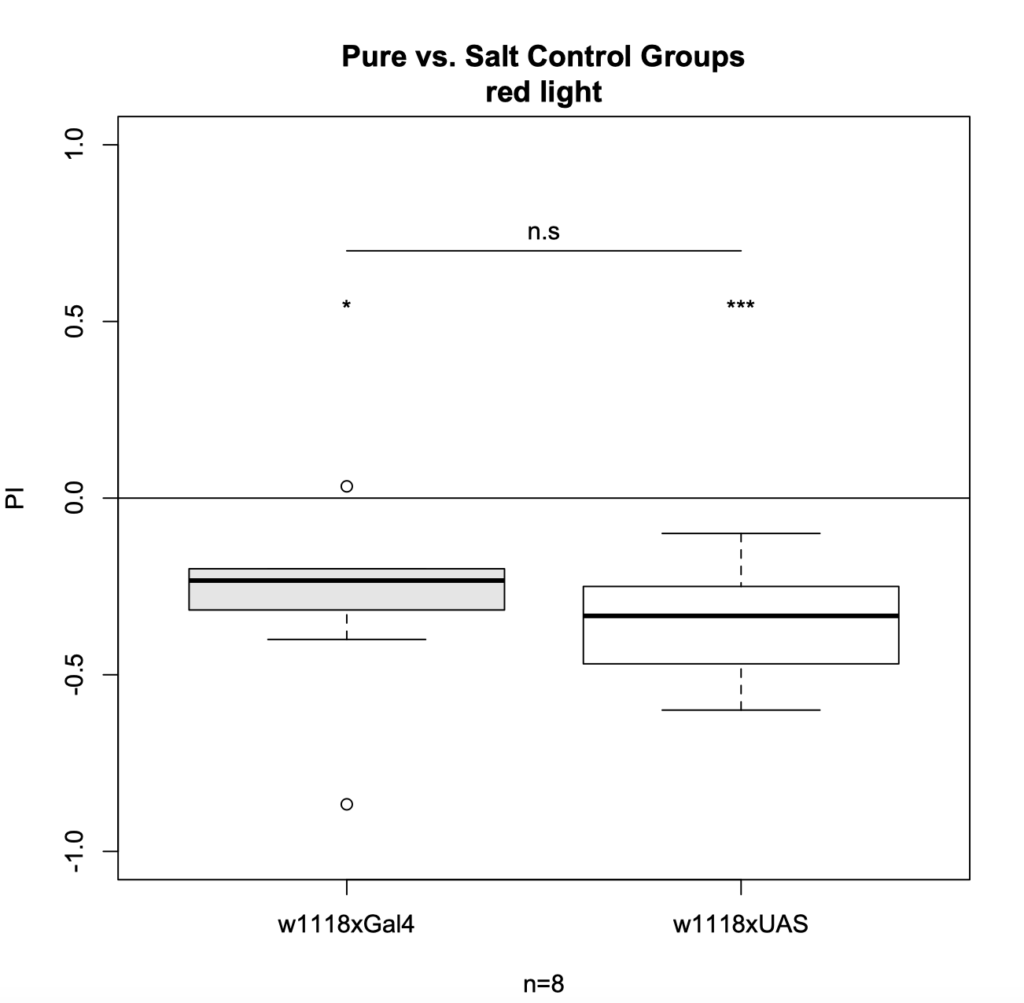
for comparison, this plot shows the control groups for the remaining 8n I had left separately:
Blue light:

Category: Larve, Optogenetics
Leave a Reply