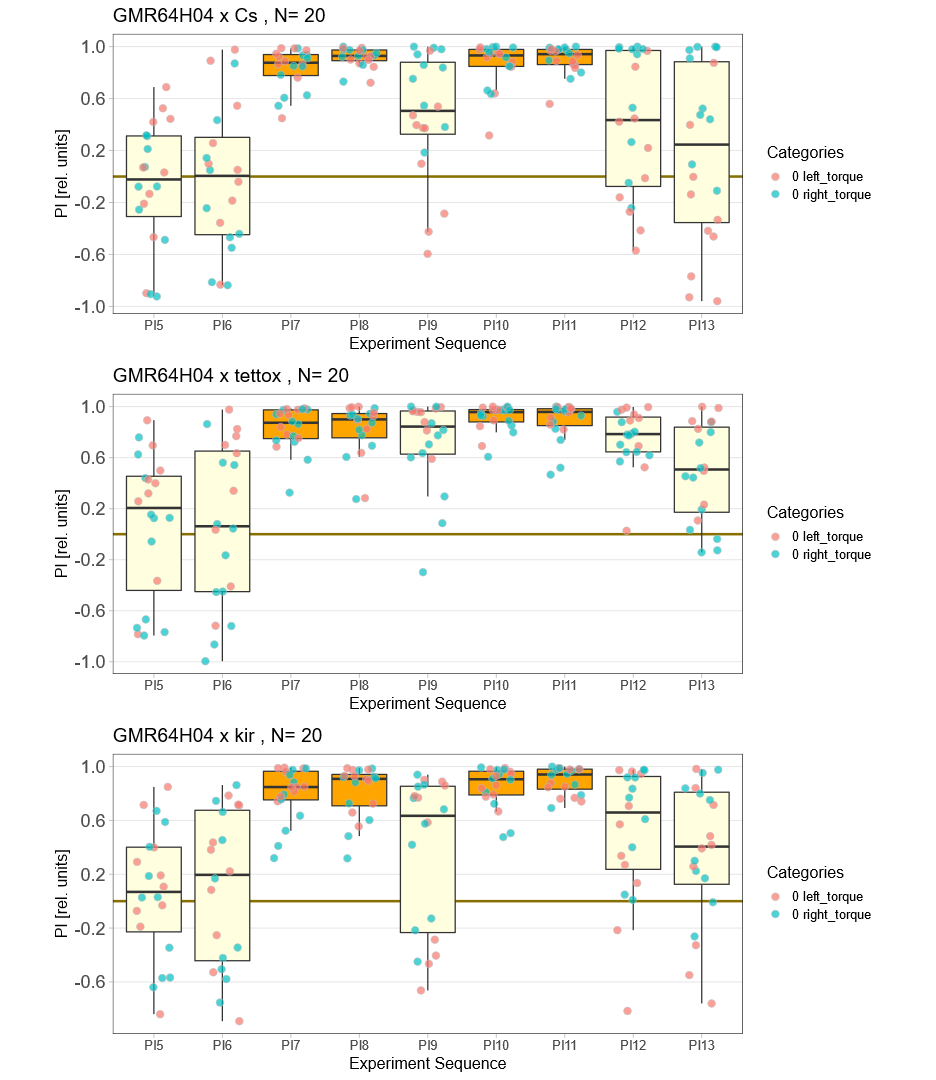
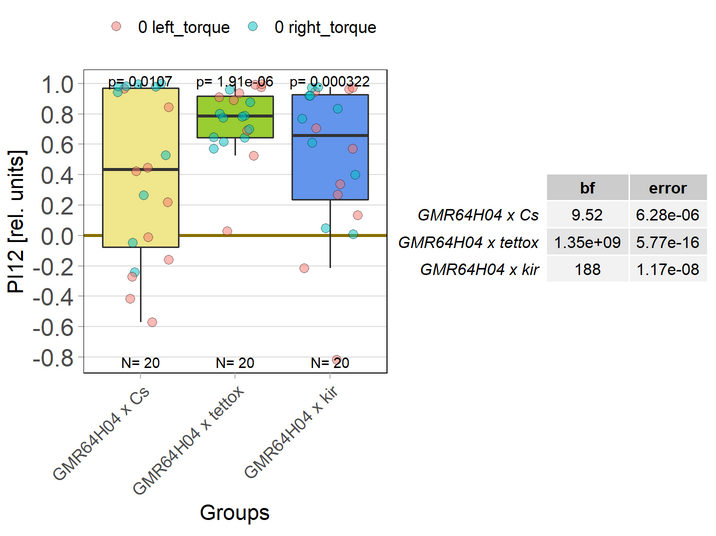
GMR64H04 (EB) blocking
on Monday, July 5th, 2021 11:51 | by Andreas Ehweiner
Blocking of the line GMR64H04 (EB, females) with males of Tetox (28838) or Kir (6595).

Category: flight, Memory, Operant learning, operant self-learning | No Comments
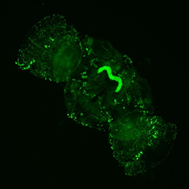
FoxP aPKC schematics
on Monday, June 7th, 2021 8:16 | by Andreas Ehweiner

Category: Foxp, Memory, operant self-learning, PKC, Uncategorized | 1 Comment
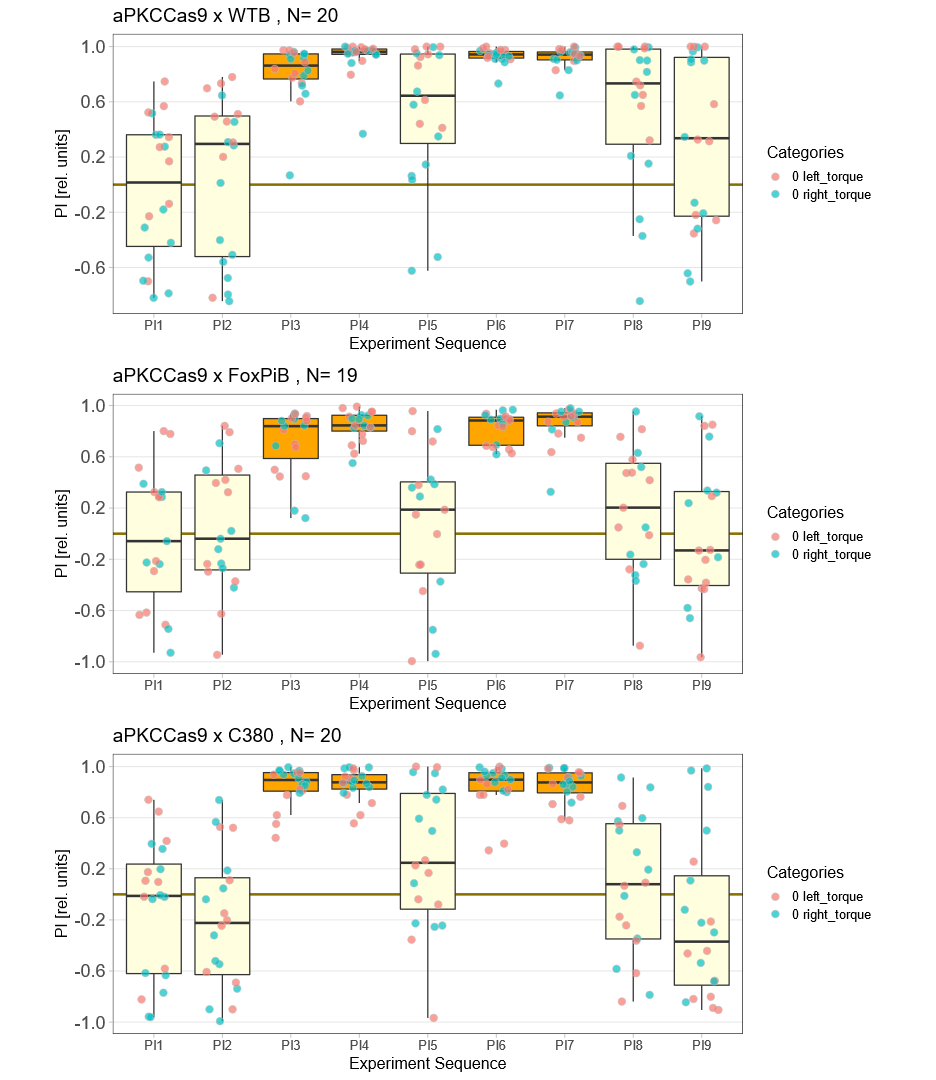
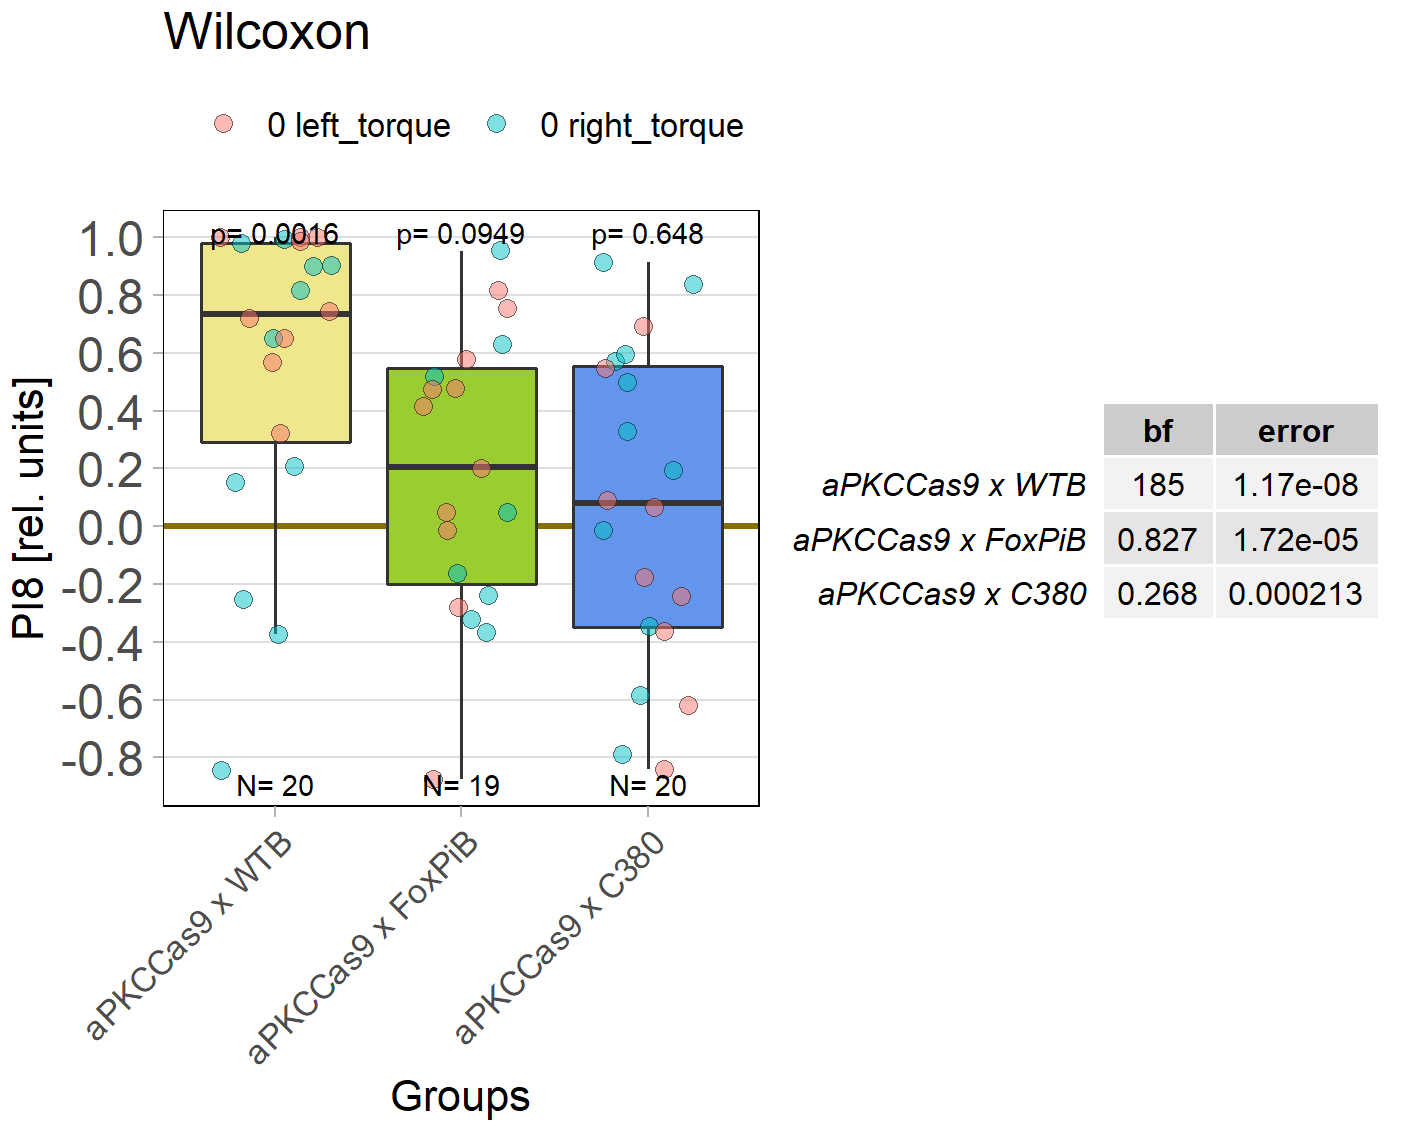
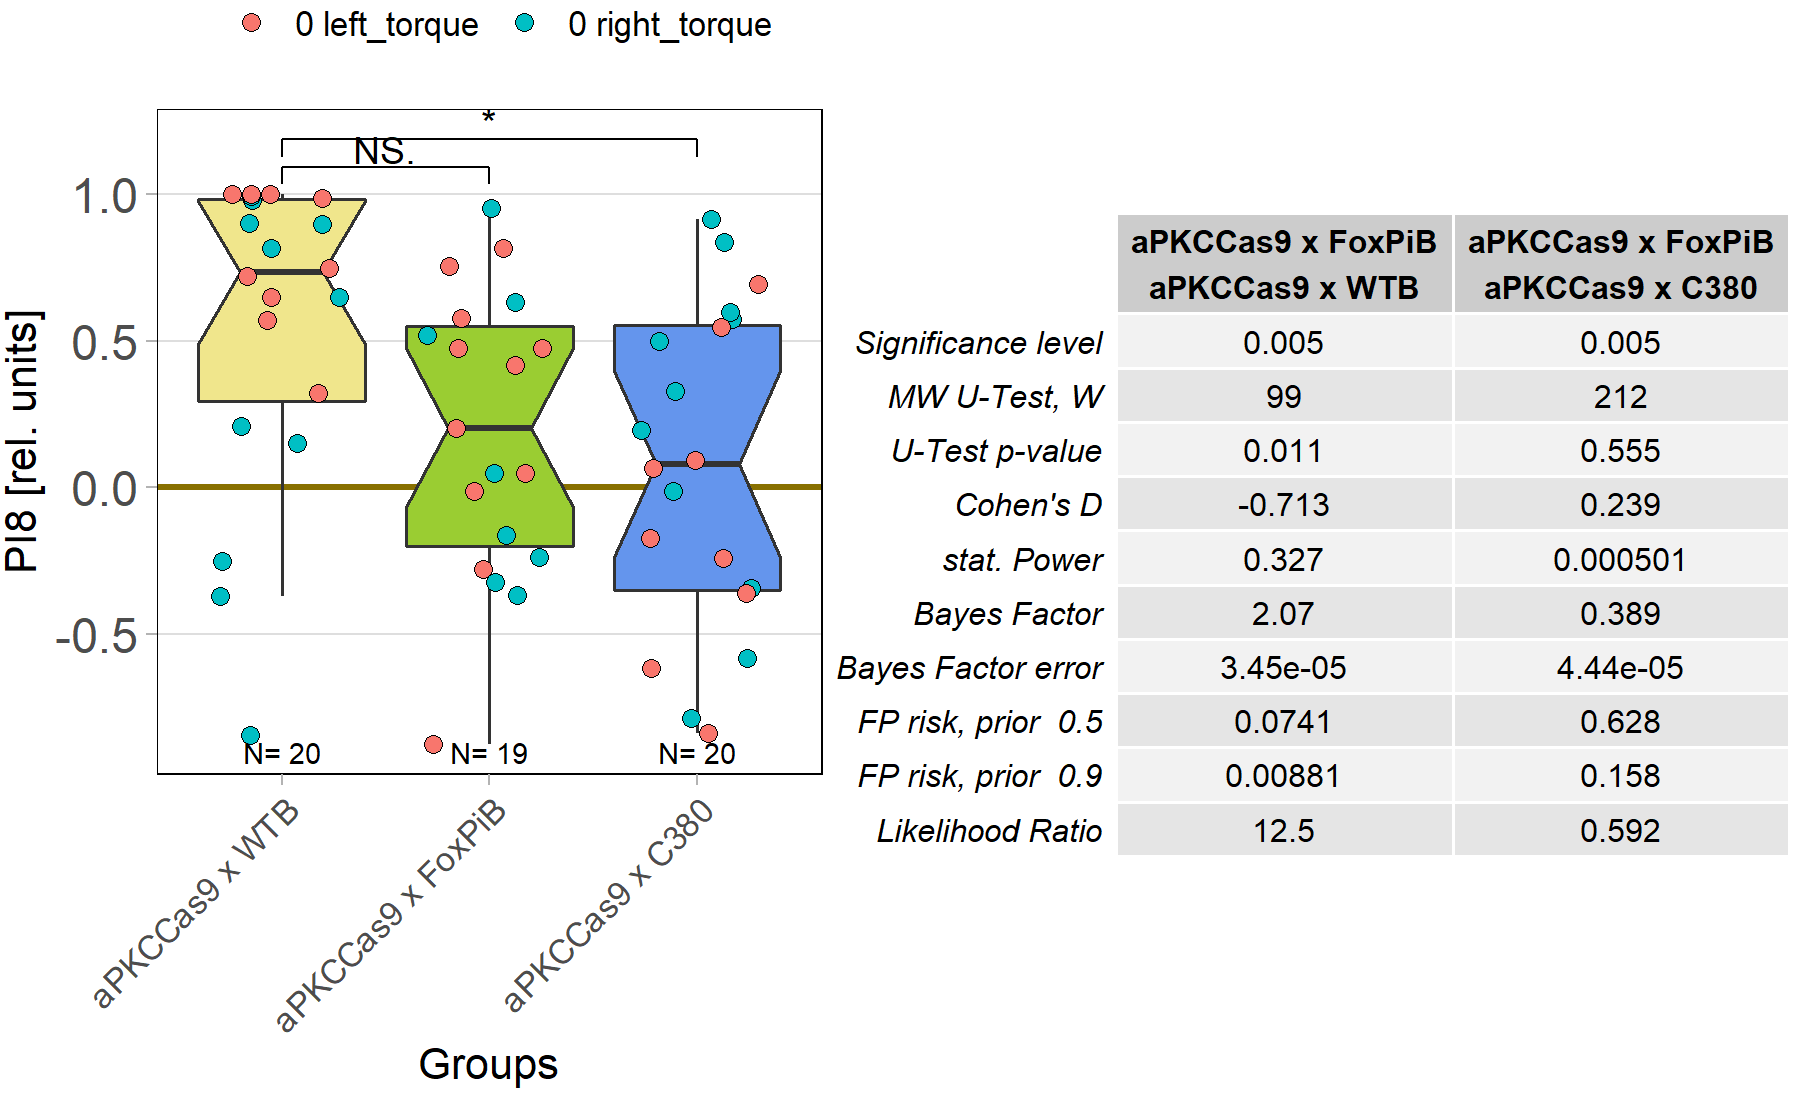
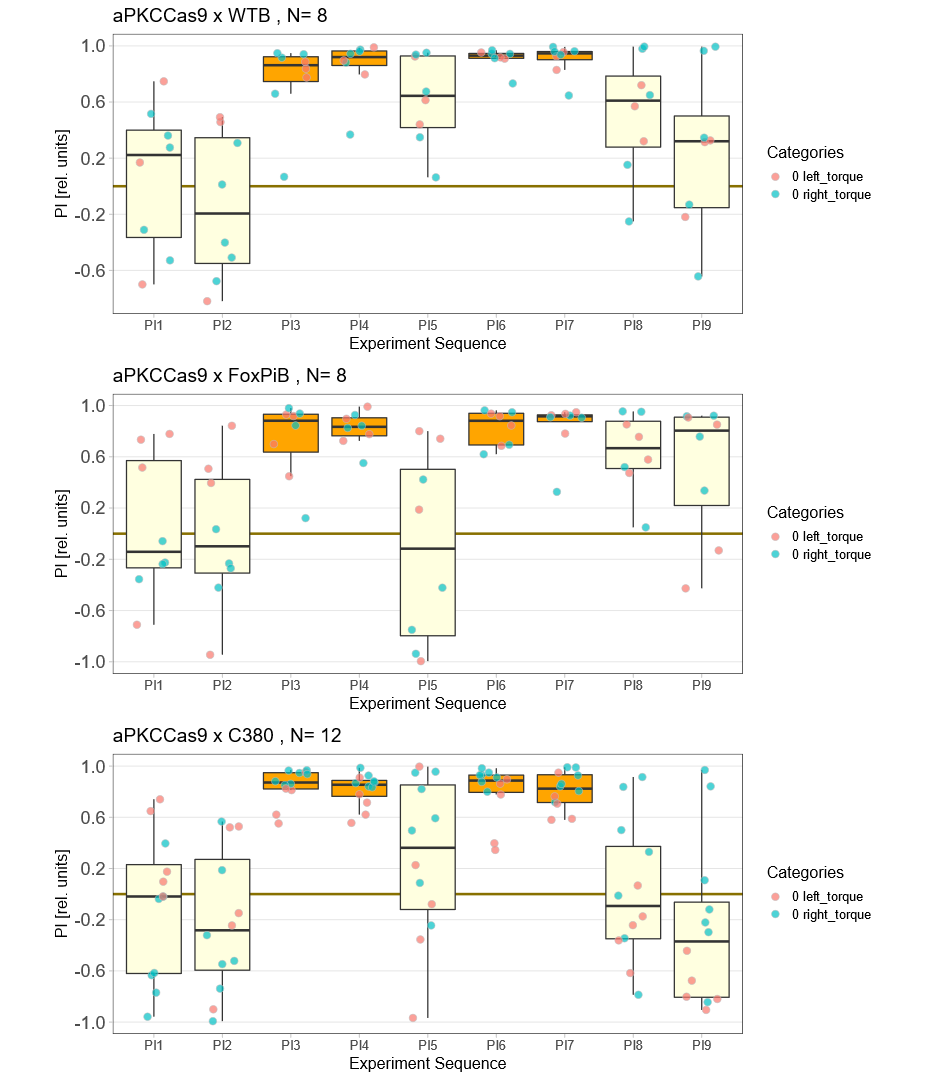
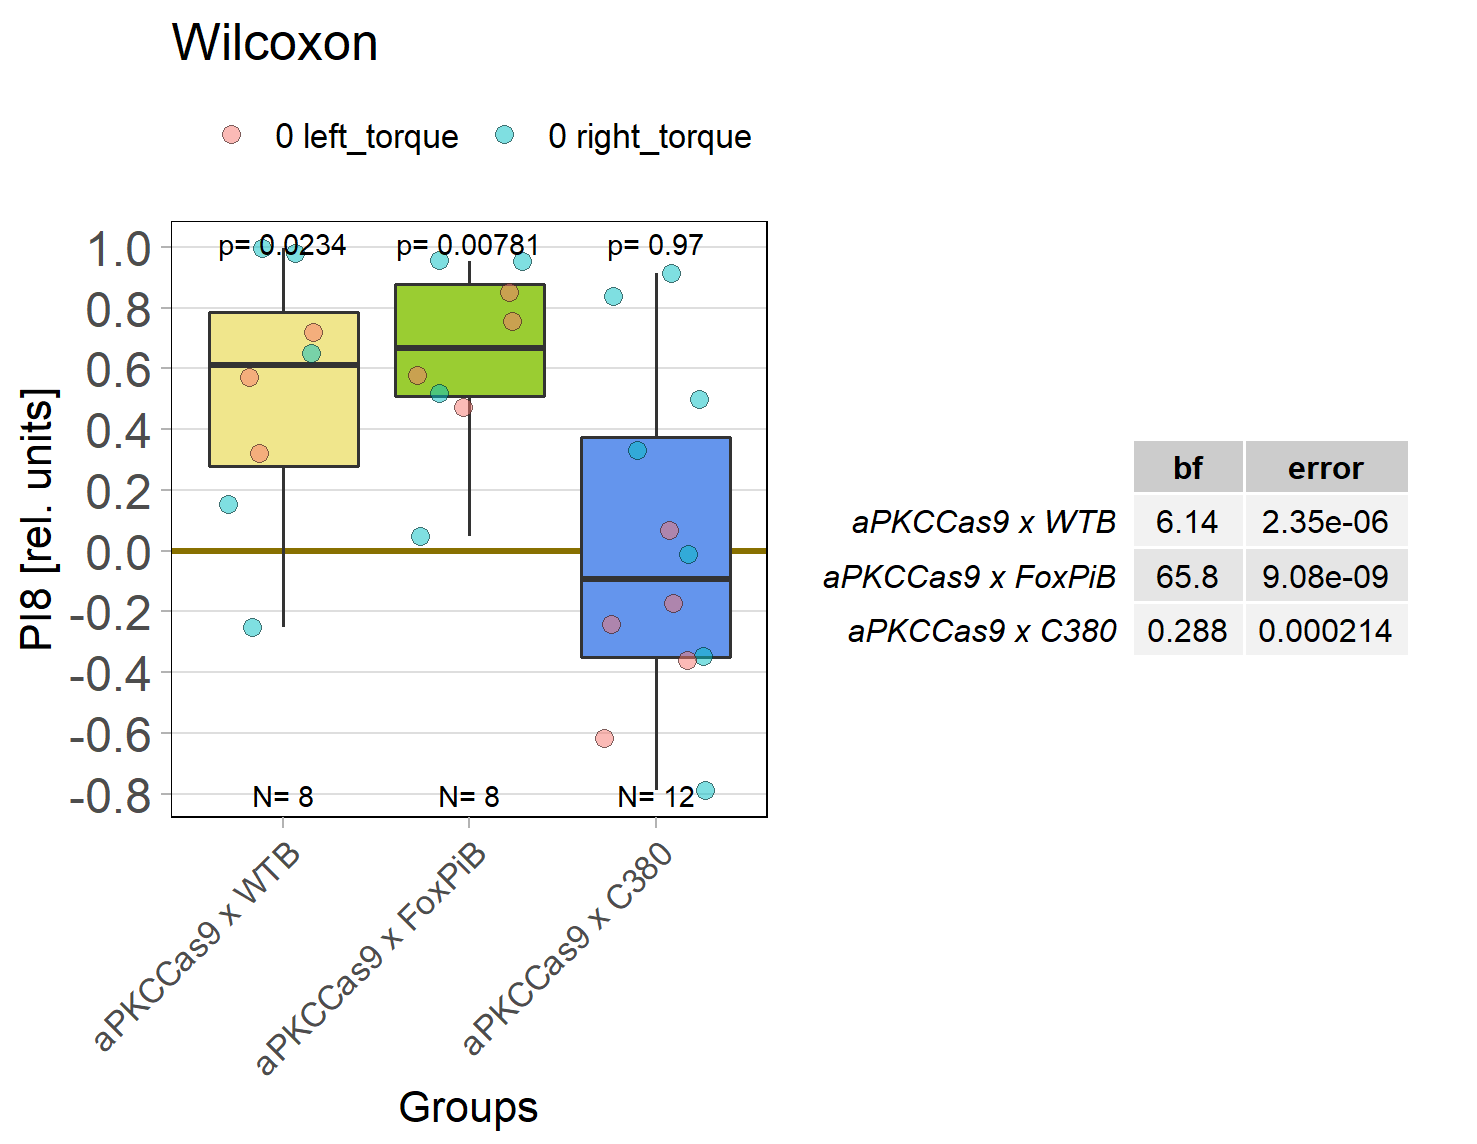
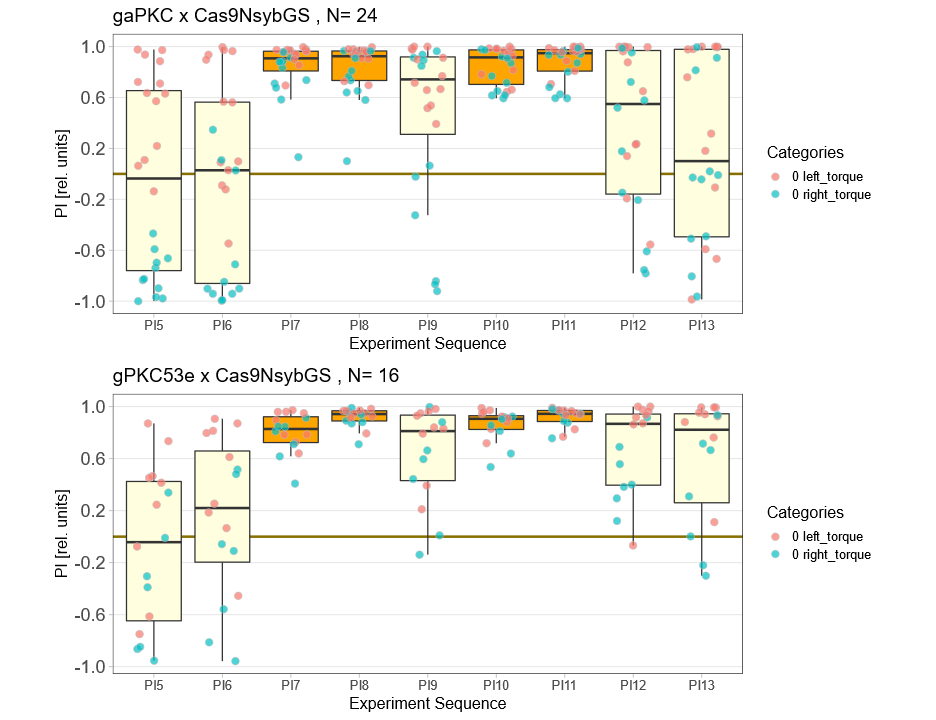
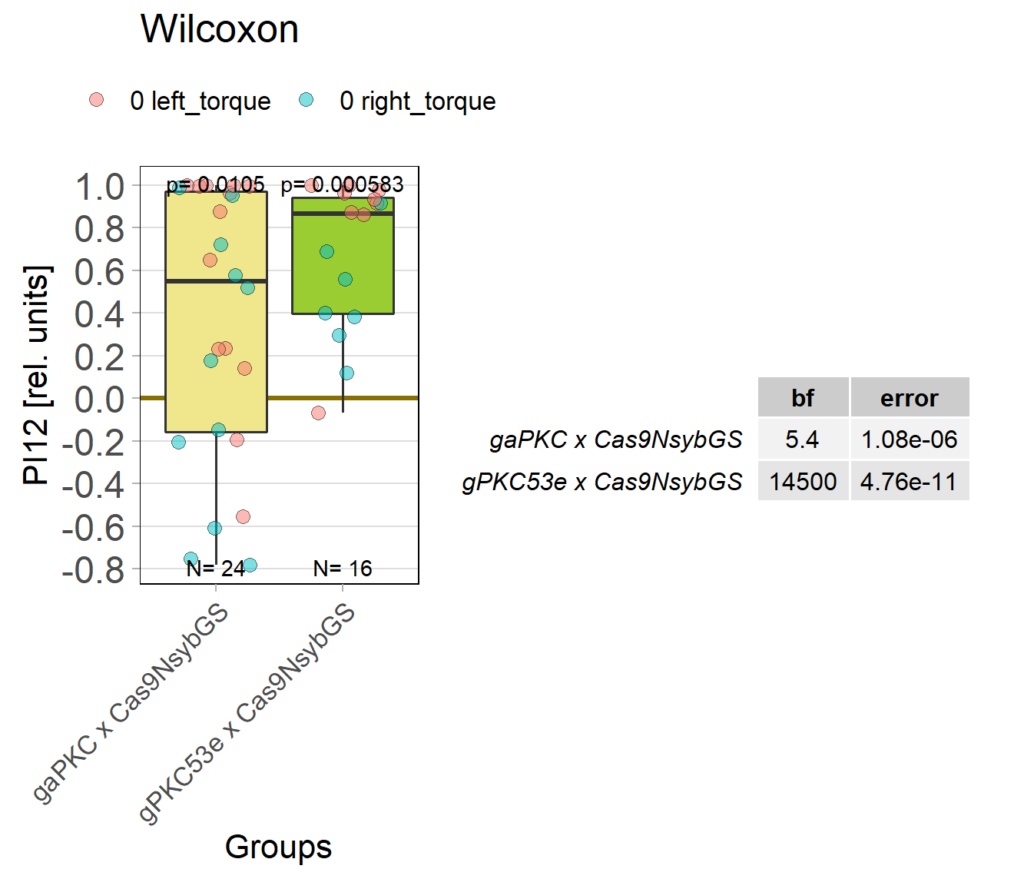
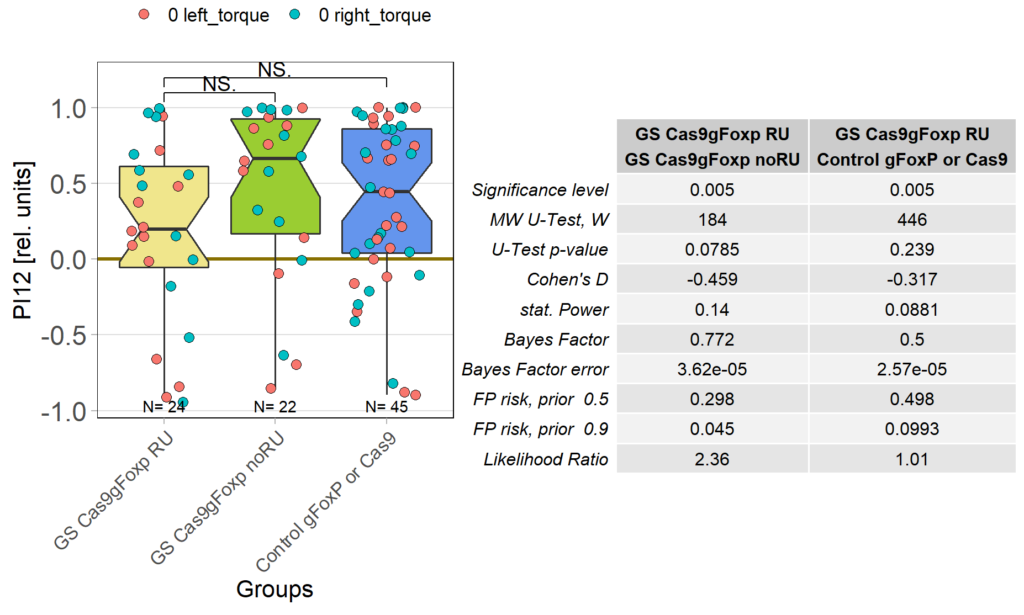
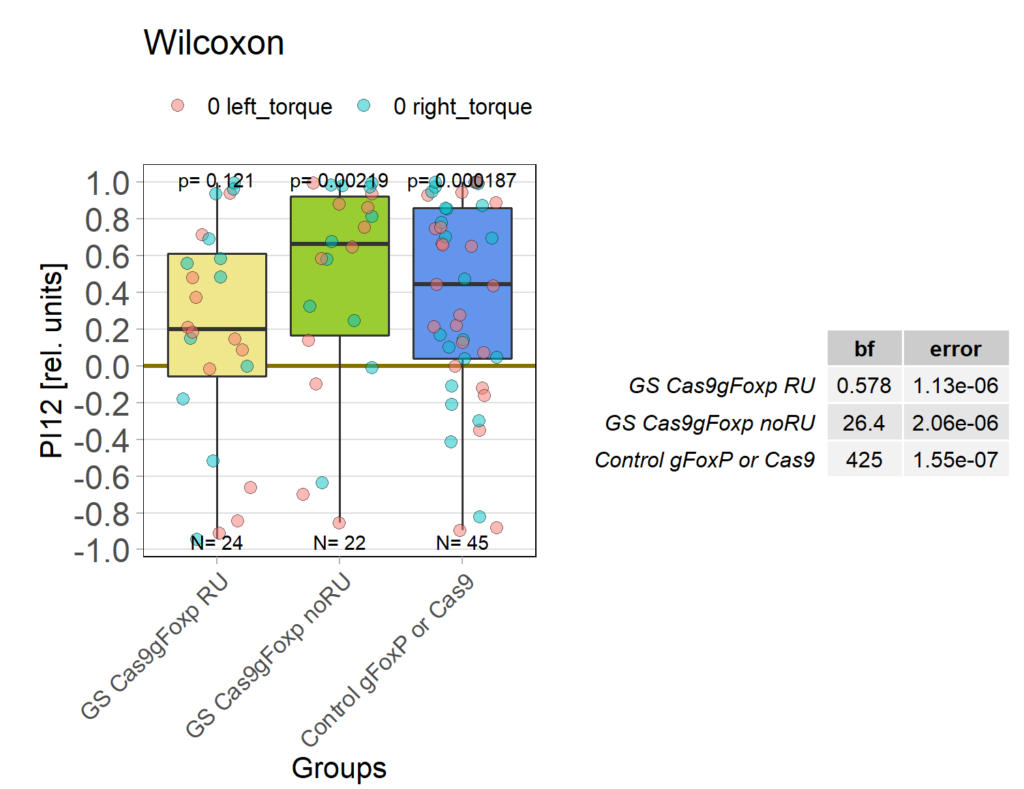
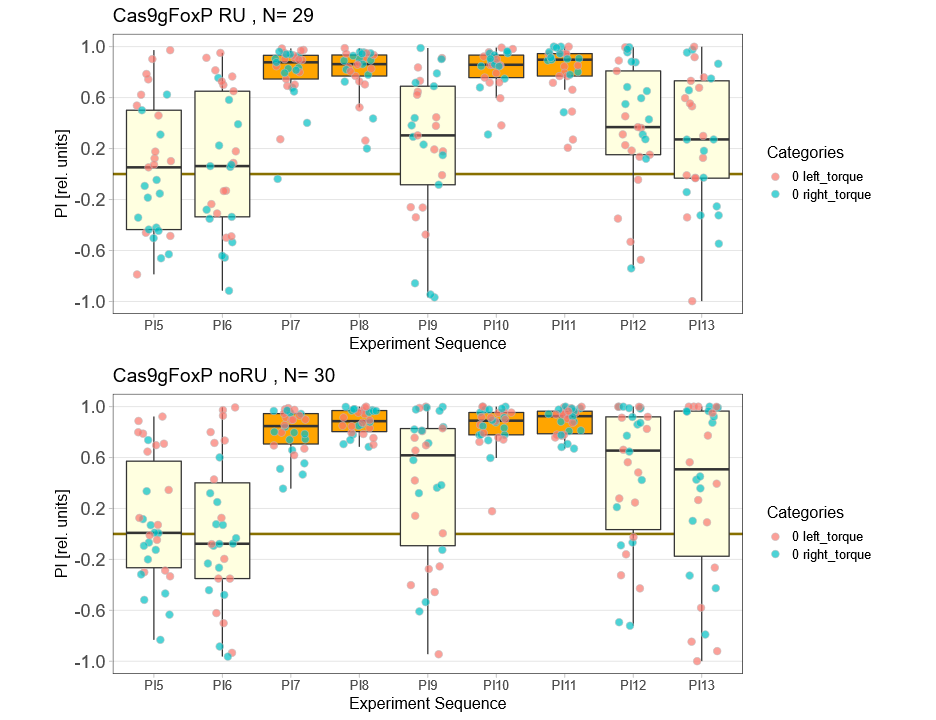
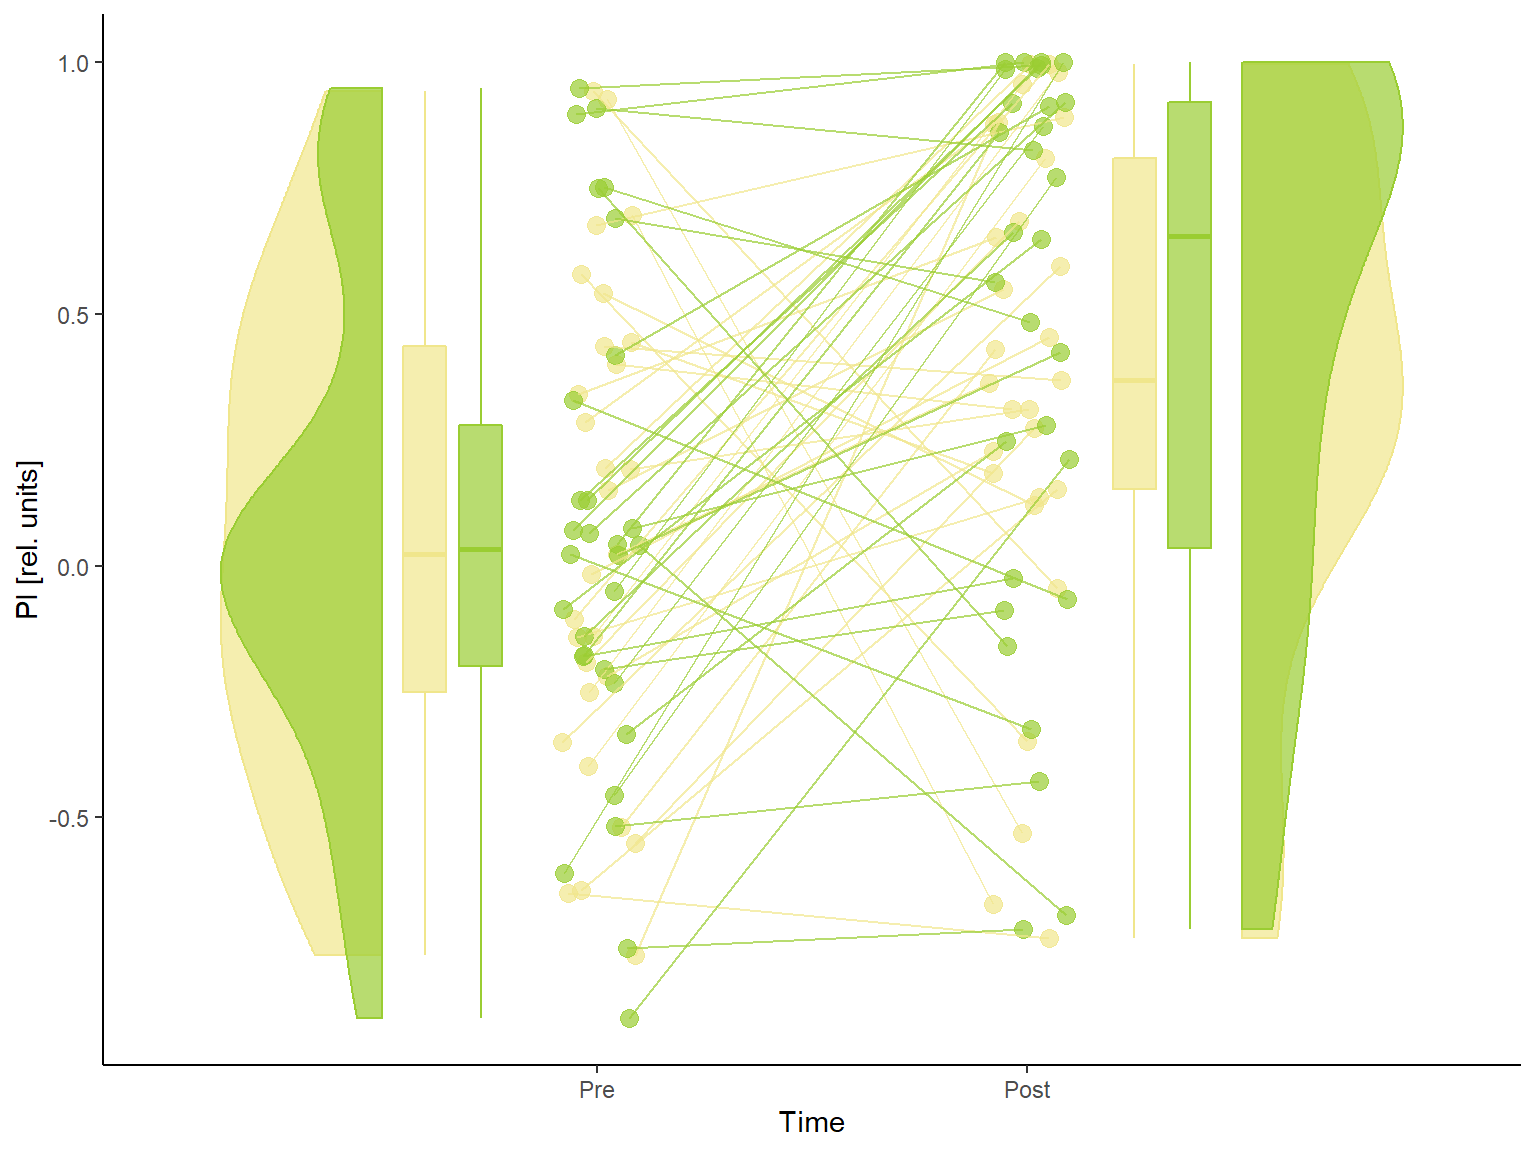
aPKC knockout update
on Tuesday, May 25th, 2021 1:52 | by Andreas Ehweiner
aPKC was knock out using CRISPR Cas9 mediated editing.
Category: flight, Foxp, Memory, Operant learning, operant self-learning, PKC, Uncategorized | No Comments
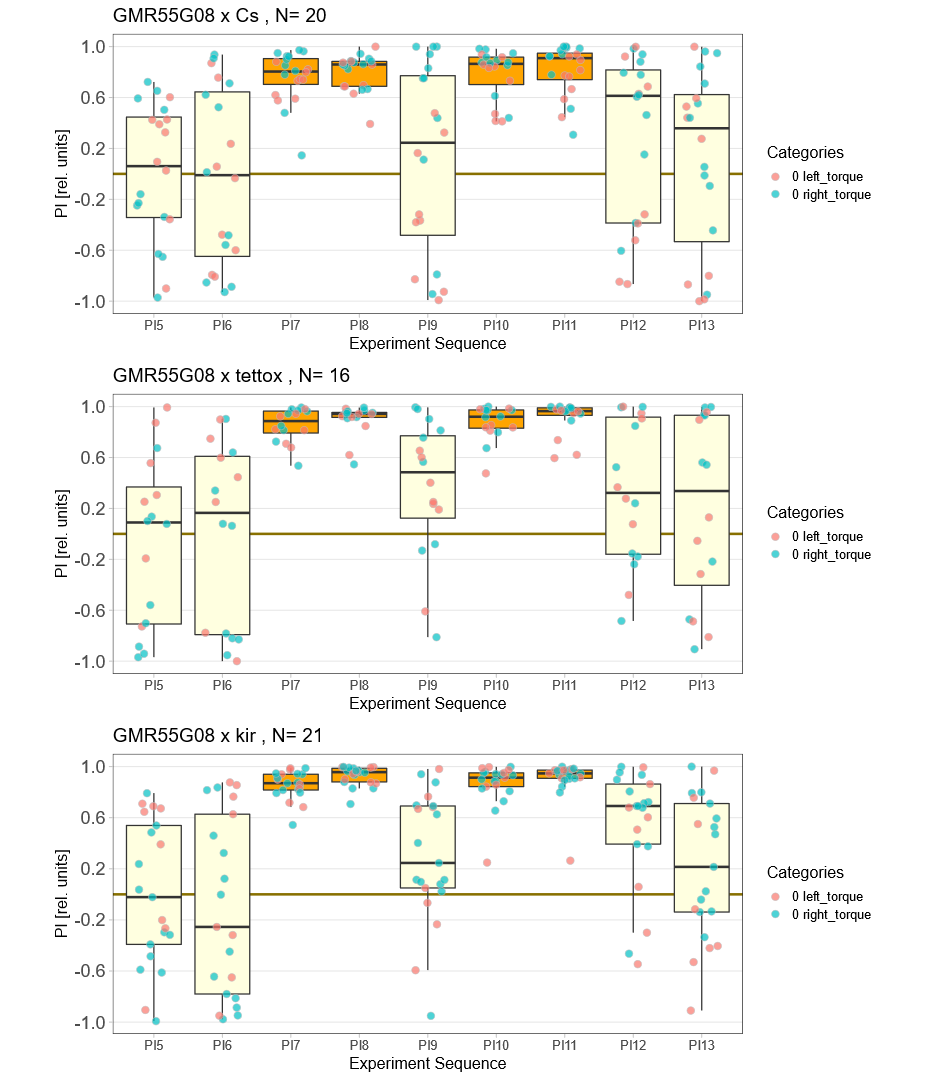
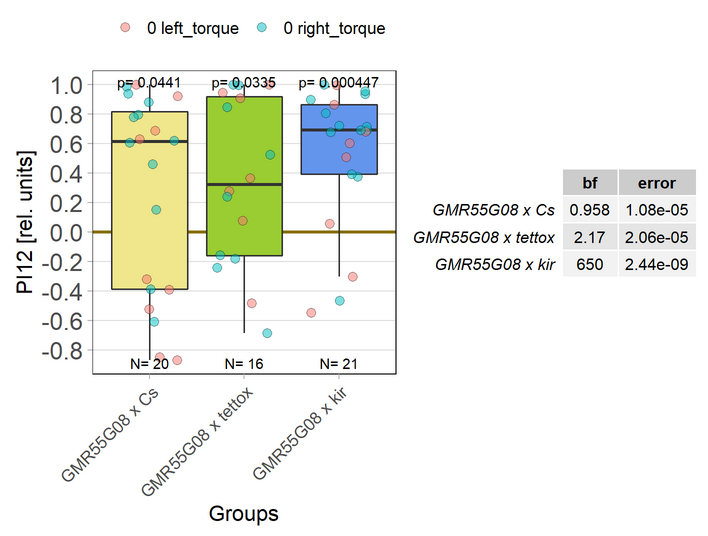
GMR55G08 (PCB) blocking
on Monday, May 17th, 2021 1:15 | by Andreas Ehweiner
Blocking of the line GMR55G08 (PCB, females) with males Tetox (28838) or Kir (6595).
Category: flight, Memory, Operant learning, operant self-learning, Uncategorized | No Comments
aPKC knock-out
on Monday, May 17th, 2021 1:05 | by Andreas Ehweiner
aPKC was knock out using CRISPR Cas9 mediated editing.
Category: flight, Foxp, Memory, Operant learning, operant self-learning, PKC, Uncategorized | No Comments
PKC gRNA
on Monday, April 12th, 2021 11:07 | by Andreas Ehweiner
Comparison of the kock out of aPKC and PKC53e in adutl flies.
Category: flight, Memory, Operant learning, operant self-learning, PKC, Uncategorized | No Comments
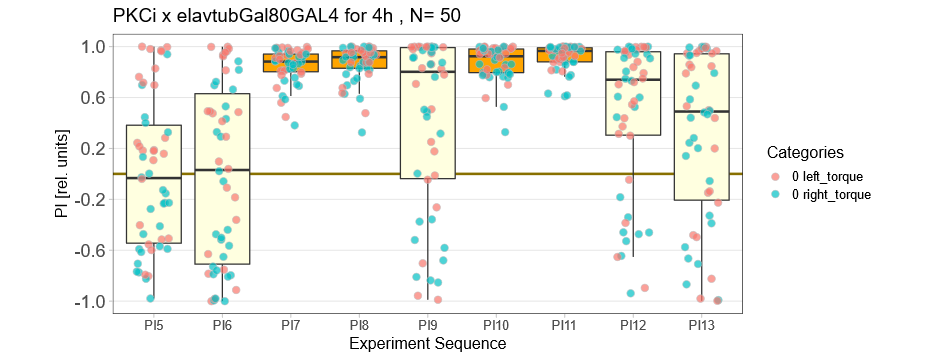
Problems with PKCi
on Monday, April 12th, 2021 10:55 | by Andreas Ehweiner
ElavGal4;tubGal80 X UASPKCi were raised at 18°C. Before the experiment they spent 4h at supposedly 35°C. Since they still show a stong learning phenotype the temperatur might have not been right.
Category: flight, Memory, Operant learning, operant self-learning, PKC, Uncategorized | No Comments
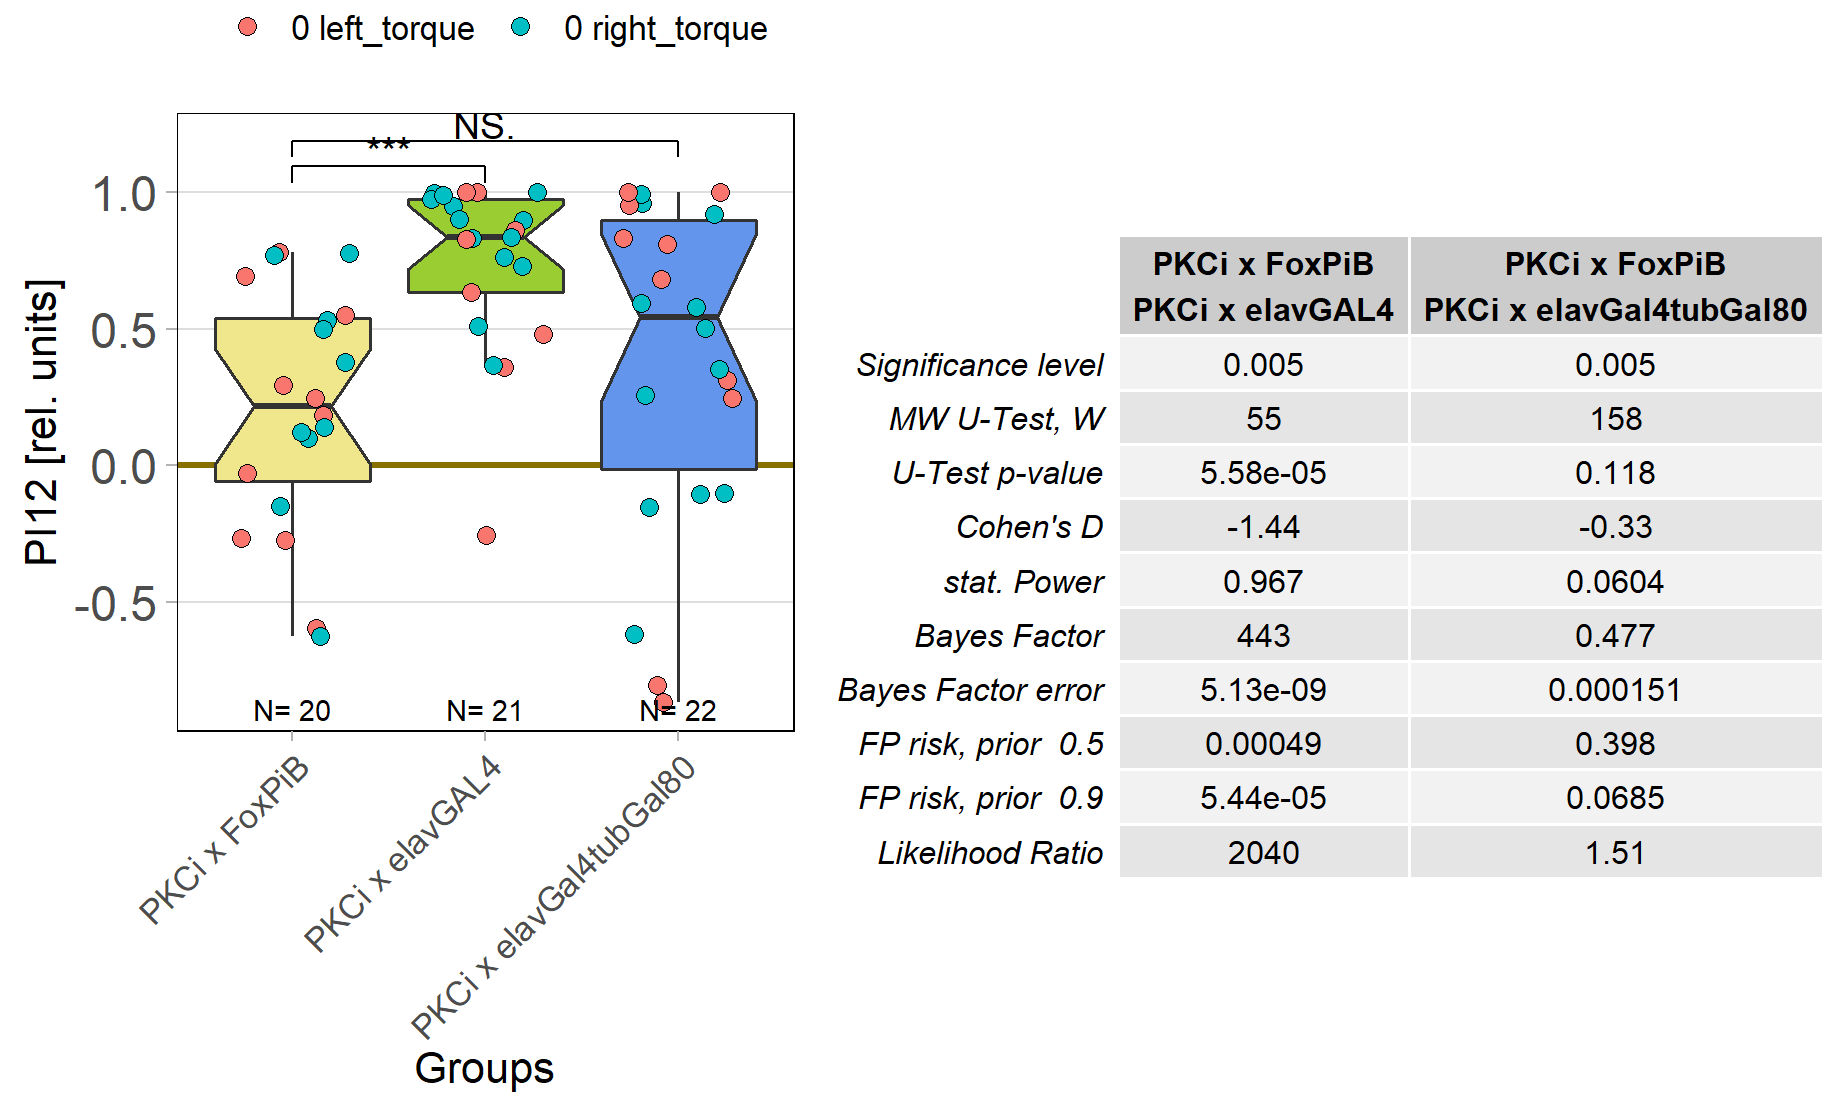
PKCi
on Monday, March 22nd, 2021 12:35 | by Andreas Ehweiner


Category: flight, Foxp, Memory, Operant learning, operant self-learning, PKC | No Comments
14 day NsybGS
on Monday, March 1st, 2021 2:08 | by Andreas Ehweiner
Experimenal flies were placed for 2 days on RU486. 14 day old flies were testet.

Category: flight, Foxp, Operant learning, operant self-learning | No Comments
Test of 7 days old flies after GS
on Monday, February 15th, 2021 9:35 | by Andreas Ehweiner

Category: flight, Foxp, Memory, Operant learning, operant self-learning, Uncategorized | No Comments