Passing the halfway mark
Finally have about half the number of flies needed. It looked like the flies that used the FoxP virgins didn’t fly as well as the other flies, so we dropped that branch and have stopped using them for the crosses. Pooling the FoxP>aPKC/CRISPR flies no increases the N in this group:

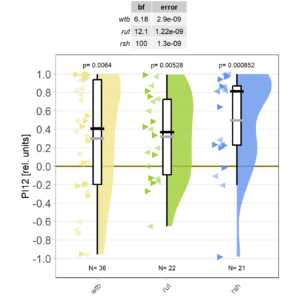
Adding flies and fixing figures
Added more flies to the aPKC knock-out in FoxP neurons. Now the knock-outs are close to zero, but one of the controls, too. Still too early to say much. The figure looks ok now, but the Bayes Factors get chopped off. need to fix this. As I’m, already working on some figures (histograms) in the code, I can fix this as well.

First data from aPKC knock-out in FoxP neurons
When Andi tested his aPKC CRISPR knock-outs, he used the Tang torque meter setup, where the OMRs aren’t recorded. So I’m attempting to replicate his results and compare OMRs between groups.

It looks like I need to tweak the graph in some way to make the density plots show up. Obviously, N is too low to say anything yet, but I need to work on the plot.
Optomotor graph coded
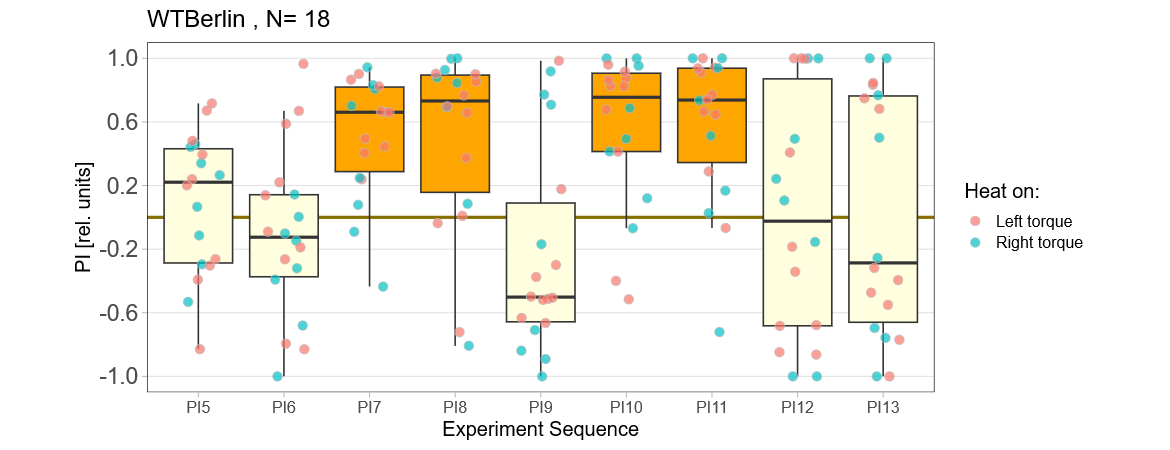
There had been some concerns about the optomotor display in the group evaluation sheets showing right-turning torque on the left side of the graph and vice versa. Also, the use of standard deviations seemed to blur differences between the experimental groups:
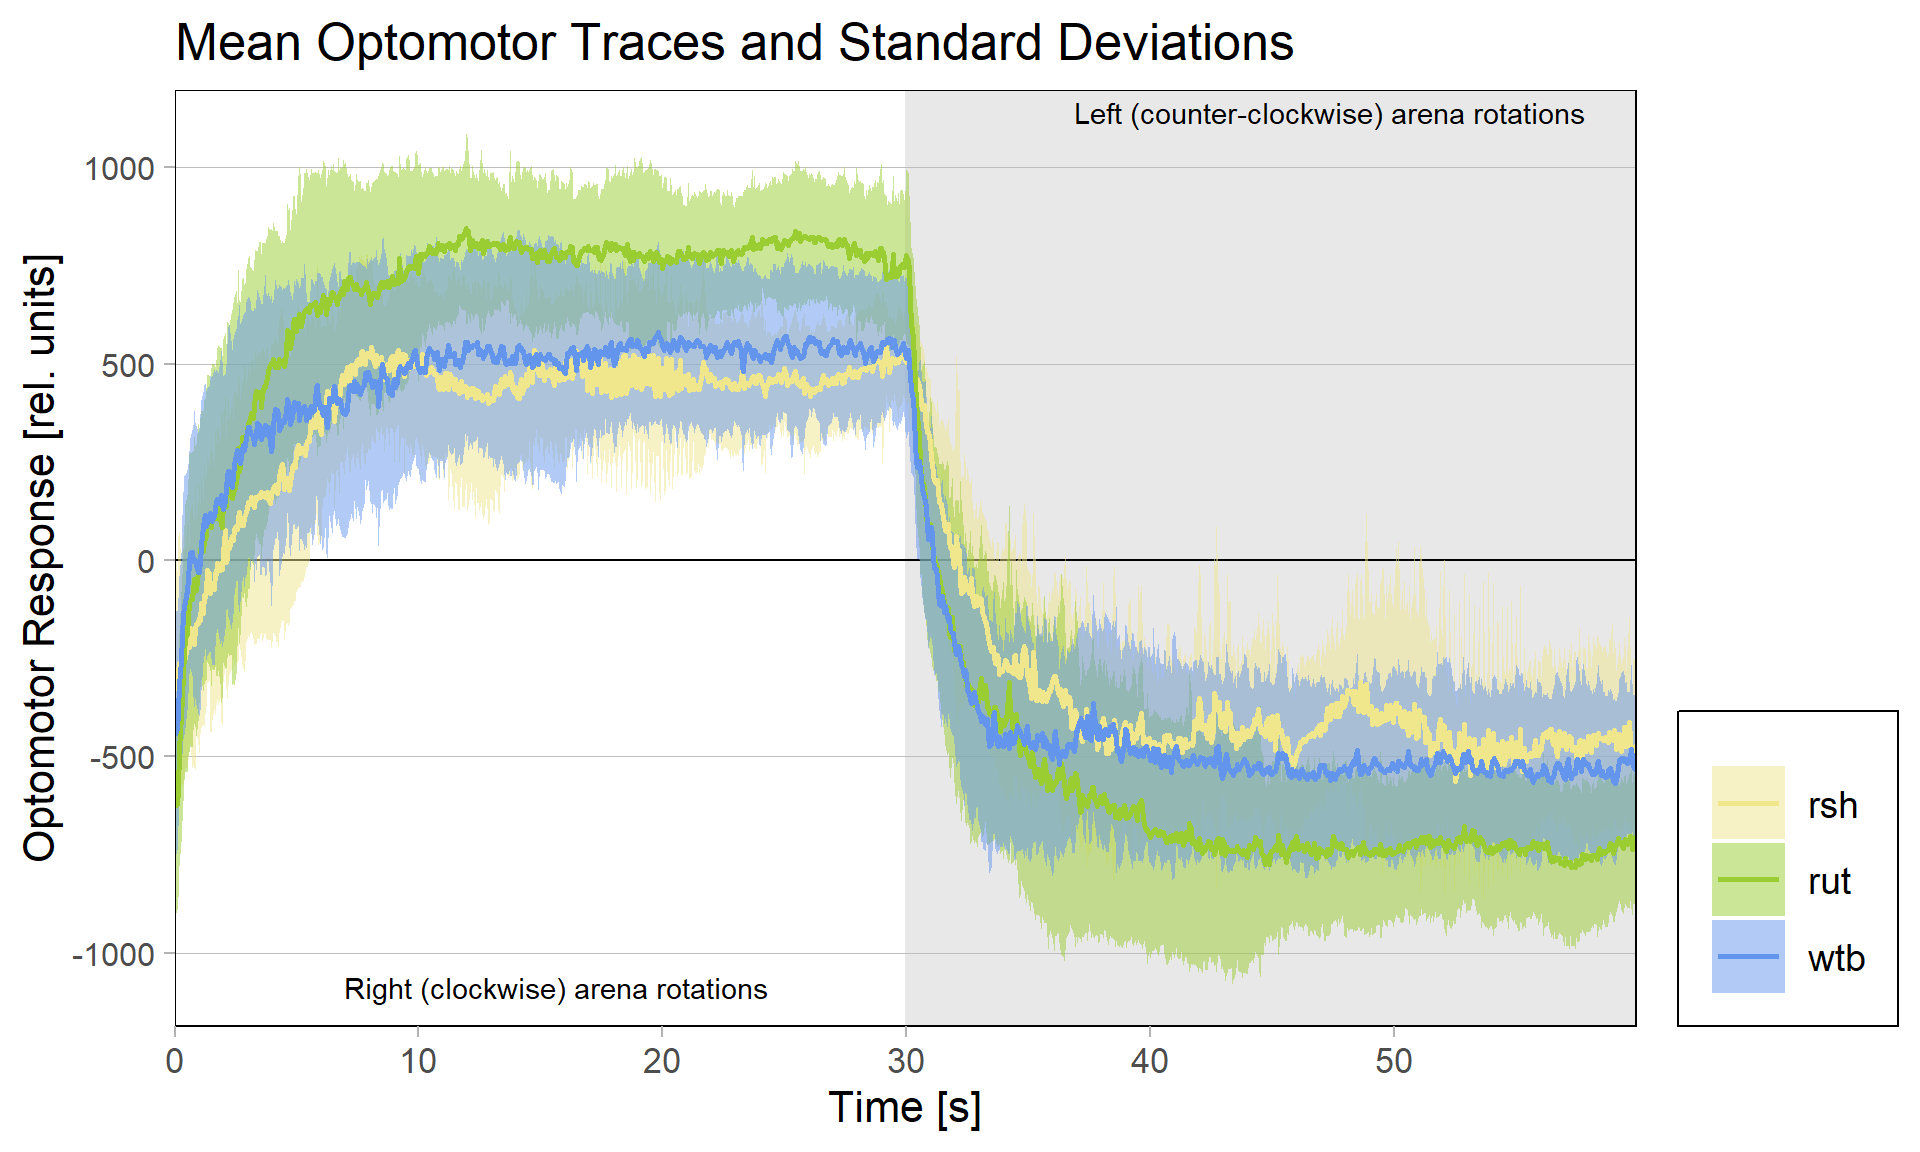
Because of these concerns, I have swapped the traces and used standard error of the means instead of standard deviations:
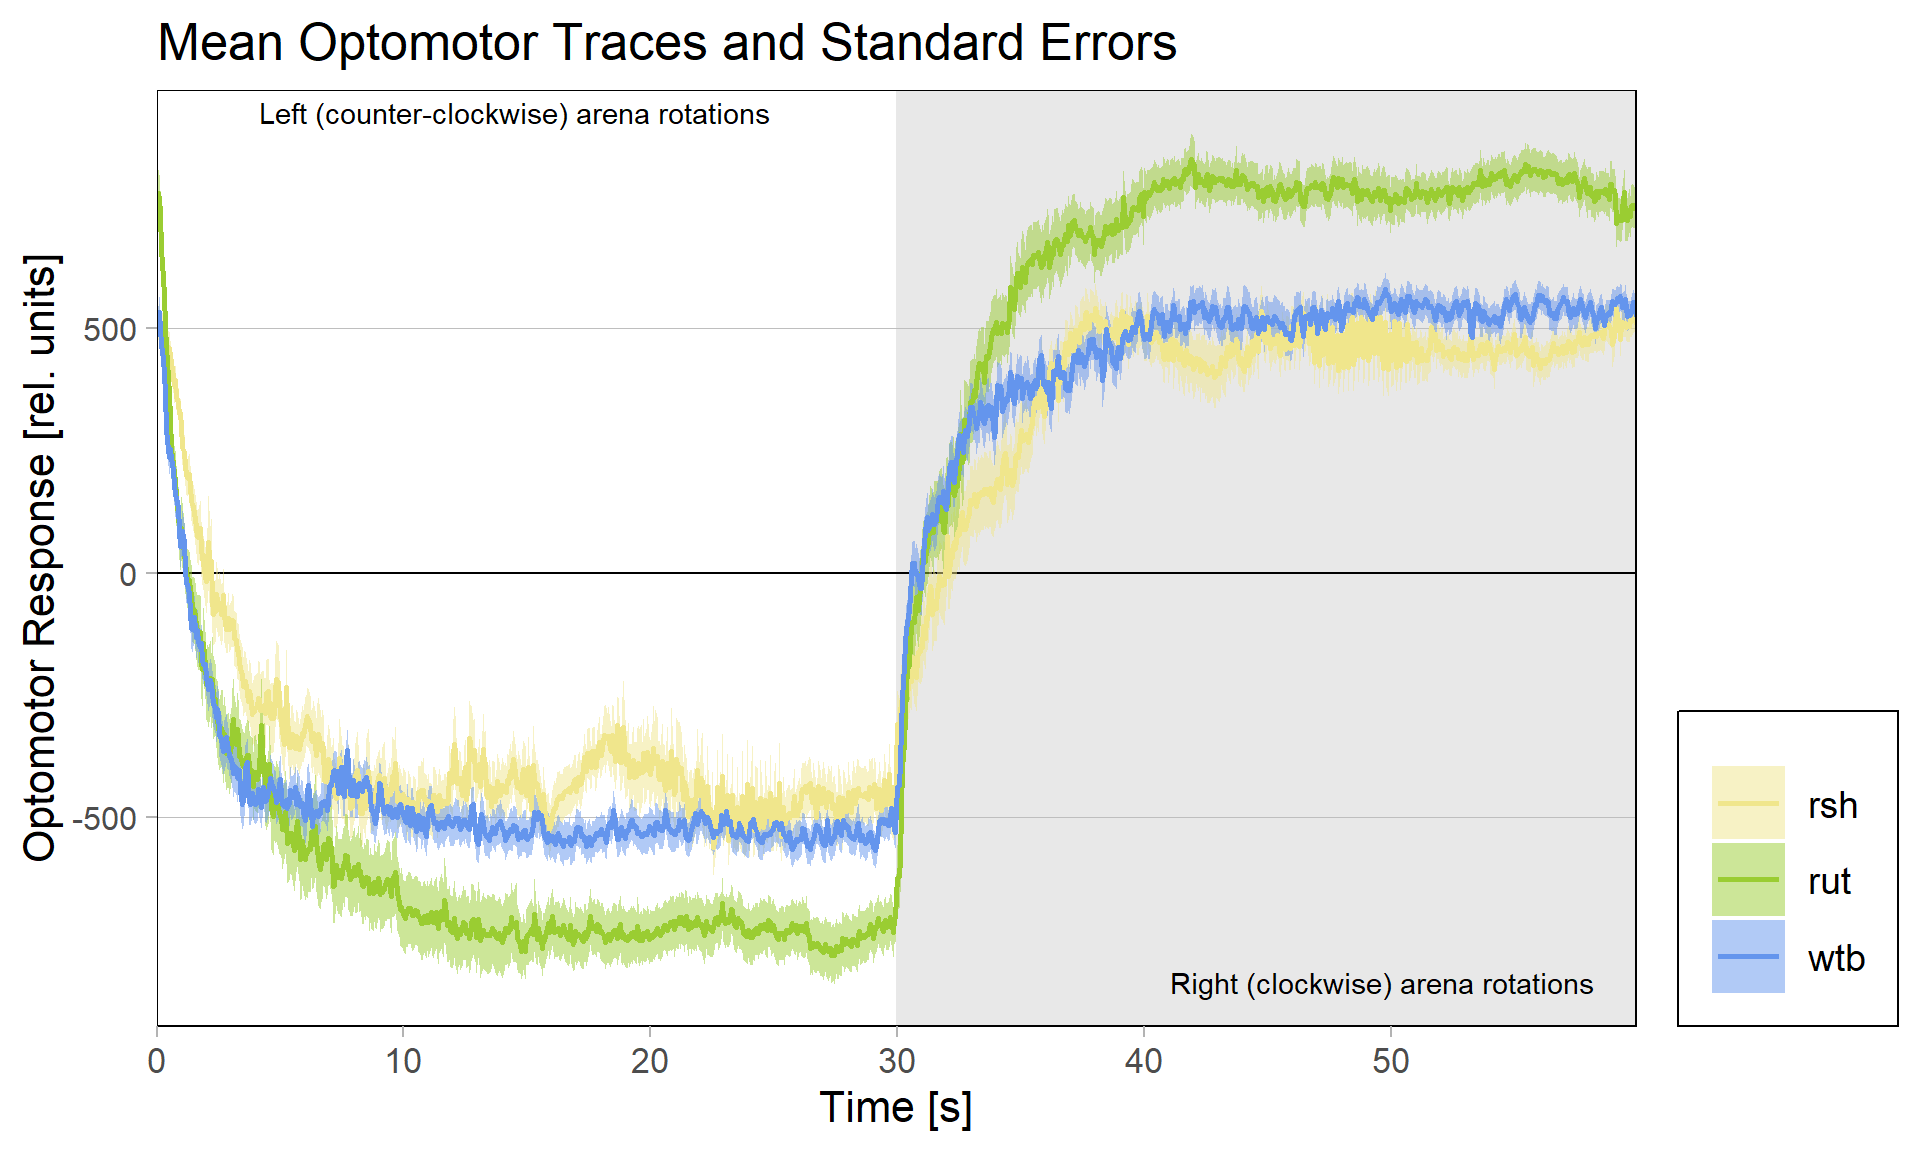
What do you think? Better or worse? Feedback very welcome!
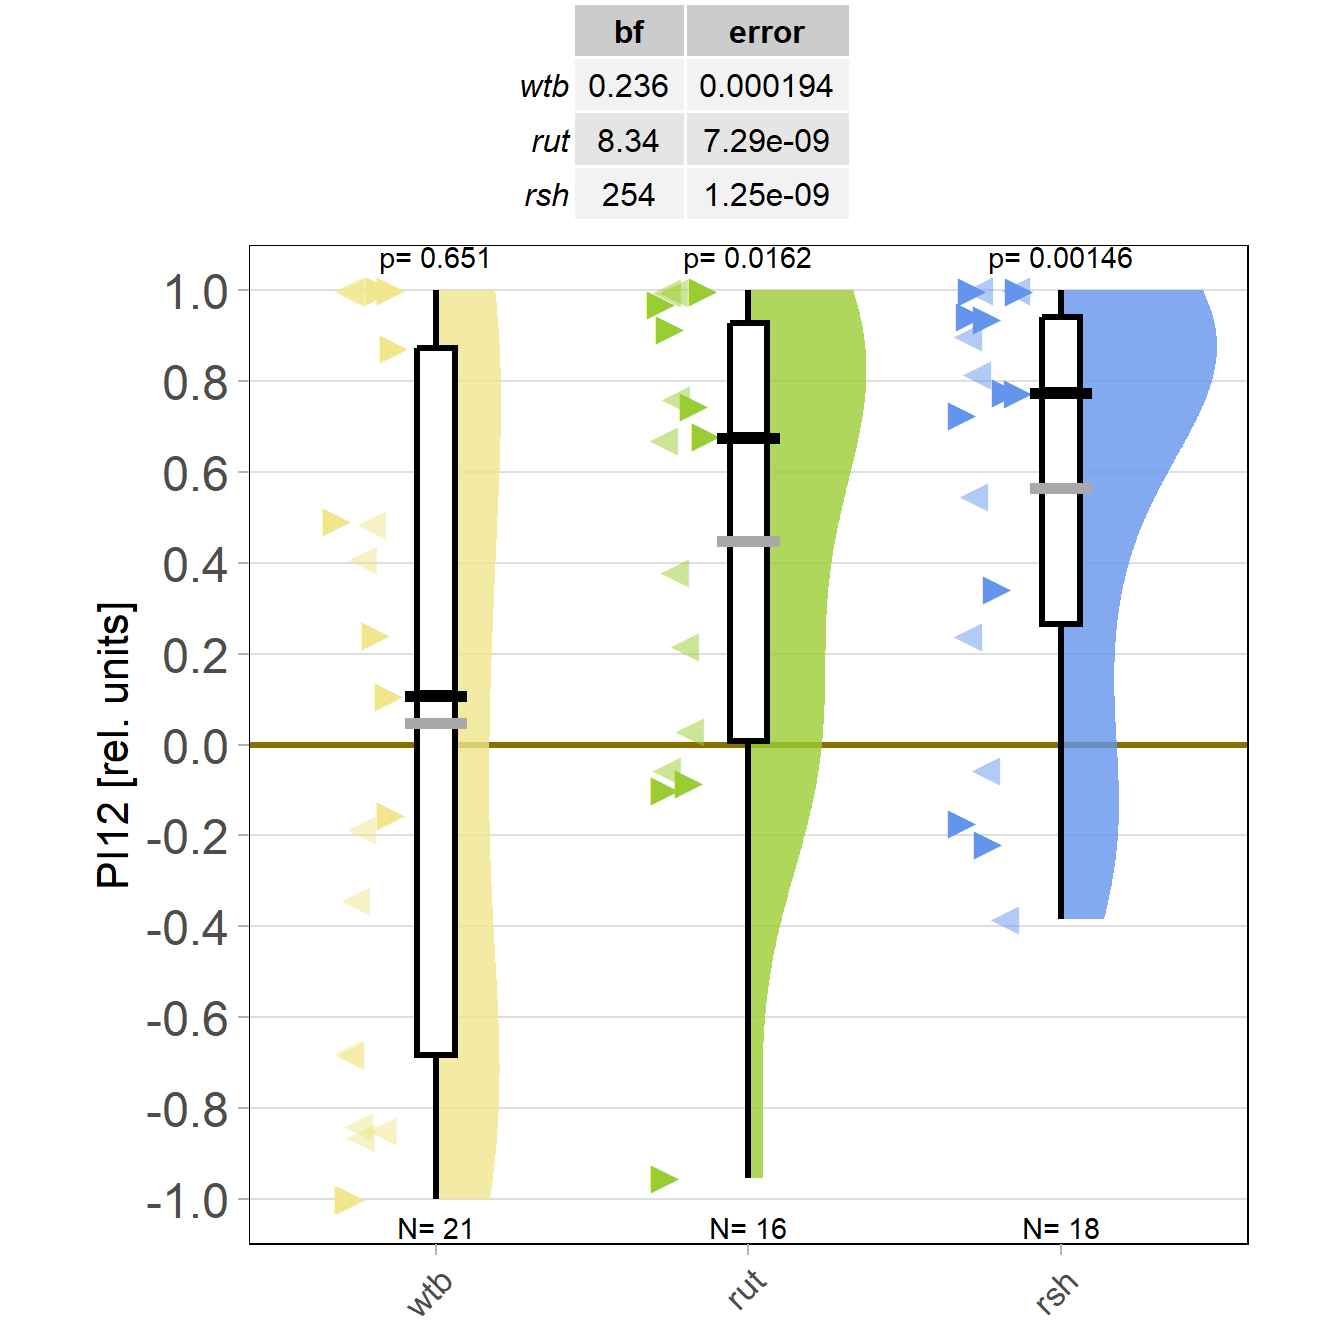
Finally done: rut and rsh flies better at self-learning
At long last, I got all the flies together that we need for sufficient statistical power. As the preliminary data had indicated, WTB flies don’t learn with the short training, while rut and rsh flies do just fine.
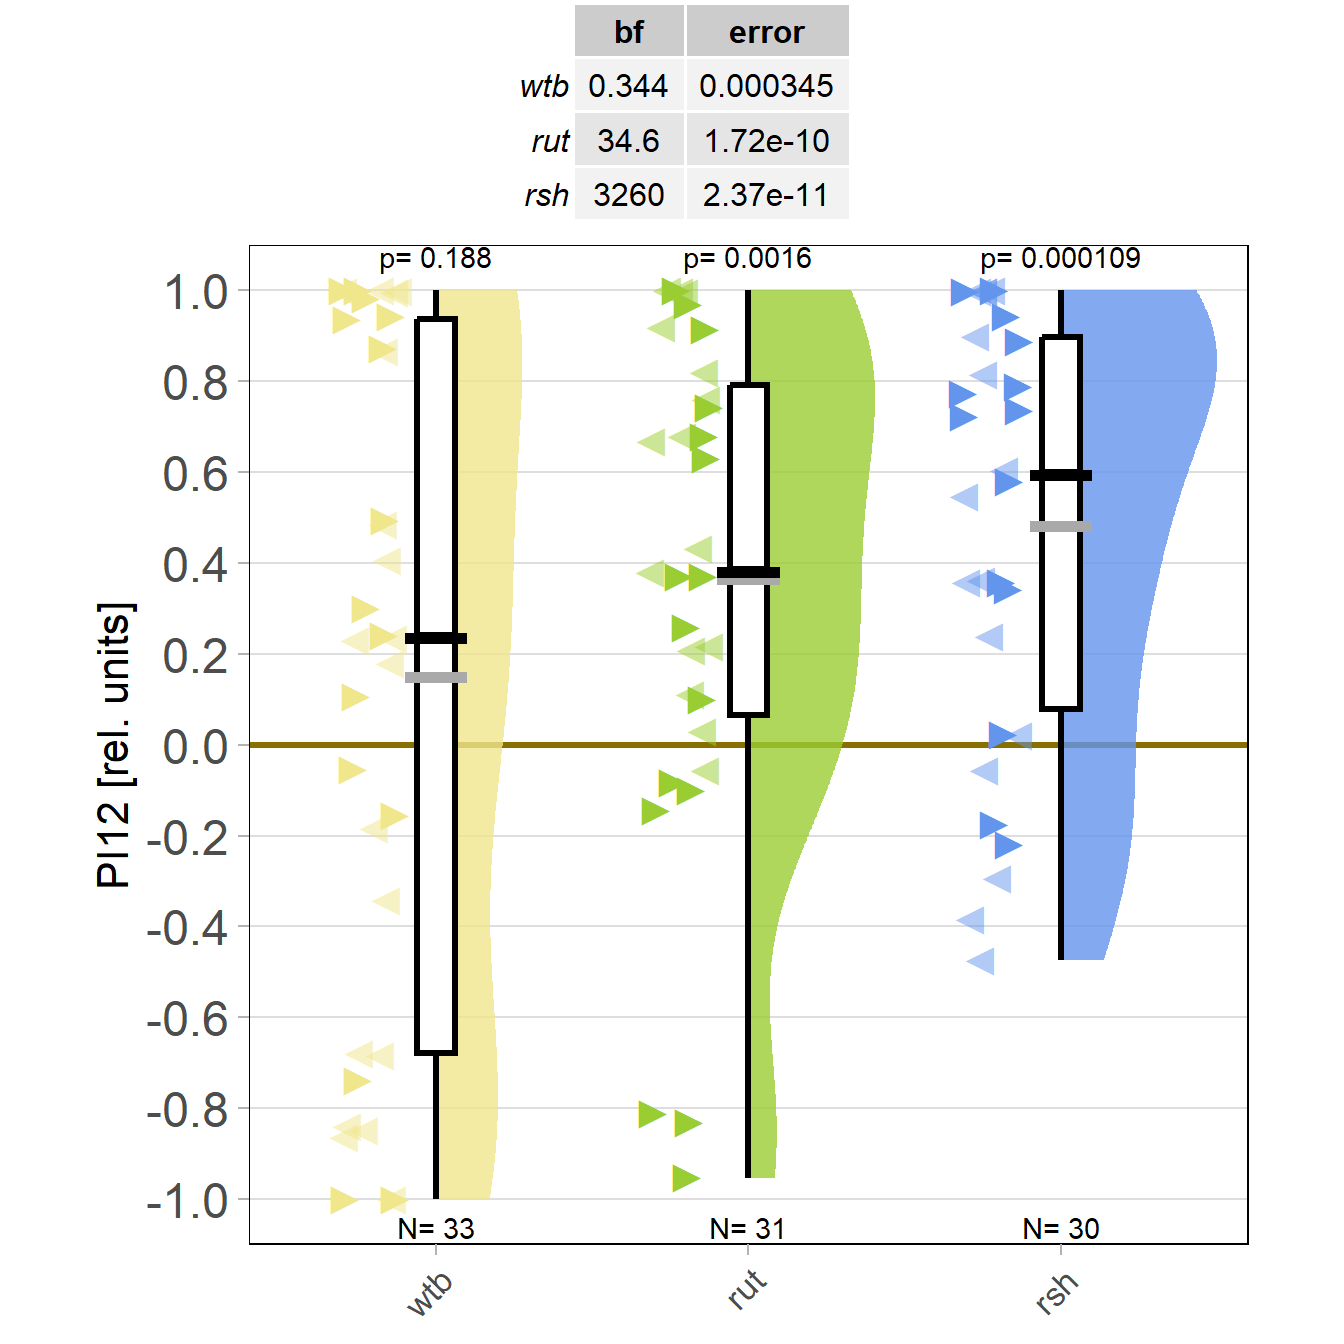
However, this may be due to genetic background effects, so we need to check the CRISPR mutants.
Starting it back up
Last week, the torque mete ran for two days and I managed to record a few radish flies:
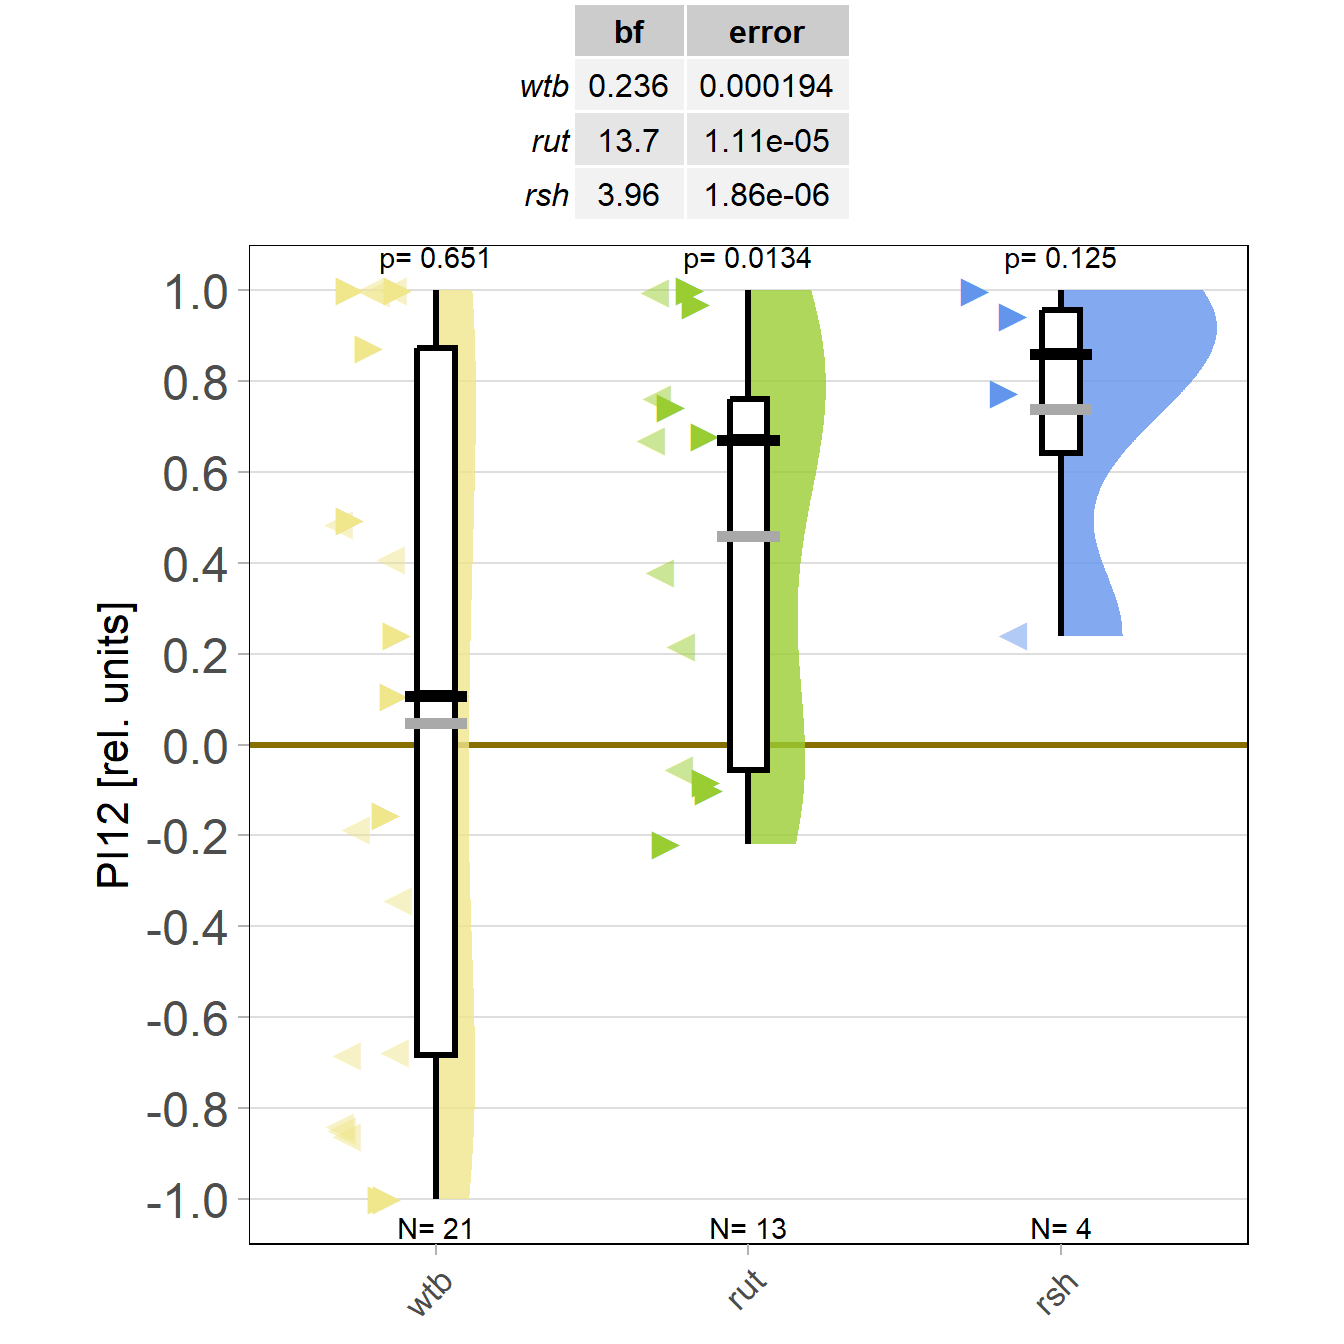
Slowly collecting the mutants
Finally, thanks to Marcella gluing to fly wheels instead of one, the mutant data are starting to roll in on the shortened self-learning experiment:
First mutant data coming in
Short yaw torque learning, i.e., only one minute per period. Orange: training, yellow: test. WTB: wild type Berlin, rut: rutabaga learning mutants. With this short training of only 4 minutes, wild type flies show no torque preference in the after training, while at least the first few rutabaga flies show such a preference:
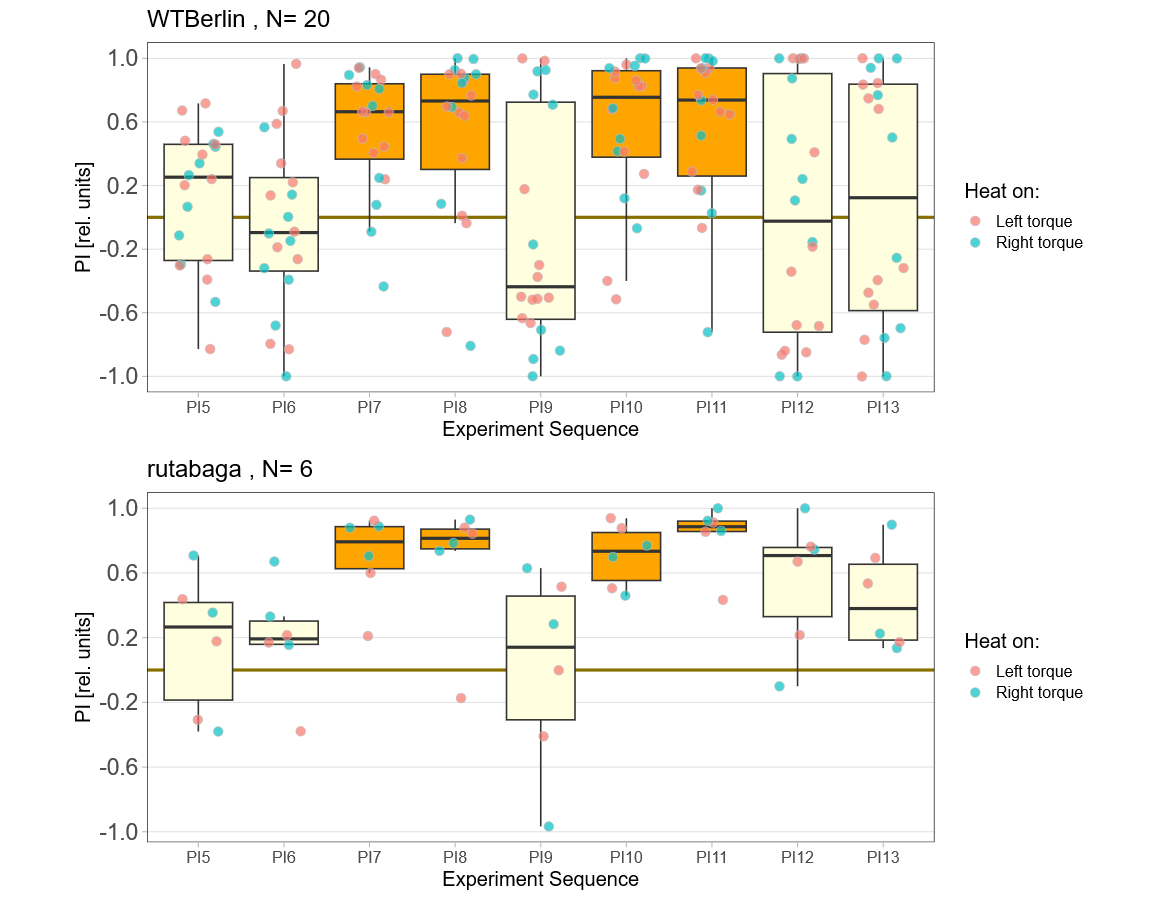
So far, I only could get one radish fly to make it through the experiment, so I cannot display it here.
Four minutes not enough
Eight minutes of yaw torque training work just fine for both wild type and mutant flies:
Reducing the training to four minutes is not enough for wild type flies:
Now it will be exciting to see if the mutants still do what they did many years ago: learn better than wild type.
Coded the regression analysis
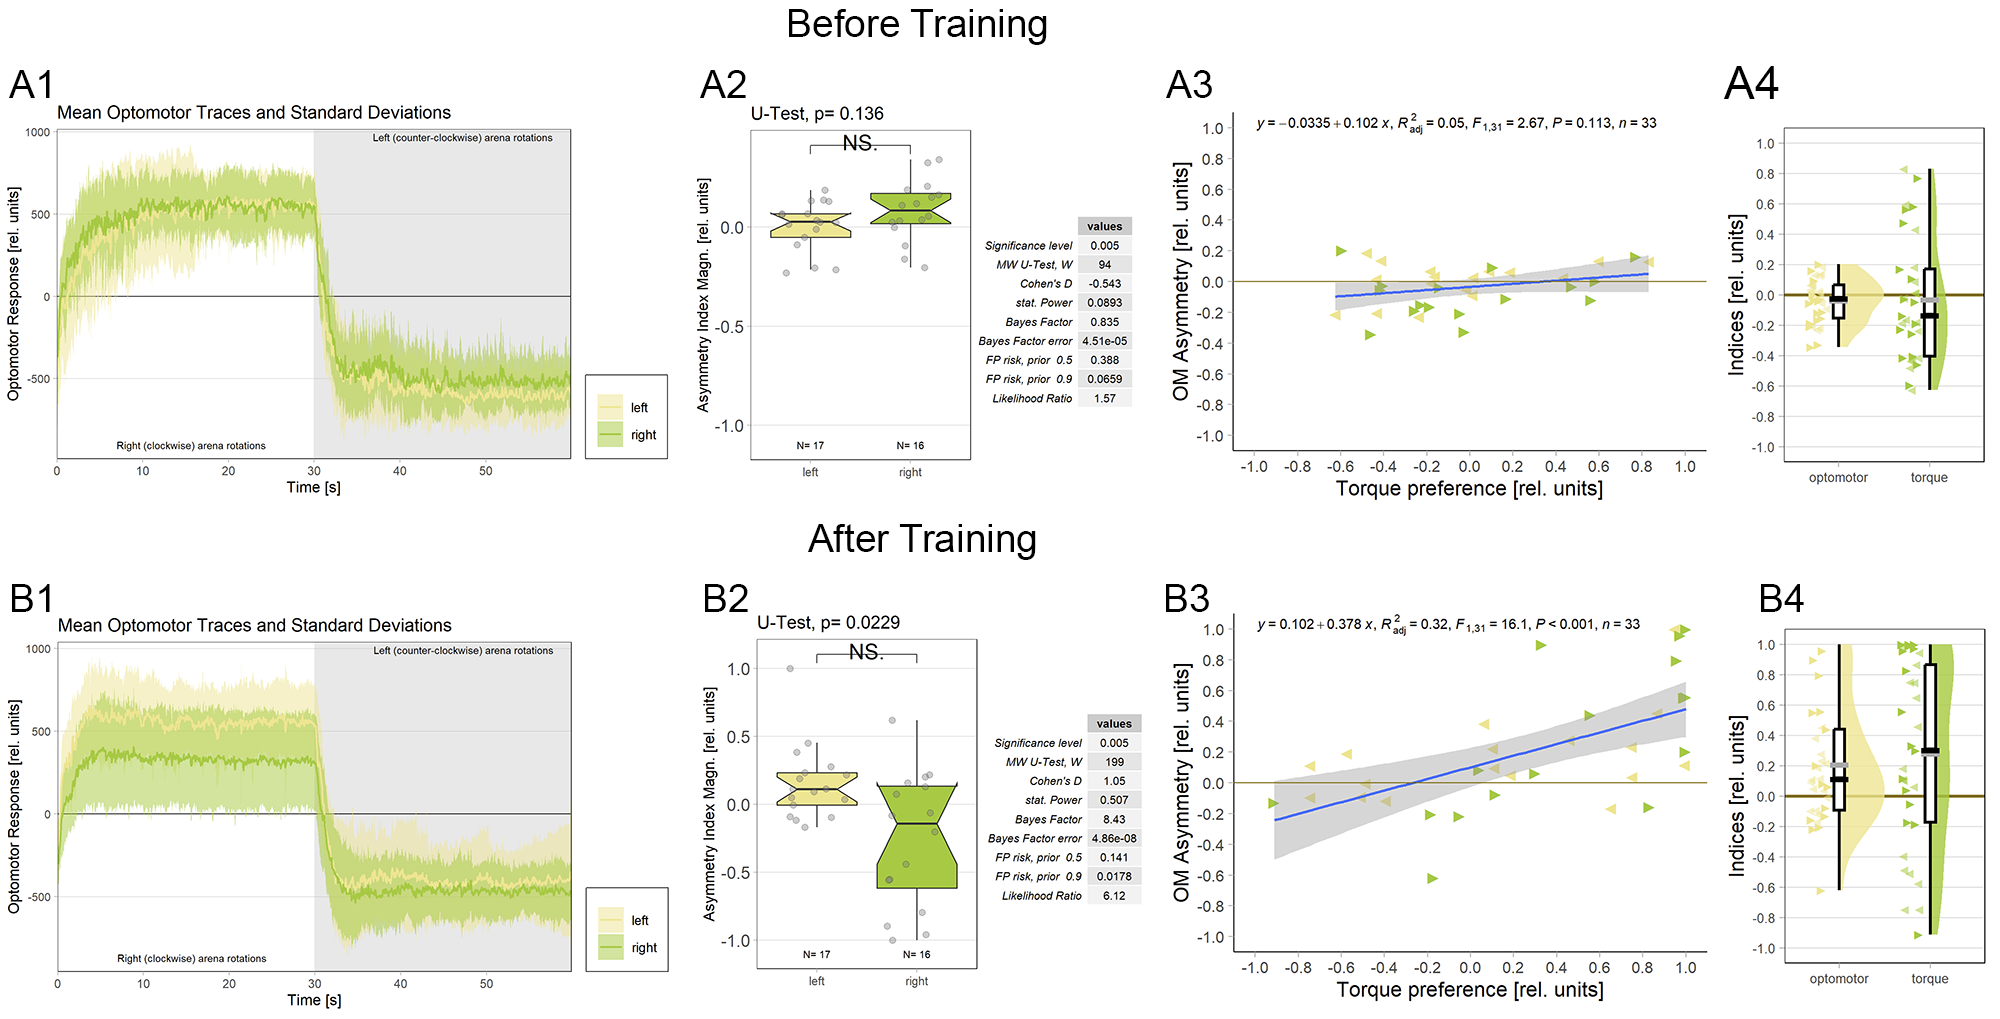
I now switched the sign of the Optomotor Asymmetry Index in flies that were punished on producing right-turning torque, such that weaker punished torque shows up as a positive index. After that was done, I plotted the correlation between the optomotor index and the preference index:
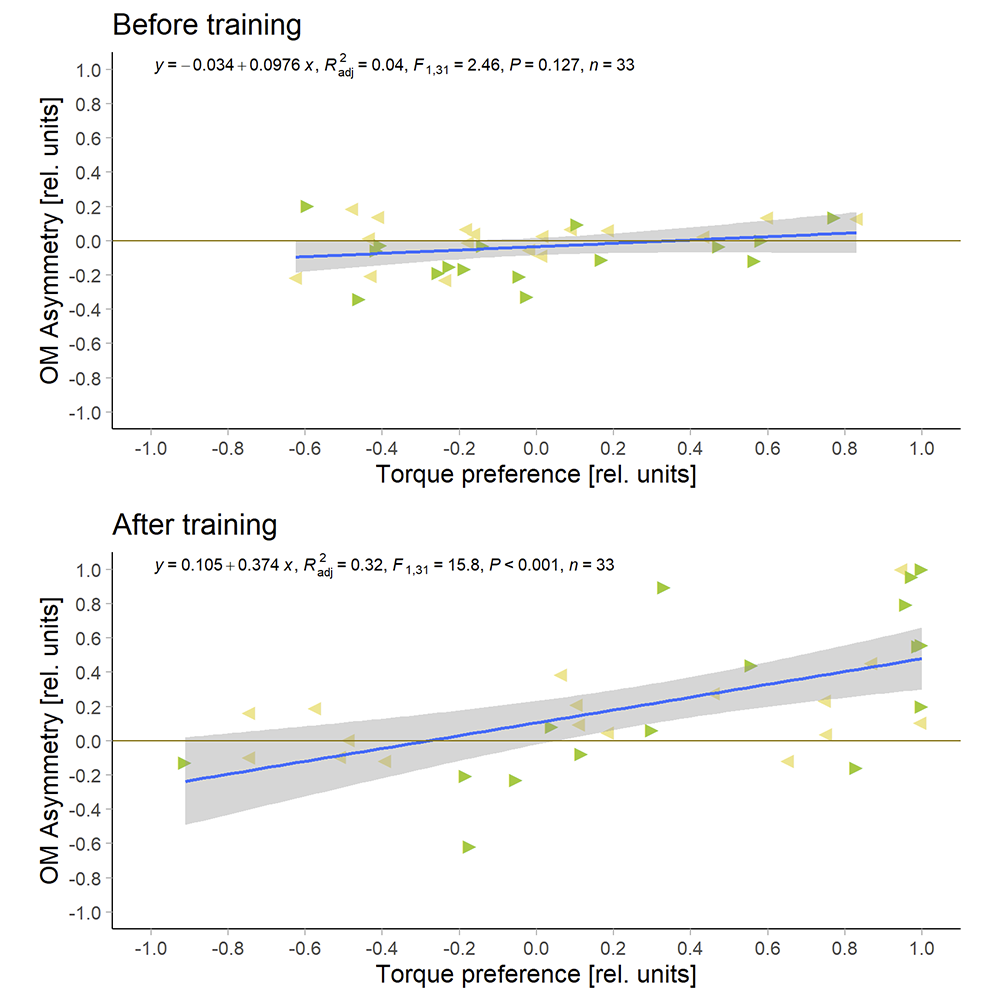
I had to get rid of eight flies where the optomotor response was already asymmetric before the training started, so now I only have 33 flies. But with these flies, there is no correlation before training and a very significant correlation after training.
Any suggestions about appearance of the graphs?
Would it be useful to plot optomotor and performance indices as raincloudplots next to the regressions?
This would be the complete figure: