Started testing for knock-down
After just three days of experiments and lees than ten flies in each group, these results don’t really mean anything, yet, other than that data collection hast started:

Strange results after pooling data
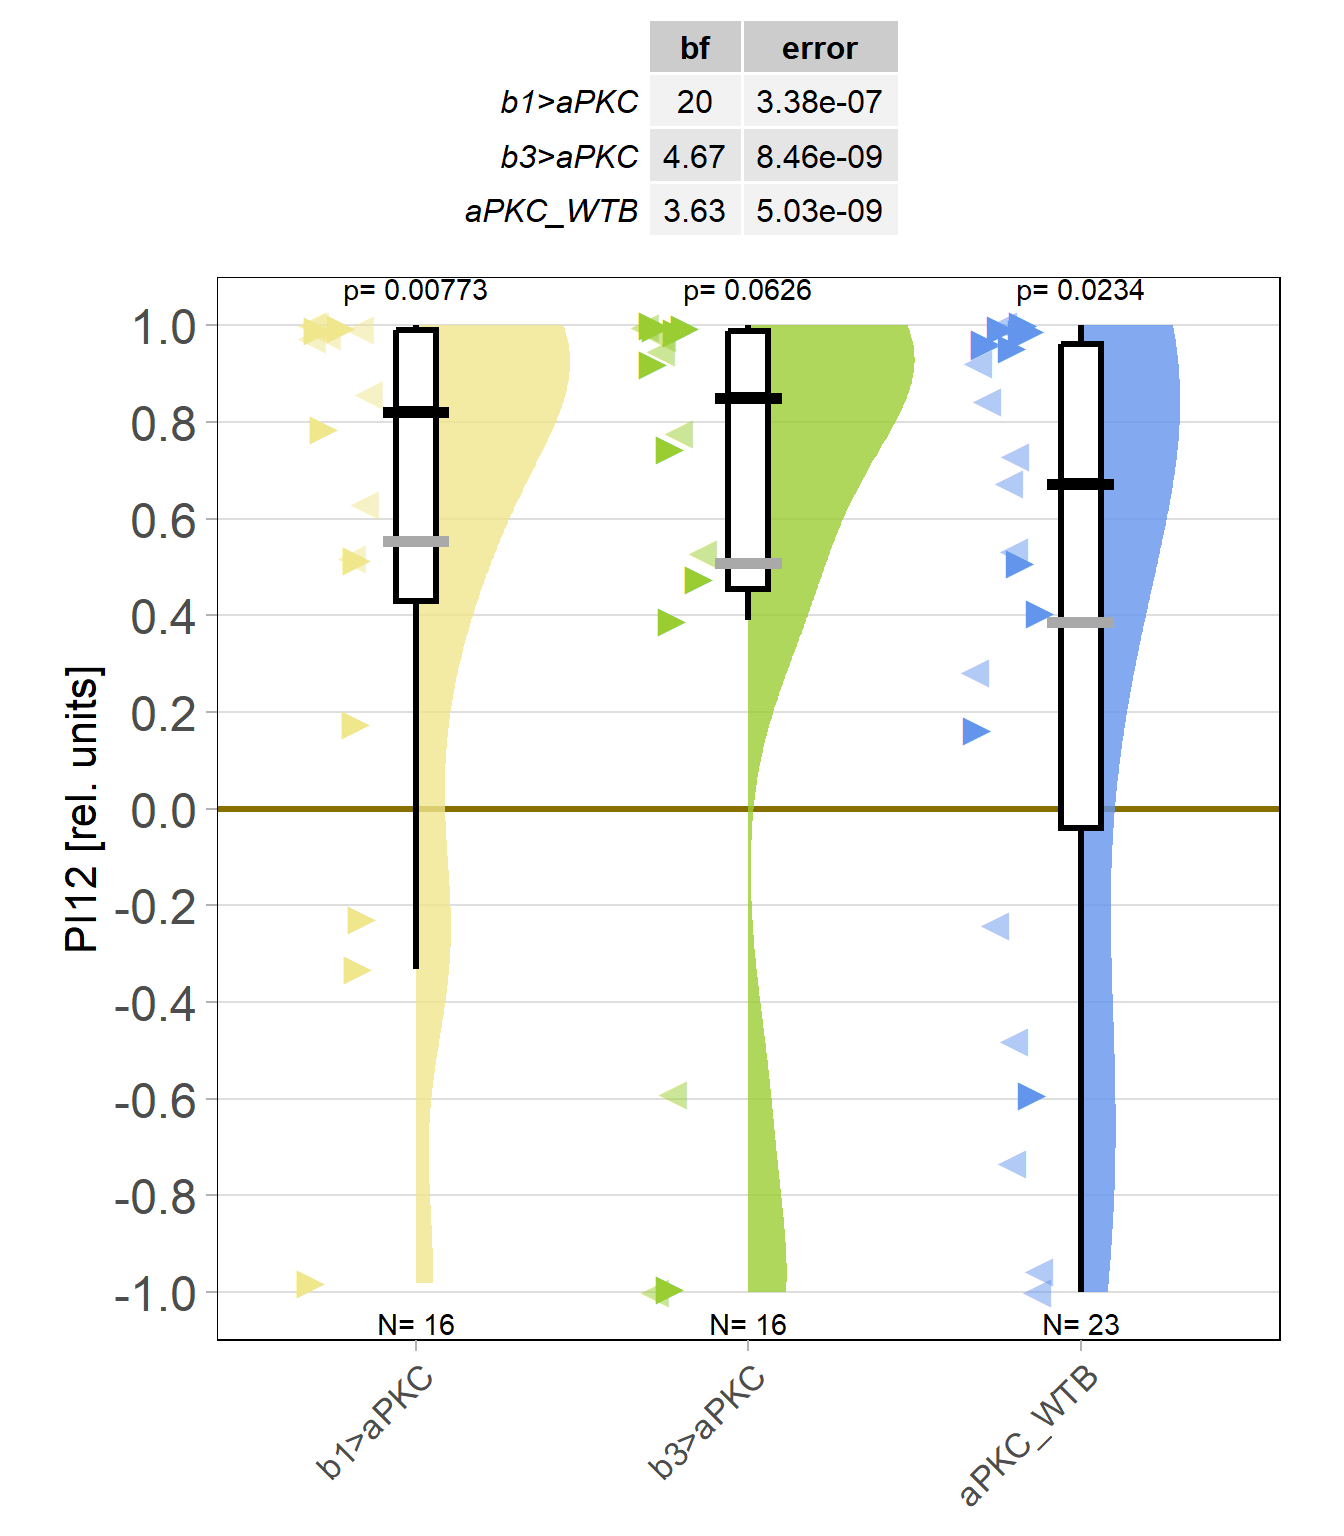
Because the effect of yaw torque training on optomotor responses (OMRs) is still very small for now (we work on improving that), I pooled the two groups in which aPKC was knocked out in either motor neuron (MN) b1 or MN b3, as both these two groups and their WTB x aPKC/Cas9 controls seem to learn just fine (torque preference text after 8 minutes of training):

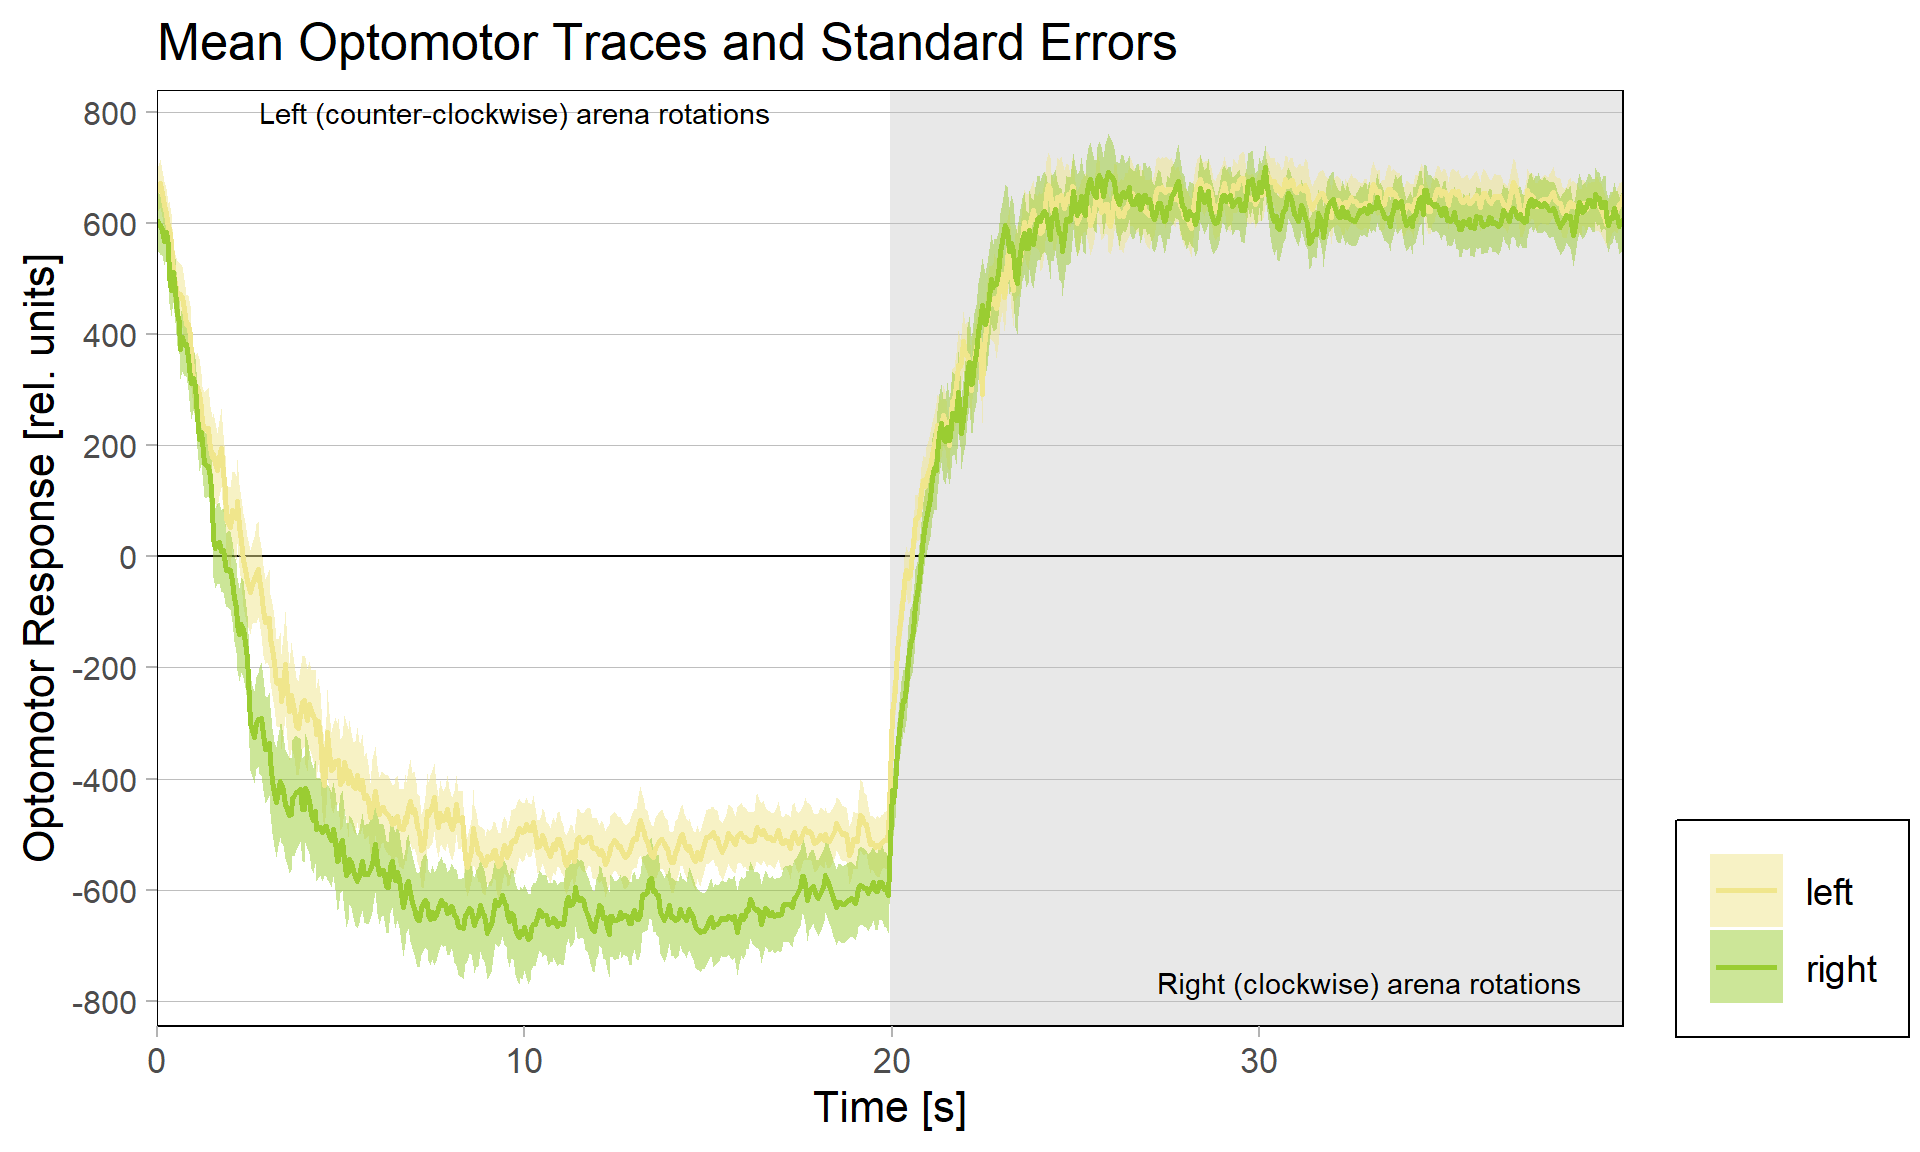
Obviously, we still need to check the Gal4 driver lines are really targeting the right neurons, but assuming they are ok, it seems like neither an aPKC knock-out in b1 alone nor in b3 alone is sufficient to affect operant self-learning. Maybe this is due to b1 and b3 acting as an agonist/antagonist pair and if one of them fails to show plasticity, the other is sufficient on its own? Another explanation could be that the torque preference depicted above is mediated by other neurons than b1 or b3 and that the OMR modulation is gone in these flies. Because the OMR effect is so small, I pooled the two groups, threw out all flies that didn’t have at least an acceptable OMR and halfway accurate OMR parameter estimation and plotted the OMR traces of the remaining 35 flies after training:
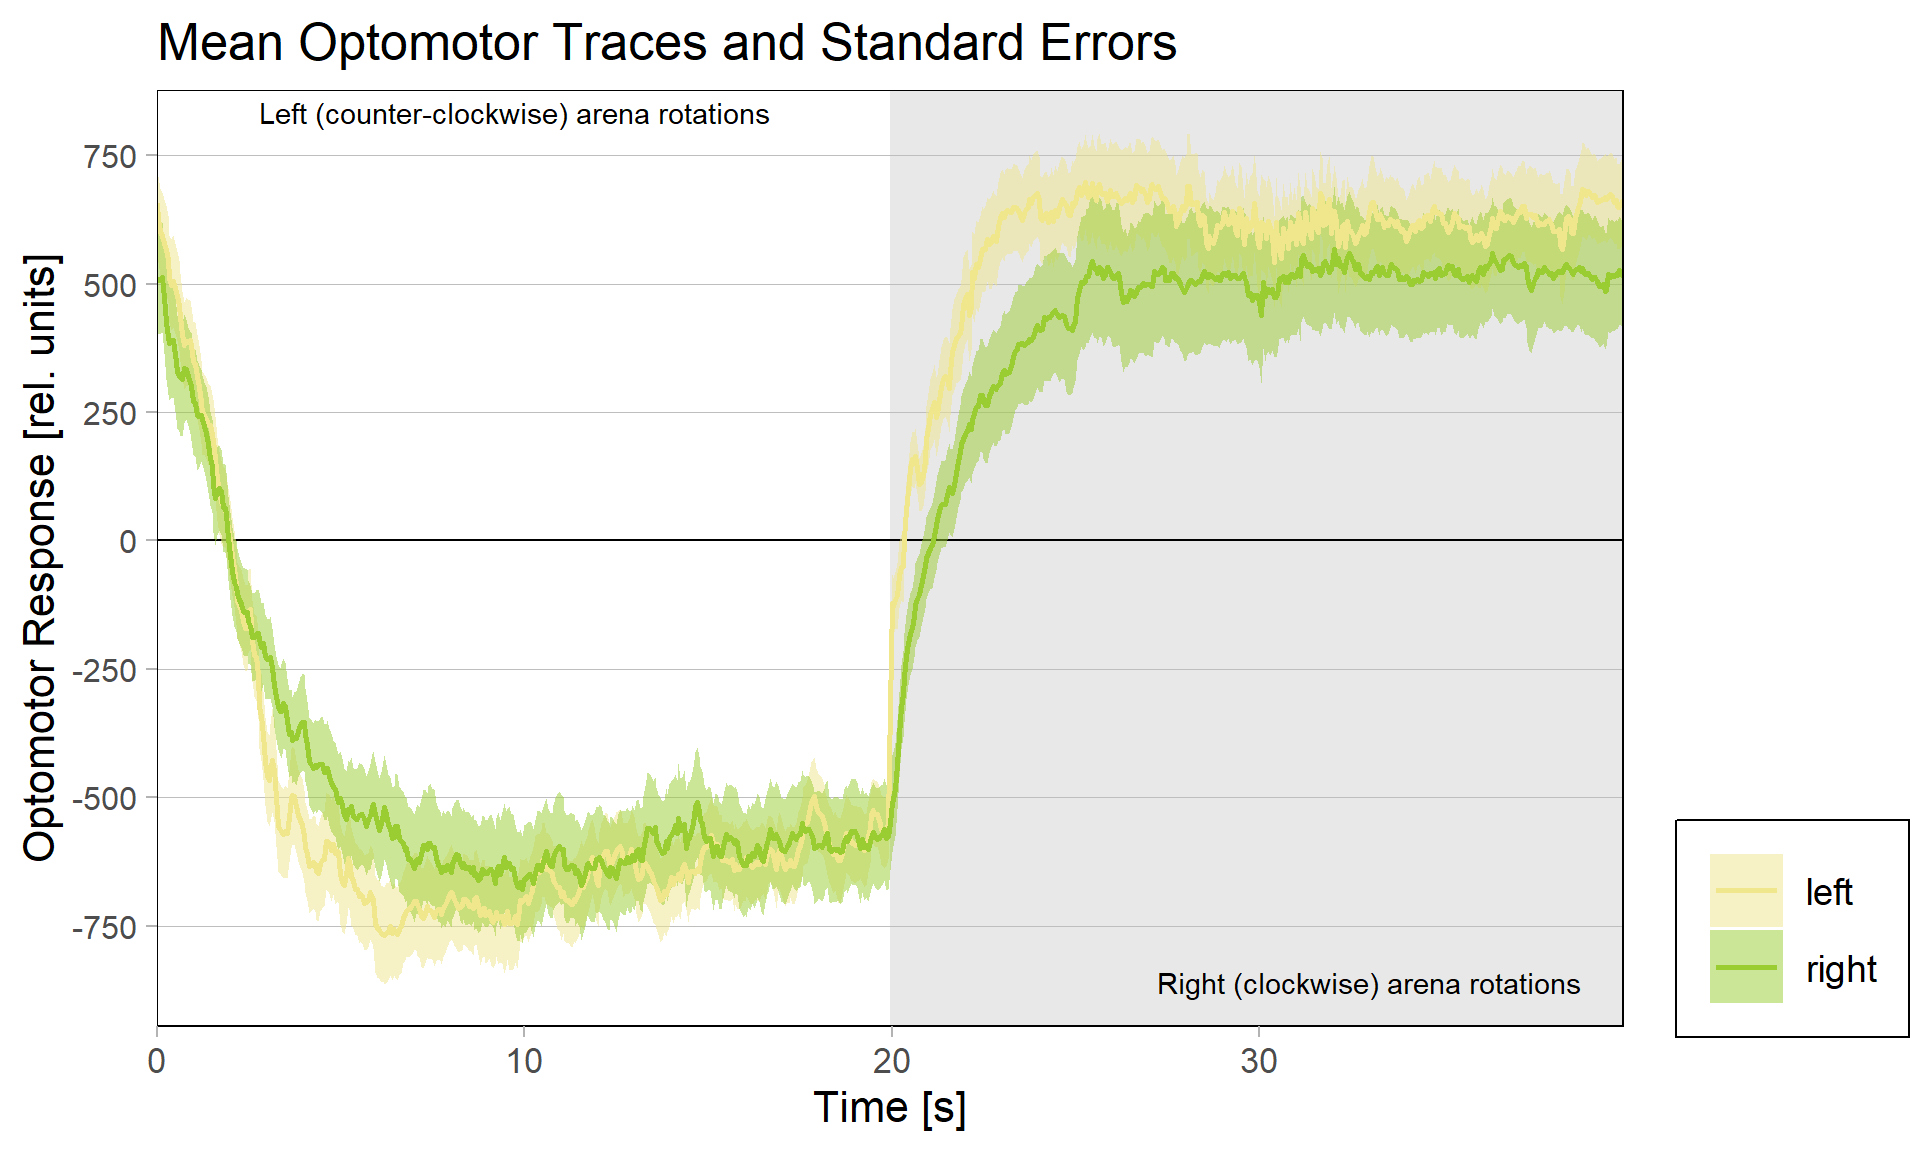
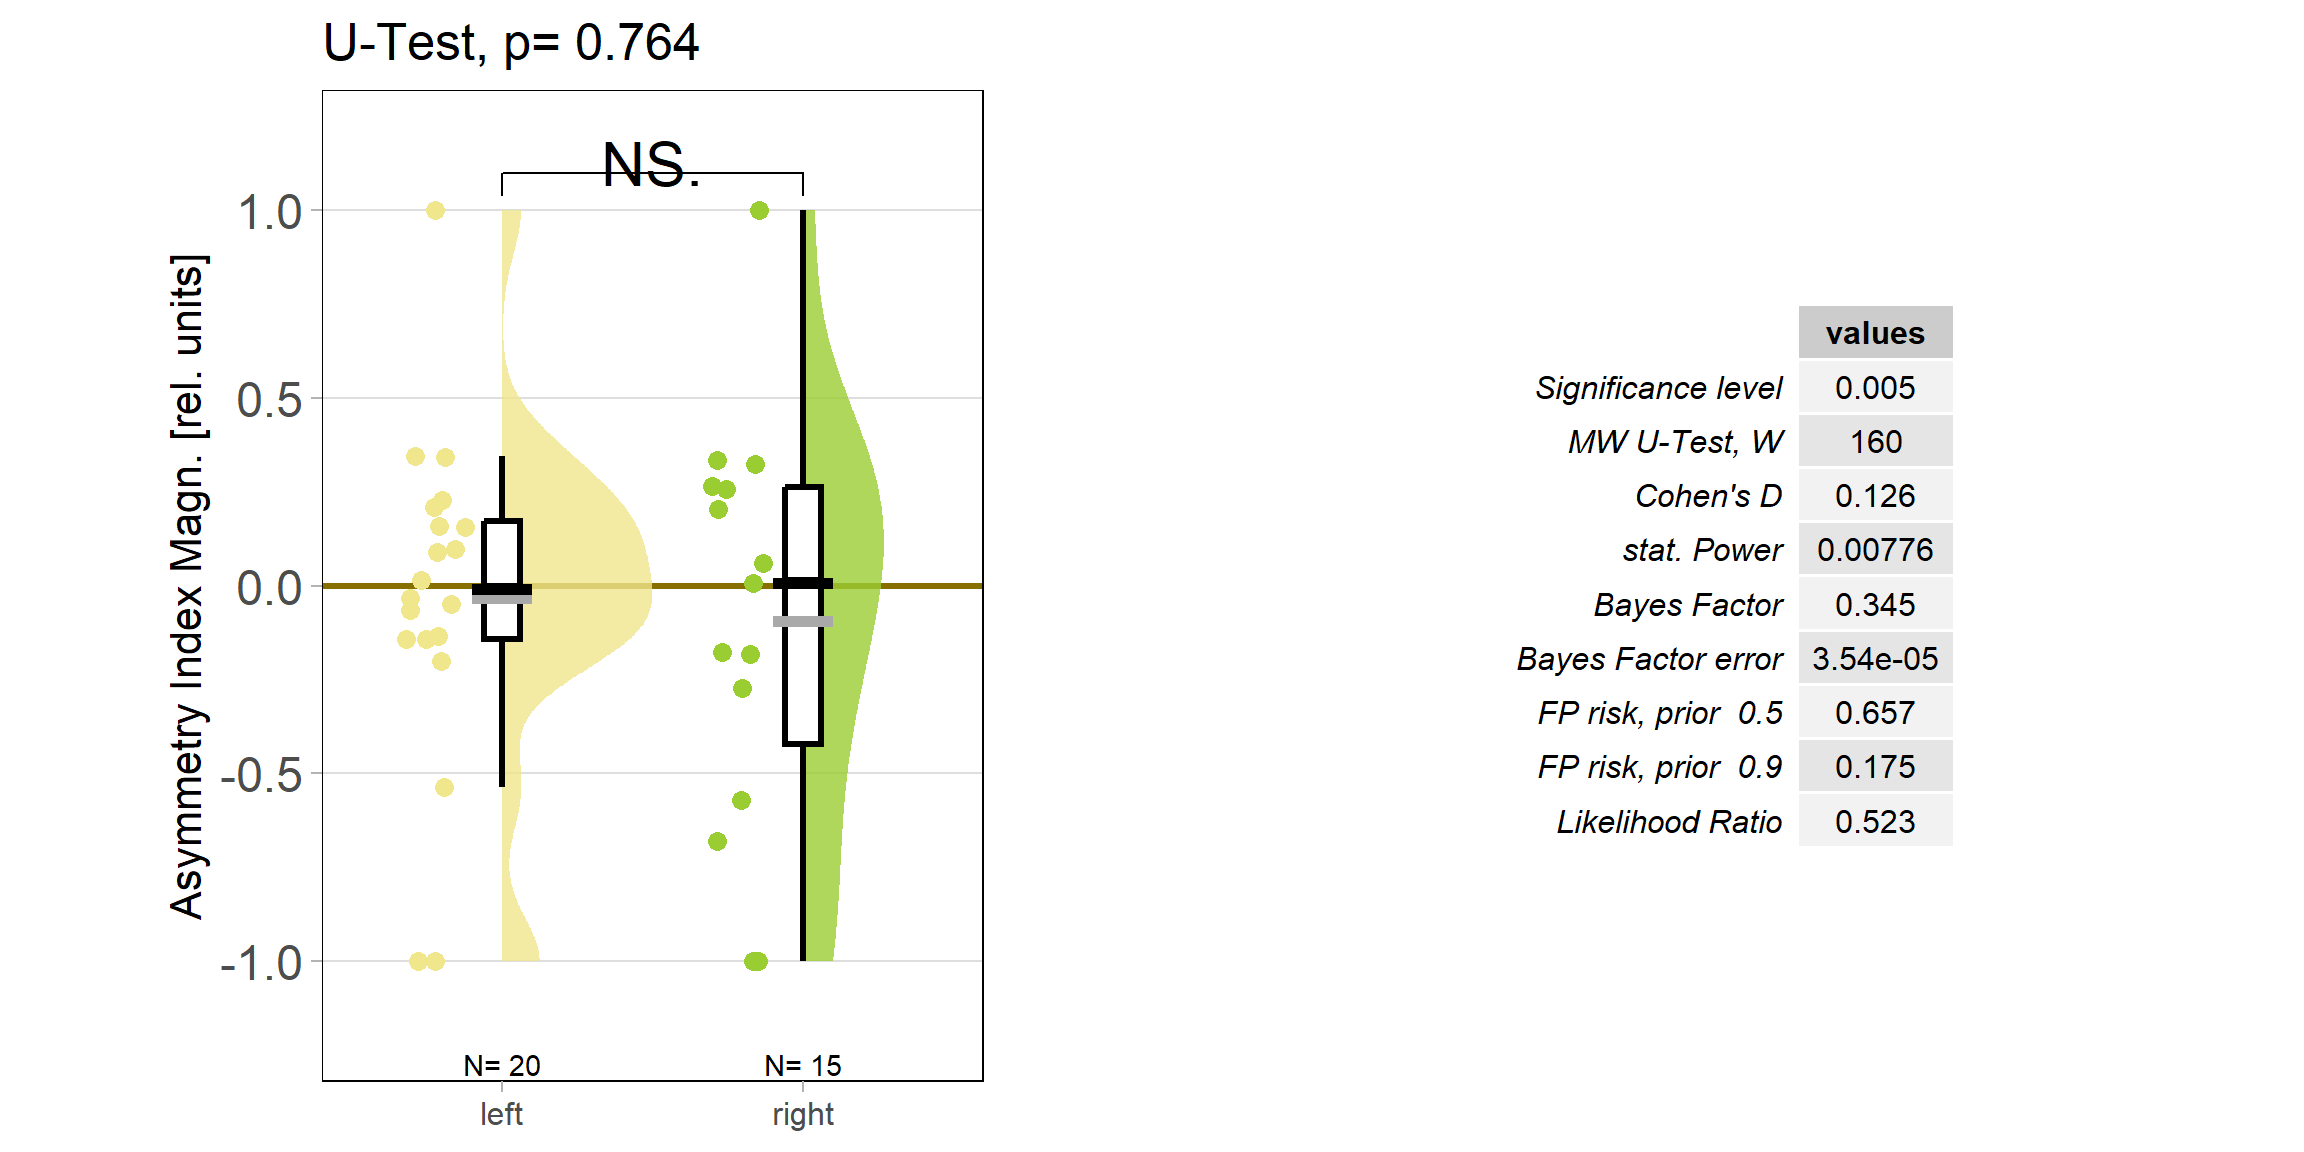
So despite these flies learning well, the OMR does not seem modulated as one can see in WT flies. However, there my be a slight effect for the fly punished on right turning torque, perhaps? However, this group also has much larger errors, which I would need to check the reason for. The quantification of the OM symmetry does not show any hint of an effect, though:
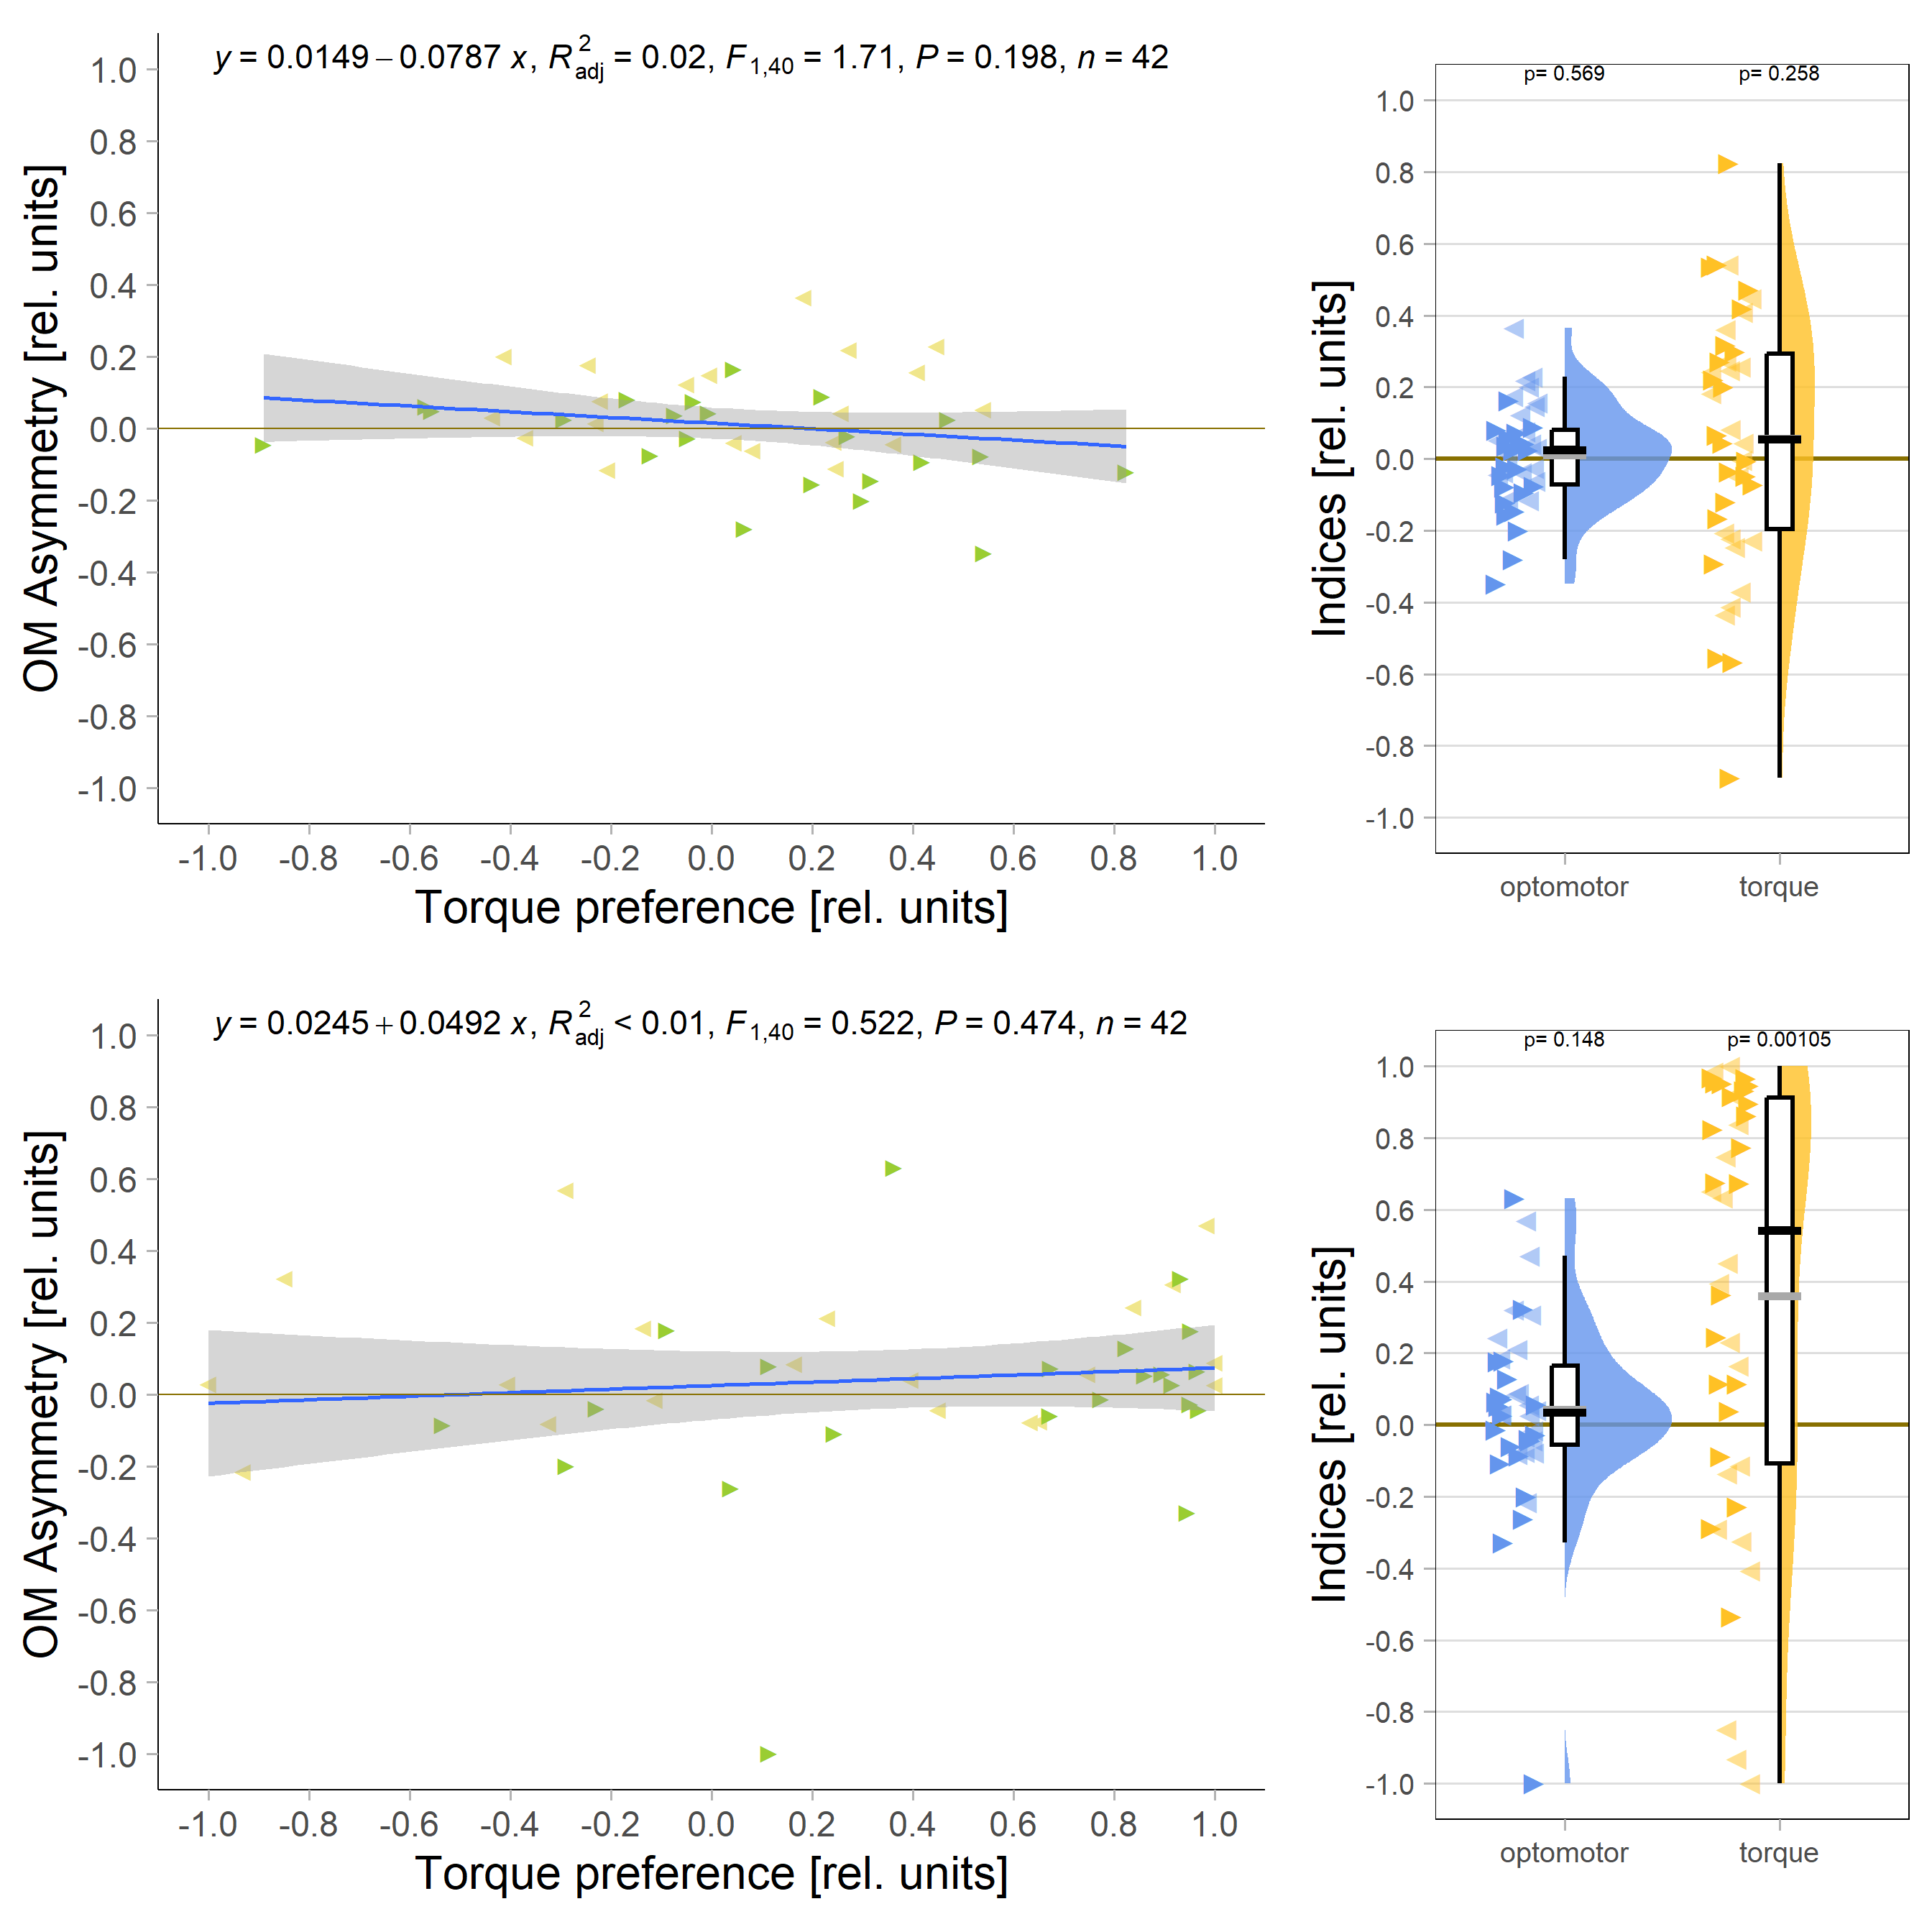
Below the total evaluation before and after training. What is weird is that despite there being no effect after training, the correlation between torque preference and OMR asymmetry seems to be there – or is it just the three outliers?
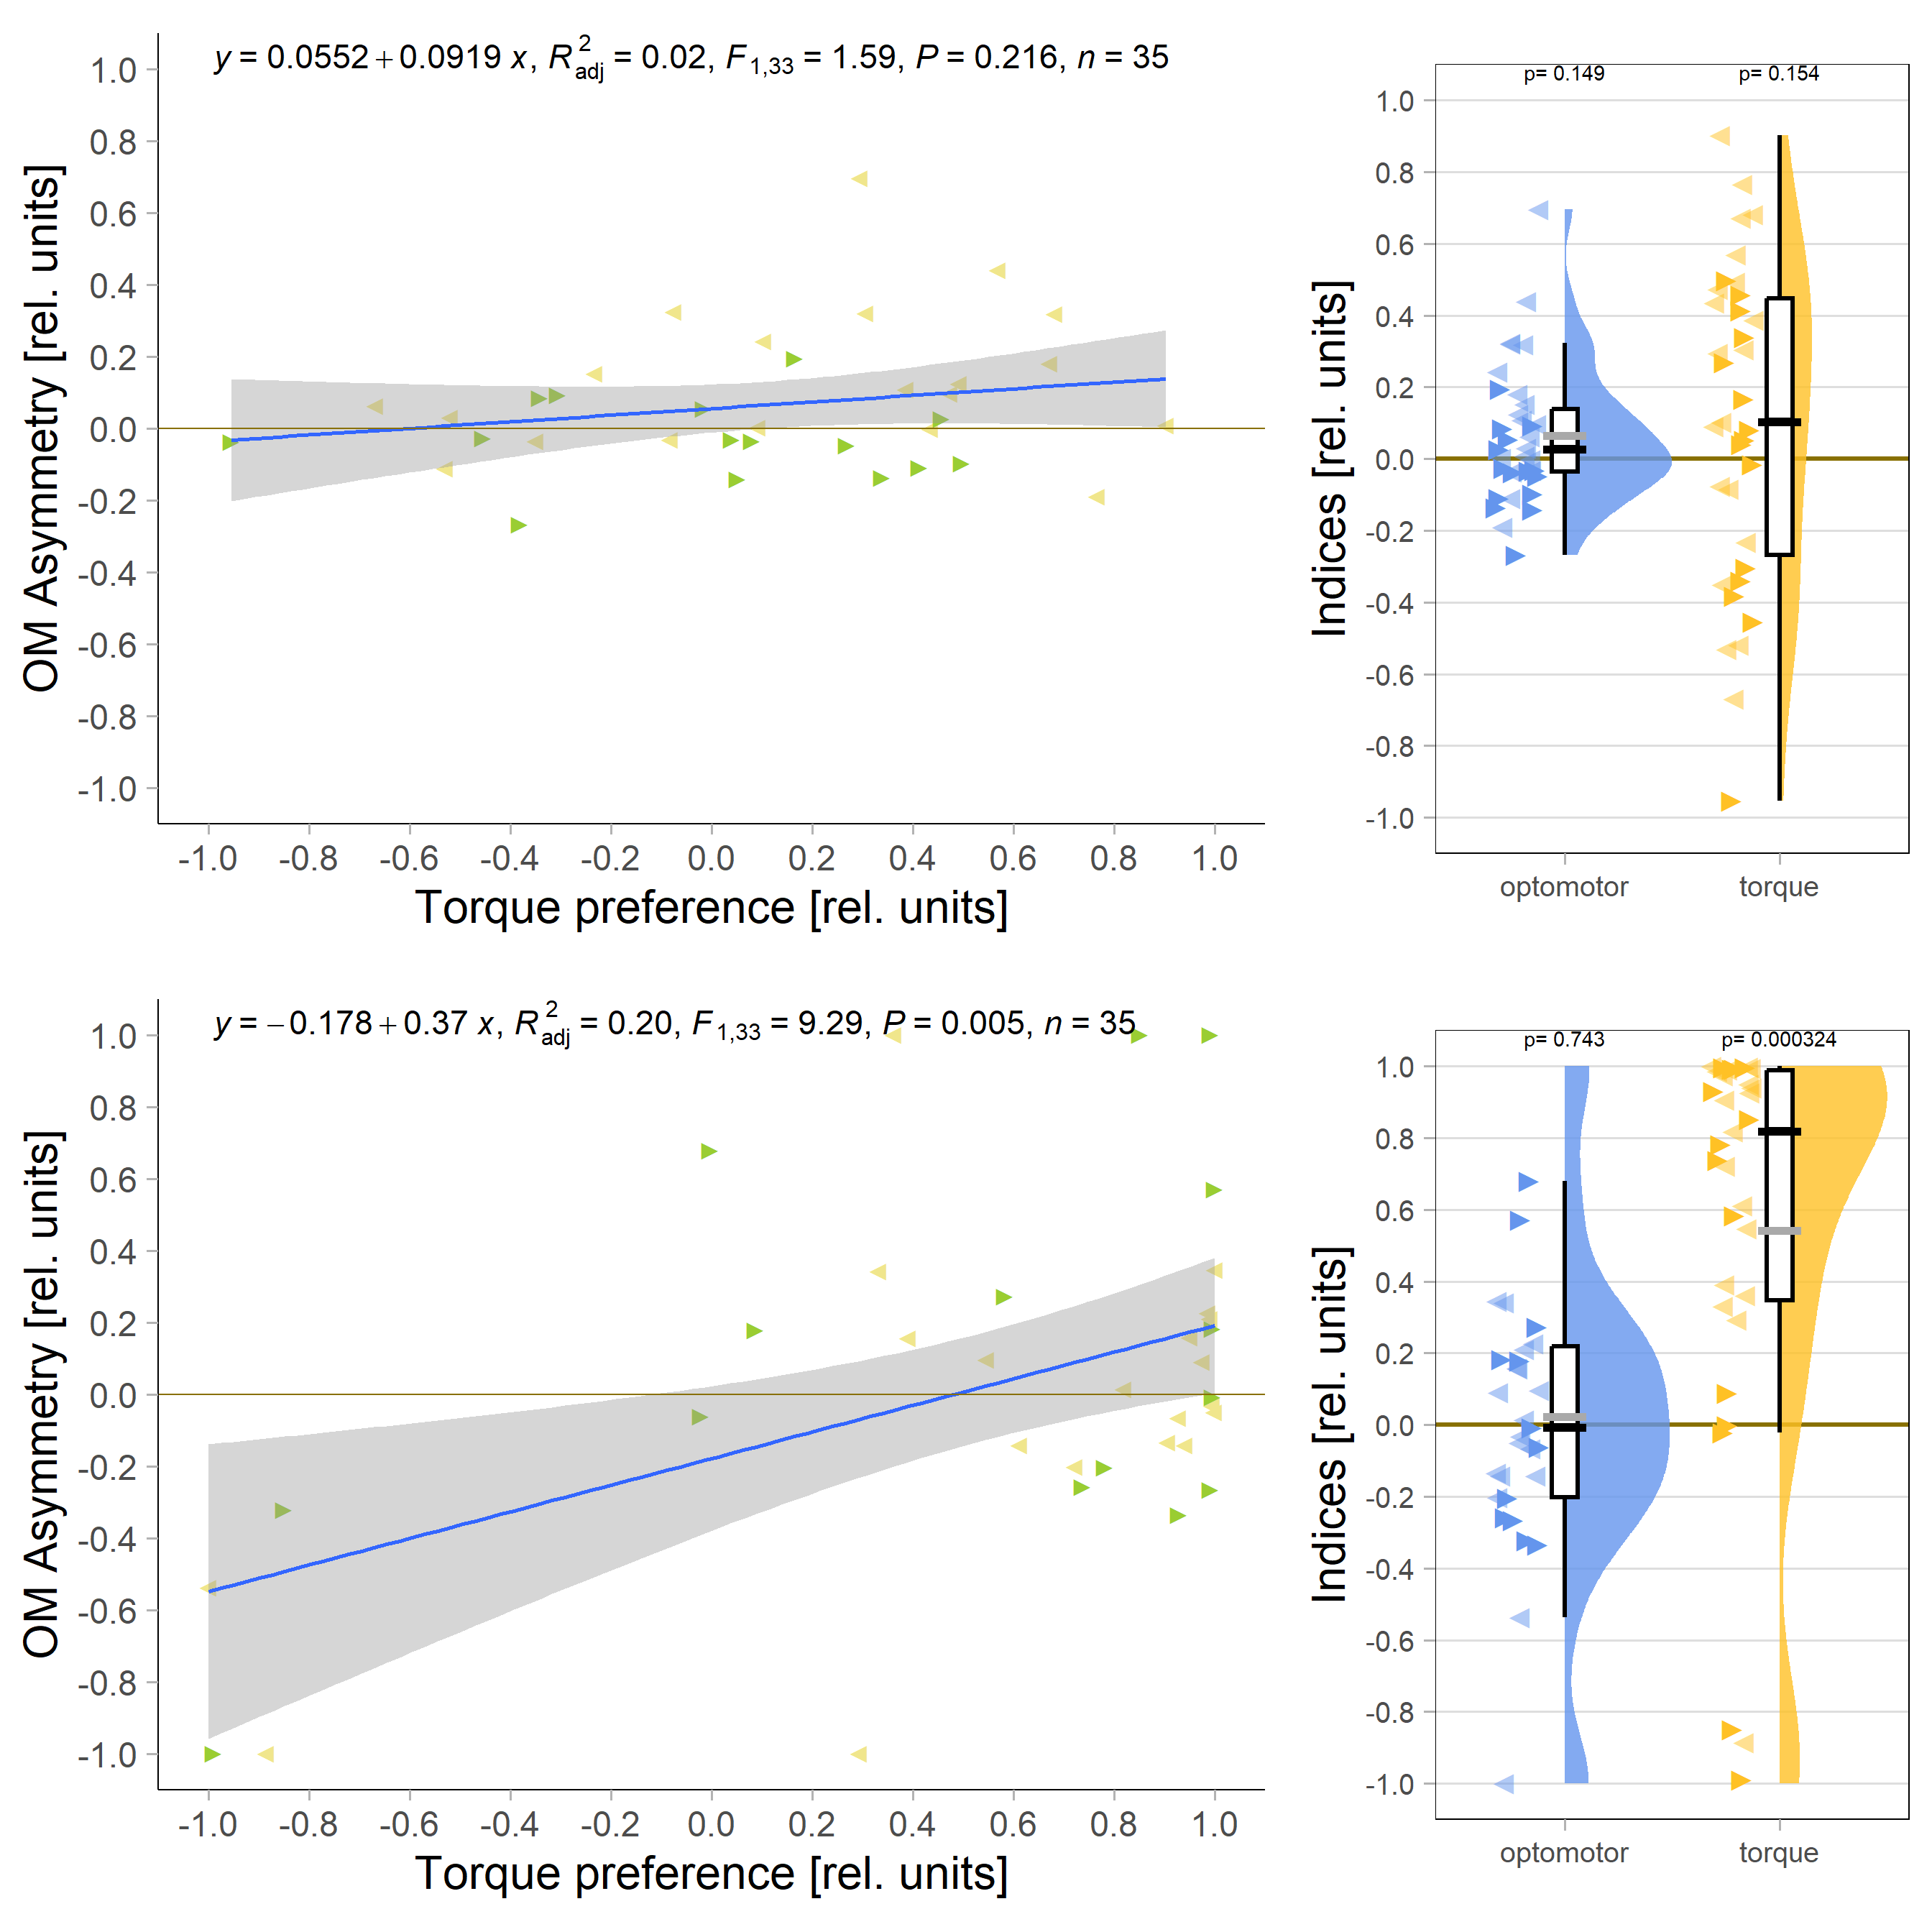
Either way, when I pooled the control flies from this experiment with the same genotype from the last experiment to get to 42 flies, only the group that was punished on left-turning torque showed the modulation:
Accordingly, the quantification shows no difference ion the control group either:

And no significant correlation between the indices either:
All in all rather puzzling results that reinforce my view that the OMR effect is much too small to practically work with. That means one of the next goals must be to get this effect size increased by, perhaps, decreasing the strength of the optomotor stimulus?
Final aPKC KO in b1/b3 motor neurons results – for now!
As it seems the flies without aPKC in b1 or in b3 steering motor neurons seem to learn fine, I’ve decided to leave this dataset where it is:

But I will try and analyze their optomotor response in more detail, maybe these flies can dissociate between the spontaneous preference and the OMR plasticity?
b1/b3 aPKC KO flies still learning, OMR unaffected
Now with over 20 flies in each group, it becomes more and more apparent that both the flies without aPKC in either b1 or b3 steering motor neurons still learn just fine:

As with the aPKC knock-out in FoxP neurons, also here, the optomotor response seems normal as well:

Interesting is the scatter in the slope parameter for the control flies:

Getting there: knocking out aPKC in b1 or b3
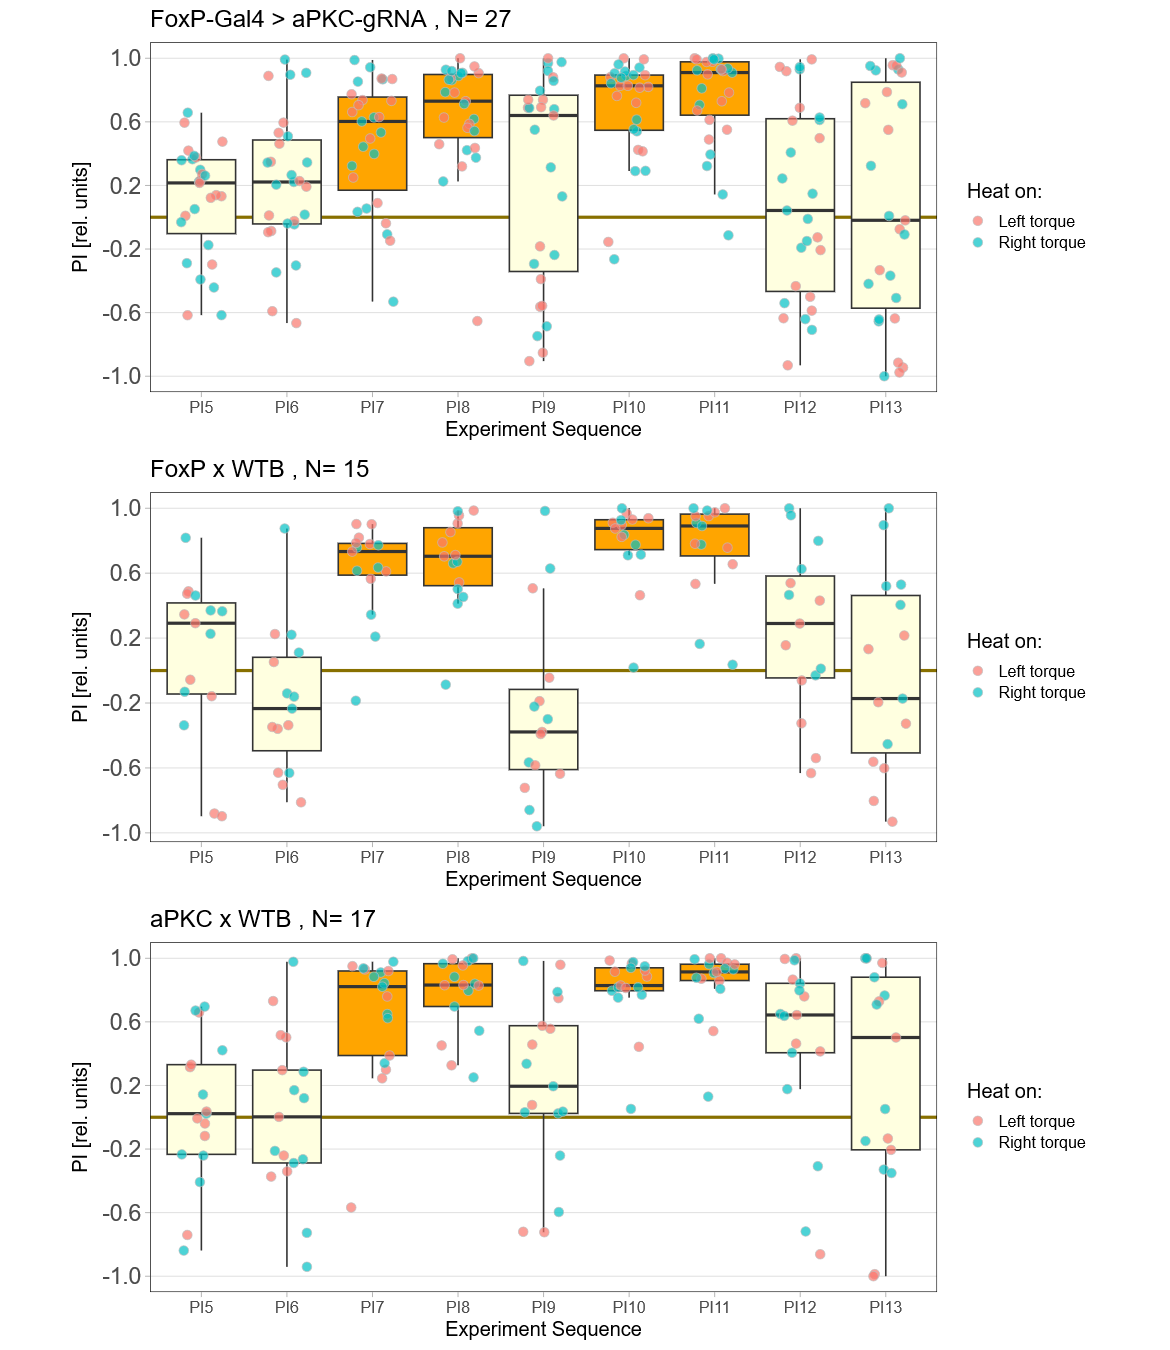
Slowly getting the sample size going. As of now, it seems aPKC is either not needed in steering motor neurons b1 and b3, or that knocking aPKC out in only one of them is not sufficient to have an effect on operant self-learning. Shown is the first 2min test period after 8min of training, all three groups seem to show learning, at least at this stage:
Early days: testing individual steering motor neurons in self-learning
Now that we have established that the plasticity underlying self-learning is located somewhere in the steering motor neurons of the ventral nerve cord, the next question is: which of the neurons are involved. To this end I have now started to knock-out aPKC in either B1 neurons or in B3 neurons. The muscles innervated by these motor neurons are an agonist/antagonist pair and serve to advance/delay the turning point of the wing, leading to a larger or smaller, respectively, wing stroke amplitude. Asymmetry in the activity of these neurons leads to yaw torque – which is the behavior we condition. In the first two weeks, I noticed that all three groups (B1- knock-out, B3 knock-out and genetic controls) seem to fly reasonably well. So far, it doesn’t seem like there are any striking differences between the lines, but it is still early days and about three times more animals are needed before one can draw any firm conclusions:

Small but important differences
Slowly the data are filling up and we start to see some differences emerge between the controls and the aPKC knock-outs:

We still need to get to about N=40, so there is still some way to go.
Quality control reduced number of animals
Going over the optomotor responses with a fine comb revealed a bunch of flies where the algorithm wasn’t able to provide a proper fit for the OMR asymptote. Therefore, I will need more time to finish the data set. Here the current torque-learning PIs:

Clearly, the genetic controls learn while the flies with knocked-out aPKC in FoxP neurons fail to show a significant learning score. However, the OMR asymmetry effect in the genetic controls appears weaker than the one we discovered in WTB flies, as can be seen in the OMR traces after the self-learning:

Then again, at the .05 level, the asymmetry index is significant. Not the alpha level we commonly use, but also a lower N than we strive for (above is before training, below is after):

The transgenic experimental flies, in contrast, don’t seem to show much of an effect at all:


Yaw torque avoidance reference
Just to have an example of yaw torque datasets and how they should avoid: