Coded the regression analysis
on Thursday, September 7th, 2023 2:16 | by Björn Brembs
I now switched the sign of the Optomotor Asymmetry Index in flies that were punished on producing right-turning torque, such that weaker punished torque shows up as a positive index. After that was done, I plotted the correlation between the optomotor index and the preference index:
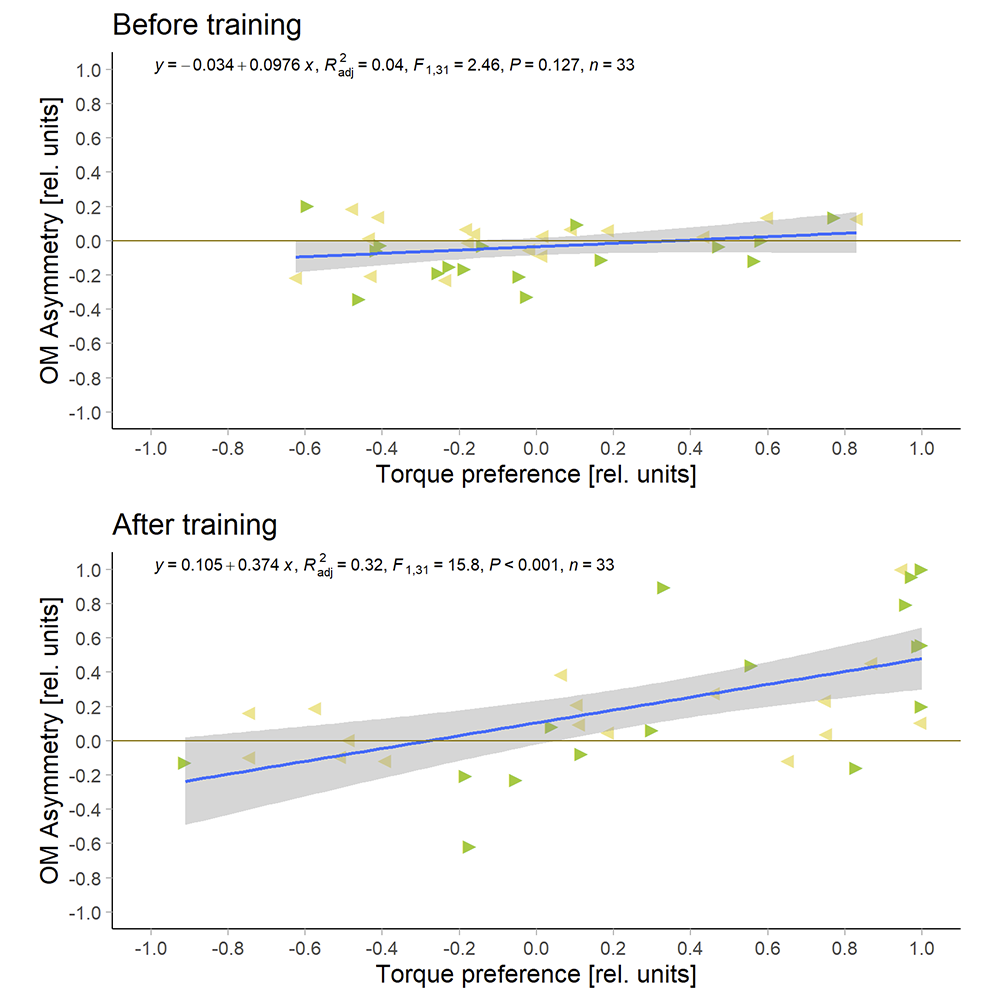
I had to get rid of eight flies where the optomotor response was already asymmetric before the training started, so now I only have 33 flies. But with these flies, there is no correlation before training and a very significant correlation after training.
Any suggestions about appearance of the graphs?
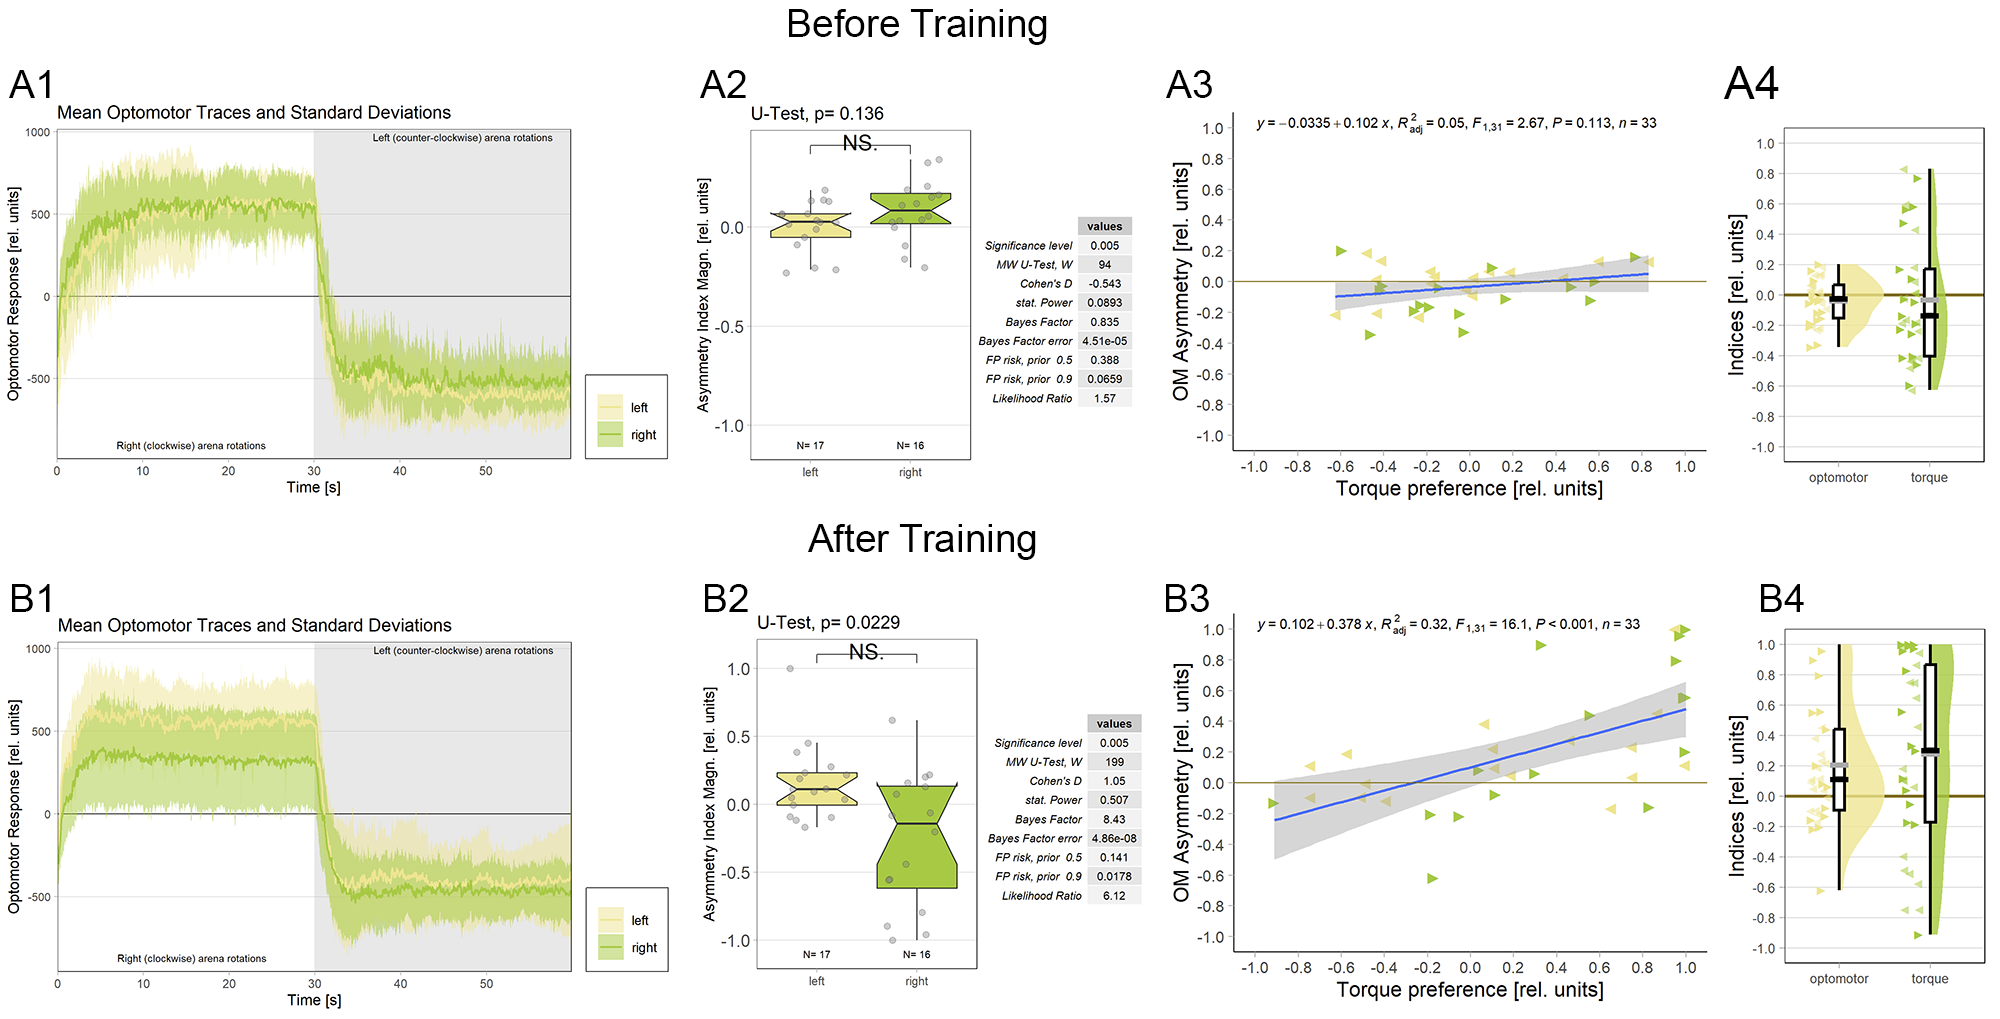
Would it be useful to plot optomotor and performance indices as raincloudplots next to the regressions?
This would be the complete figure:

Category: operant self-learning, Optomotor response
Leave a Reply