Breaking the ellipsoid body code
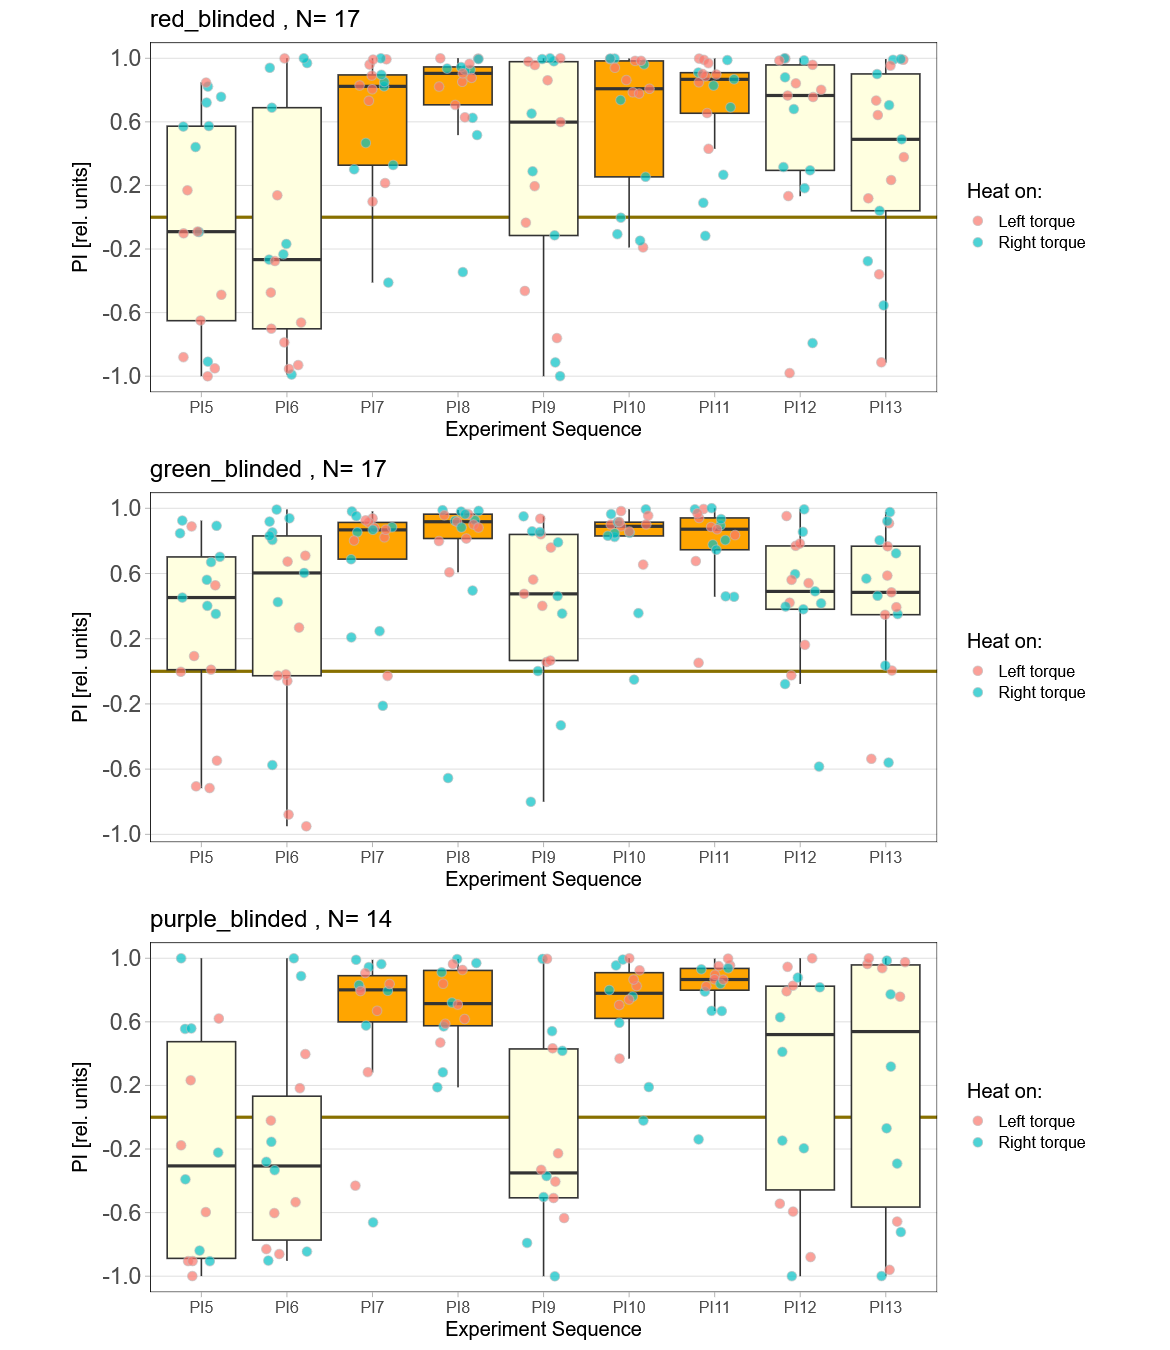
Now that I’ve reached a sample size of near 30 animals in each group, it was time to break the code to see which group was wich. To my surprise, the worst performing group in term,s of learning was the control group:
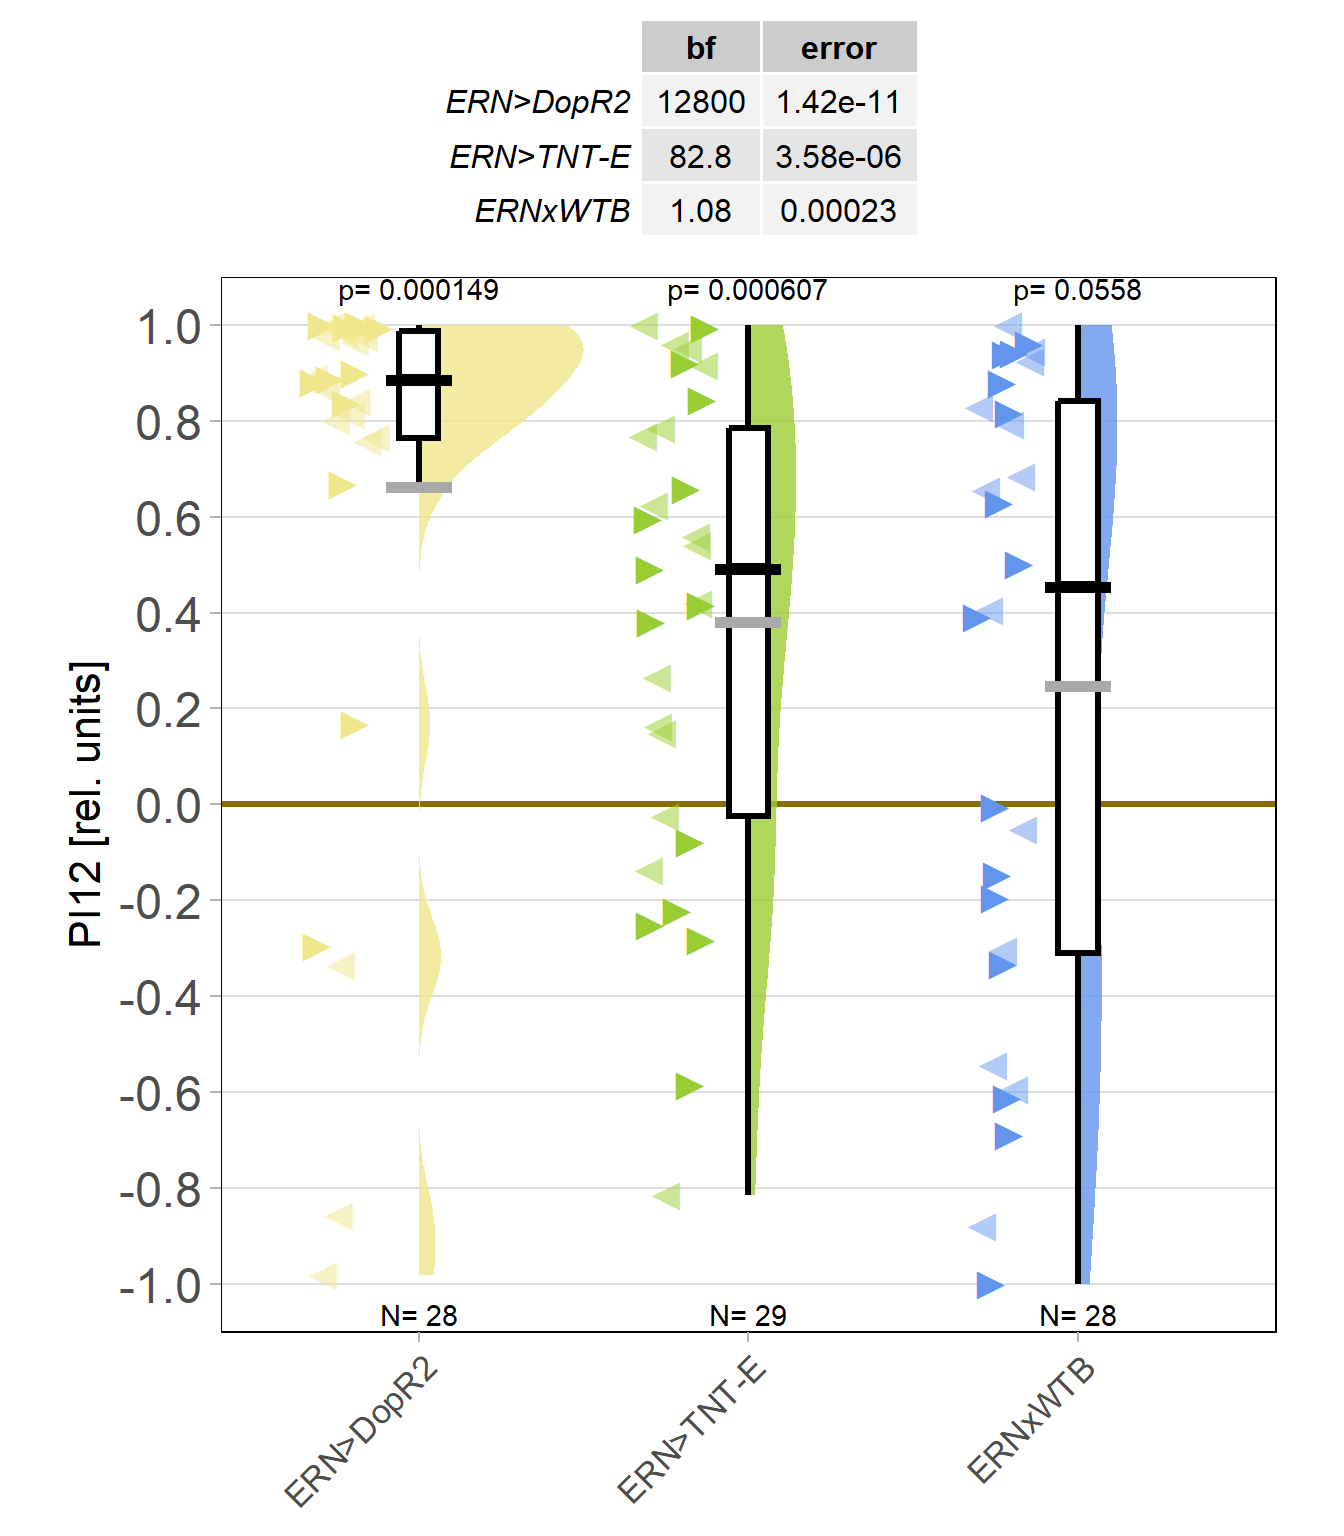
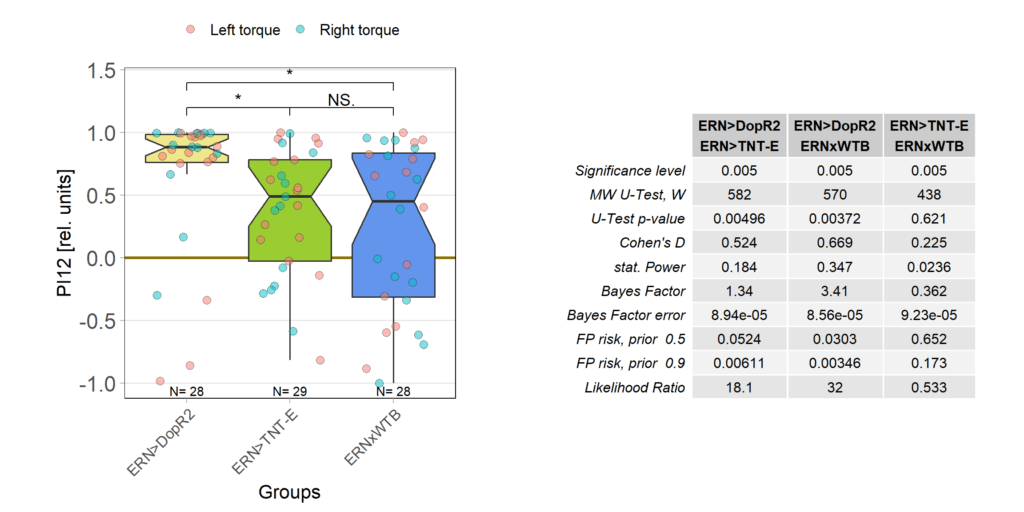
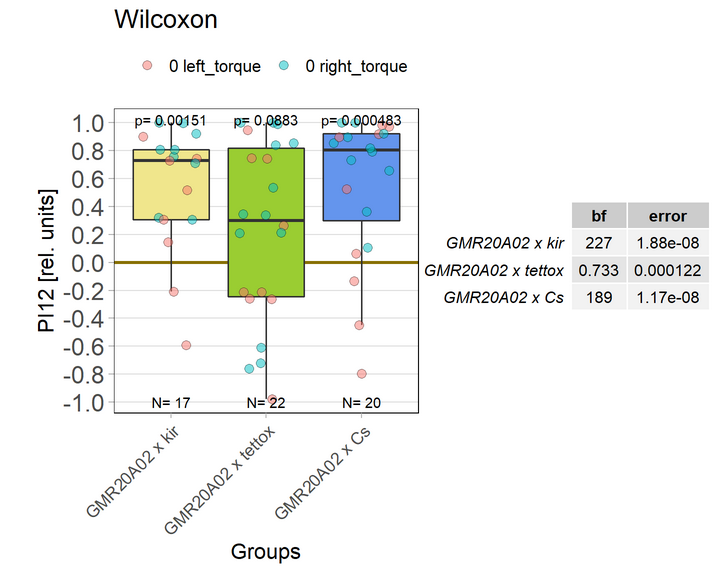
It is unusual for between-groups comparisons to become statistically significant at the 0.005 level with a sample size of less than 50, let alone 30, but these DopR2 knock-downs in ellipsoid body ring neurons are just a class of their own:
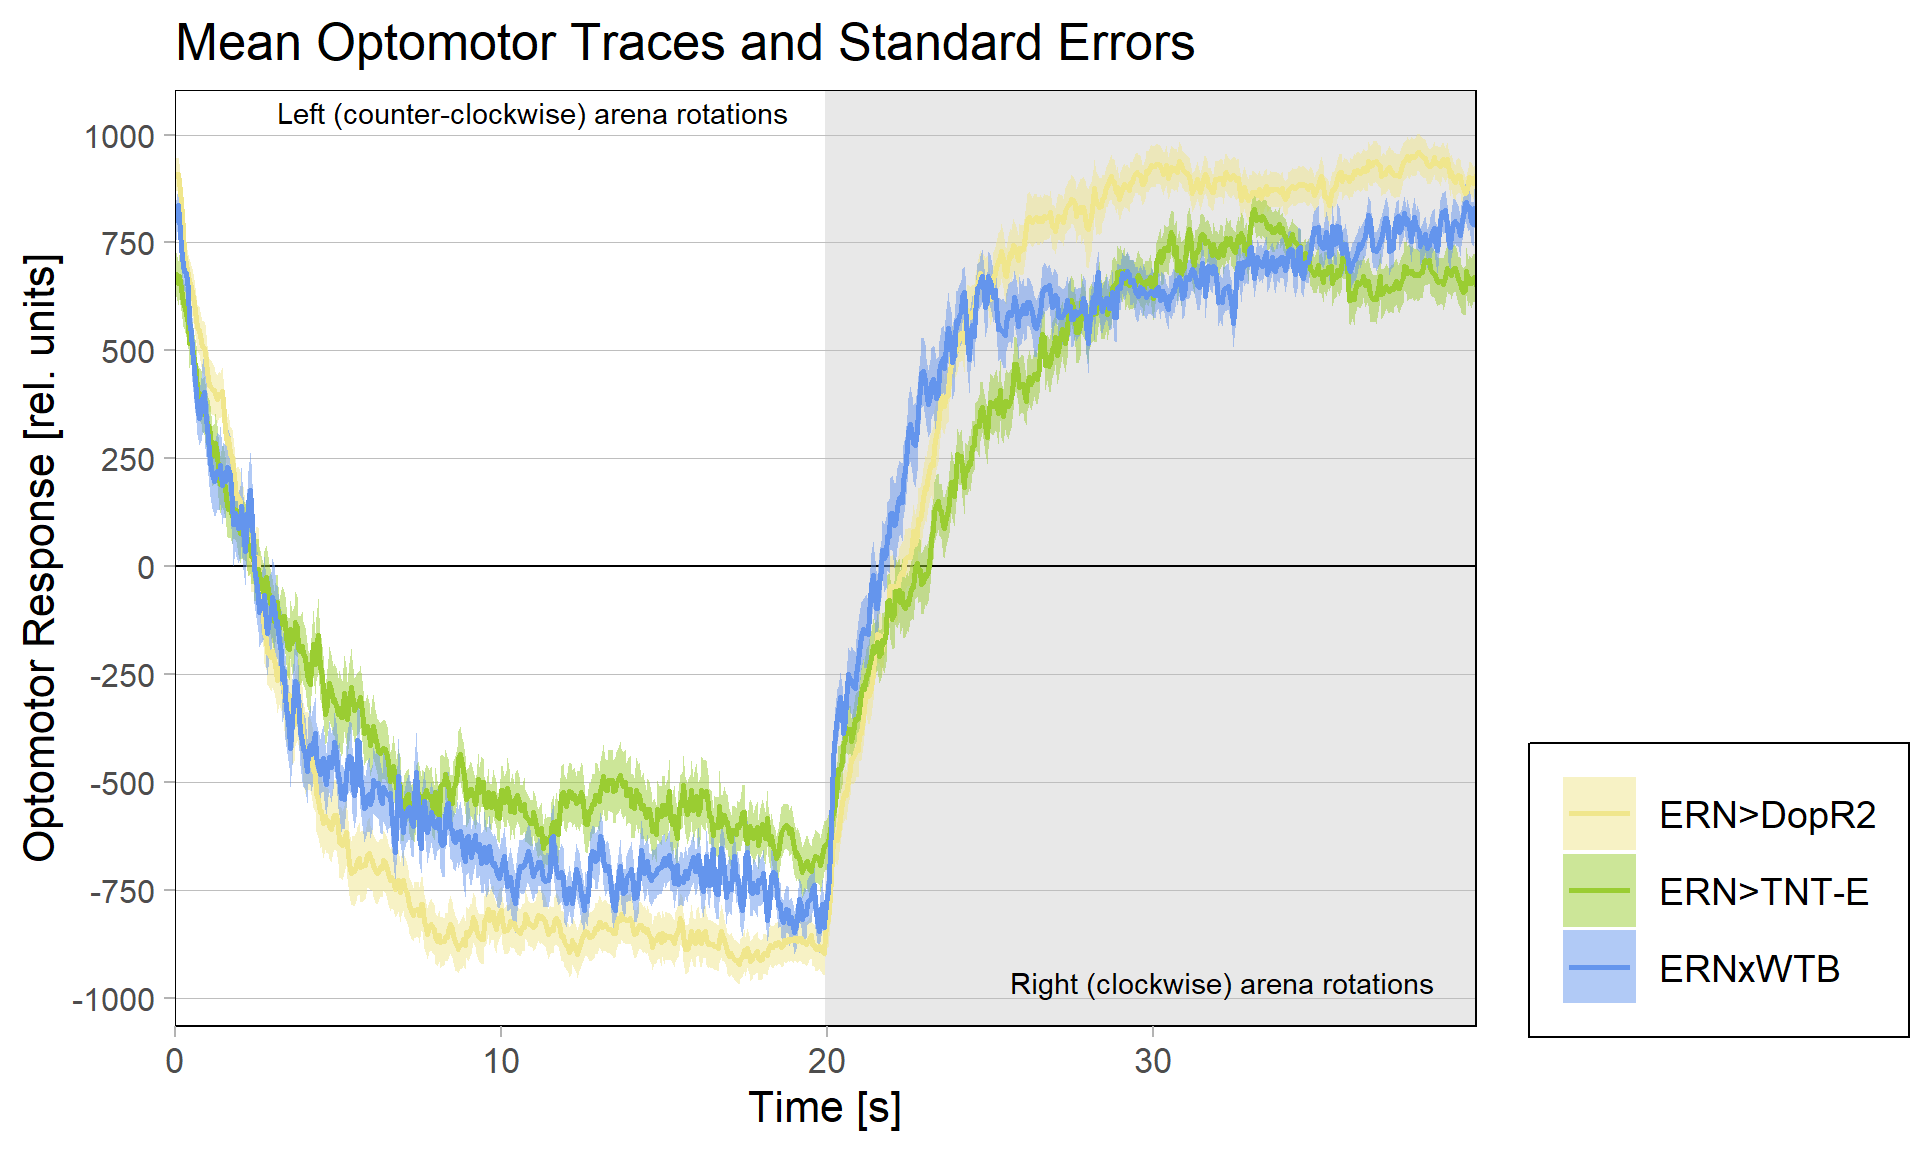
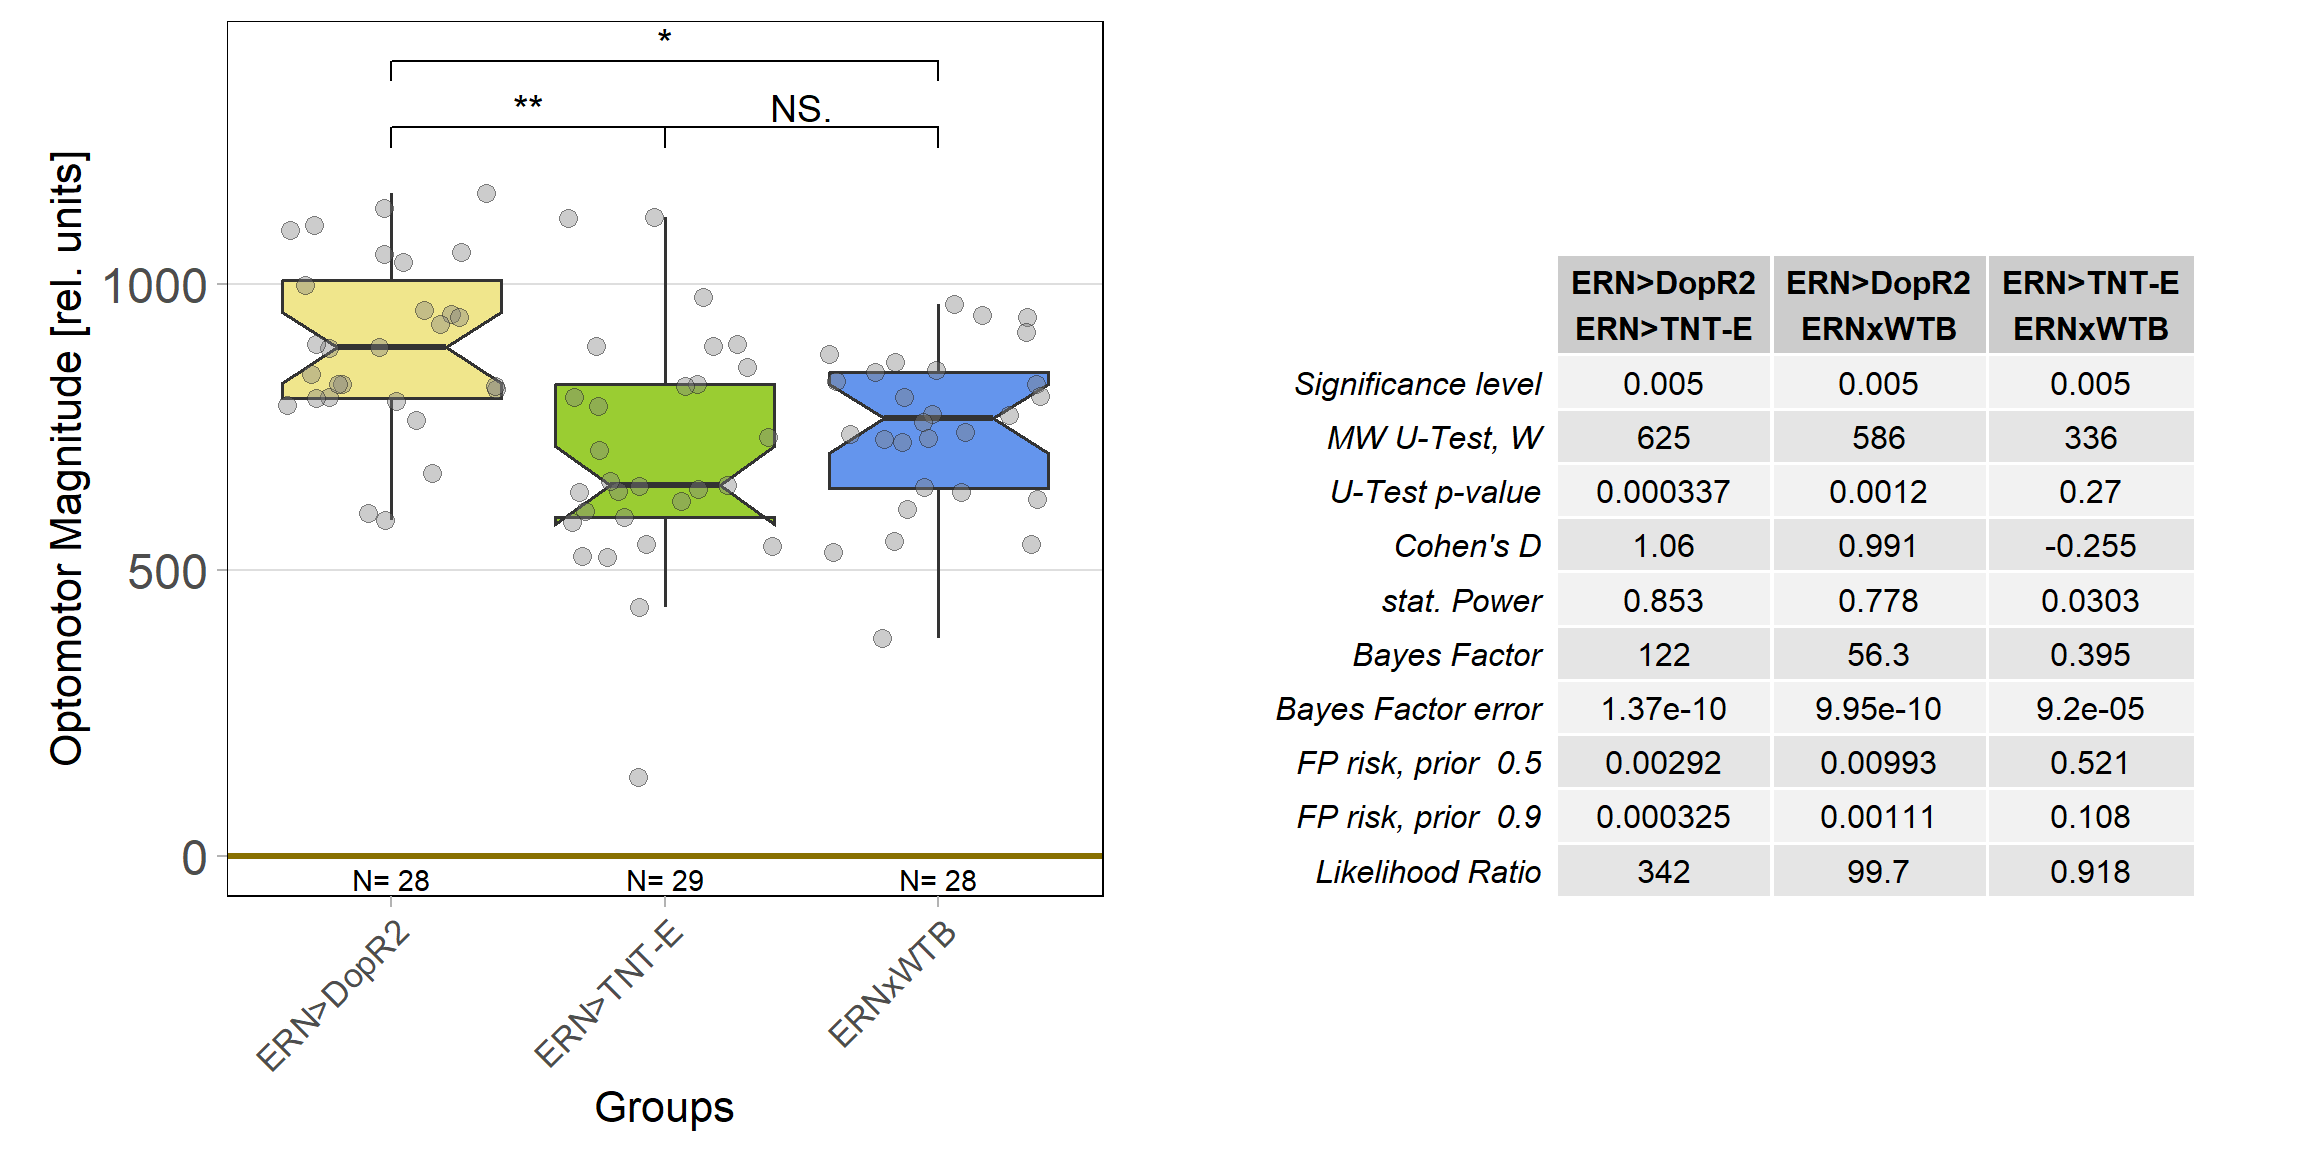
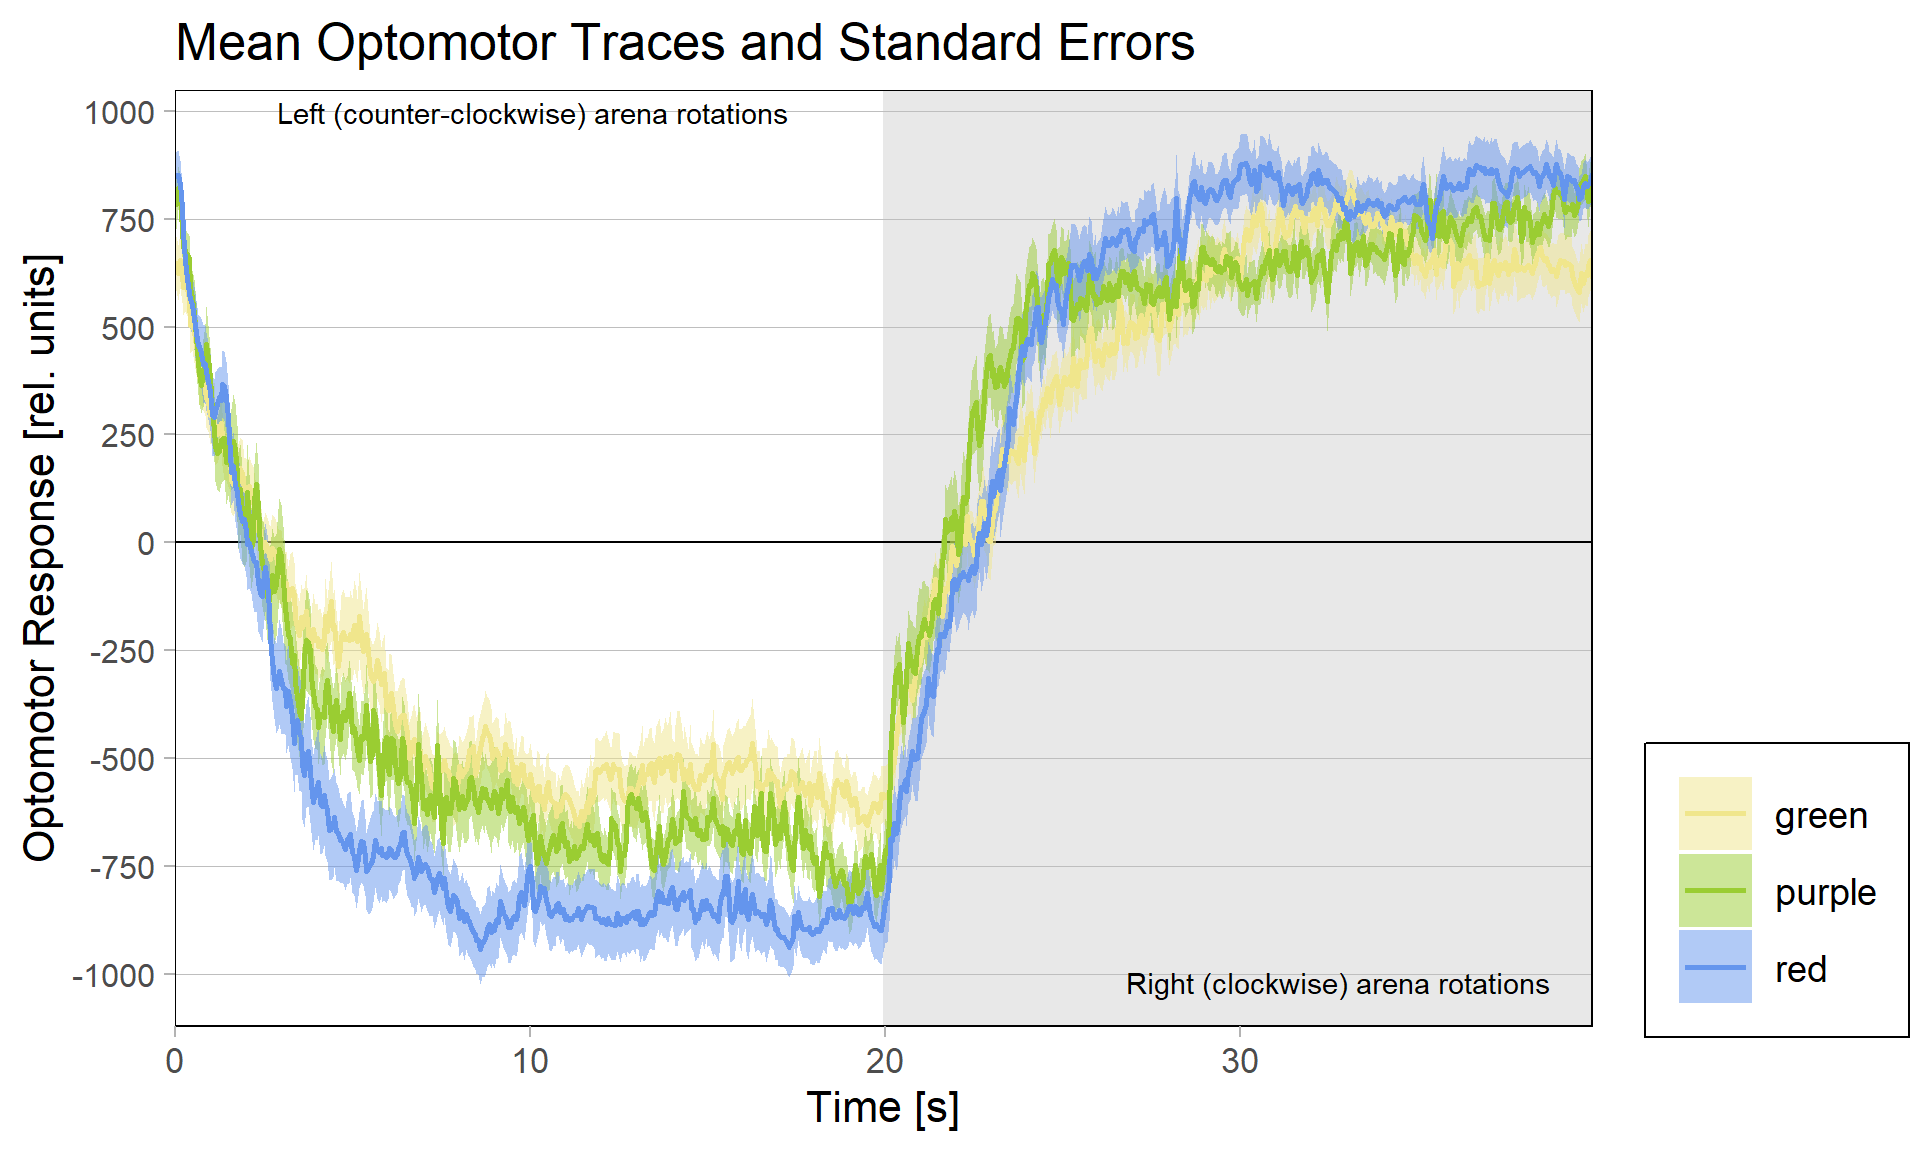
The DopR2 receptor knock-down not only performed exceedingly well in these leaning experiments, it was also the cross with the strongest optomotor response:
And also that difference is statistically significant:
The TNT-E flies had a slight positive preference, worse avoidance (esp. in the first training period) and flew really bad. One could say they did have some learning deficits, but it doesn’t look as if learning was completely abolished (which is roughly what Andreas had found before):
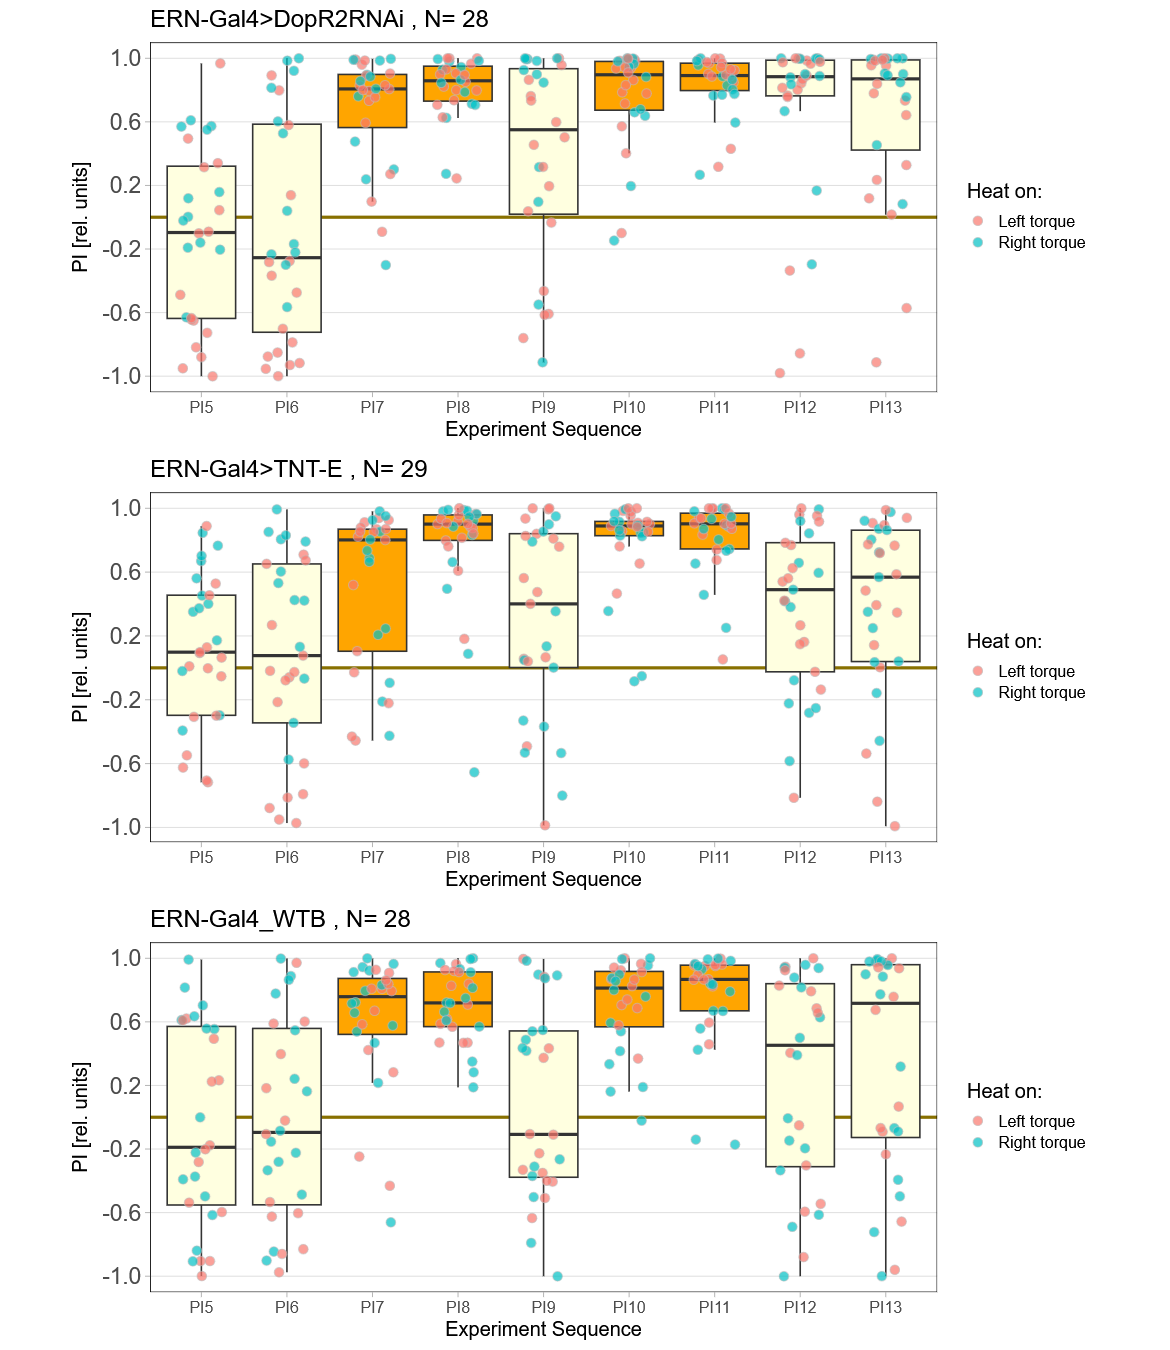
Andi’s results:
Almost there now…
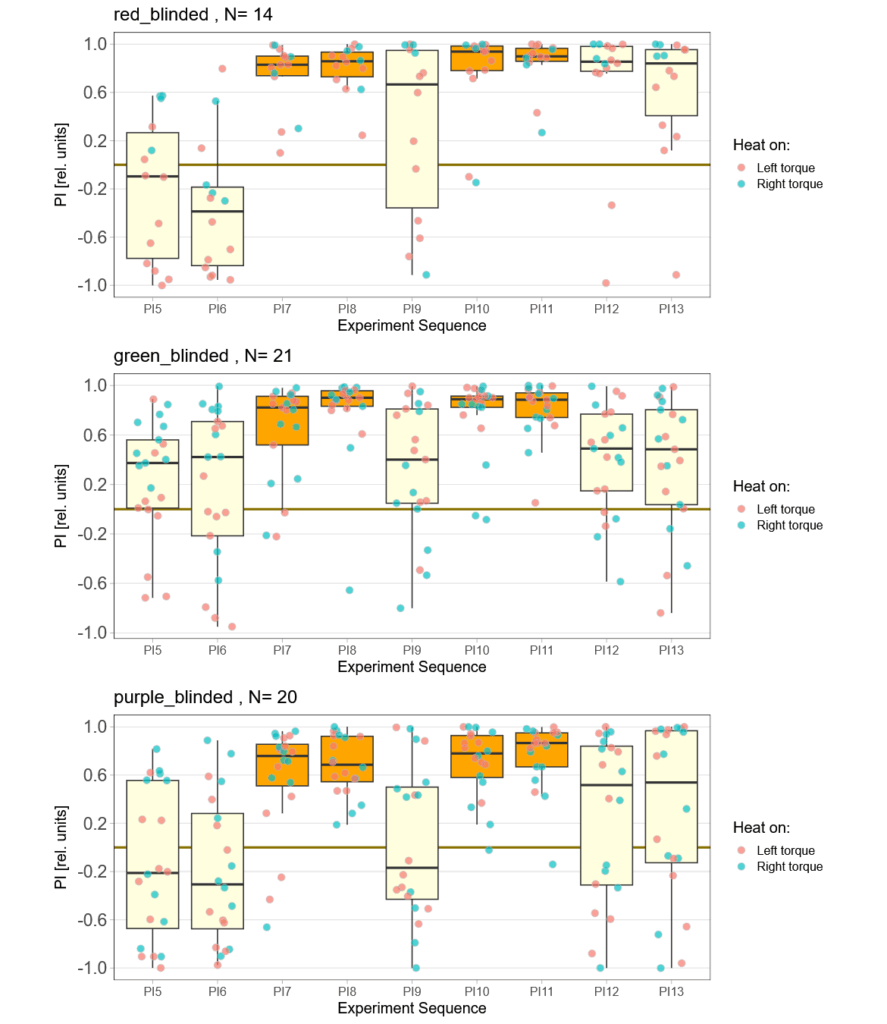
Getting close to a sample size of 30! One, maybe two weeks left, depending on how much time I find to measure. Time to break the code is drawing nearer. Here the current results:
Some interesting statistics:
Massacre by quality control
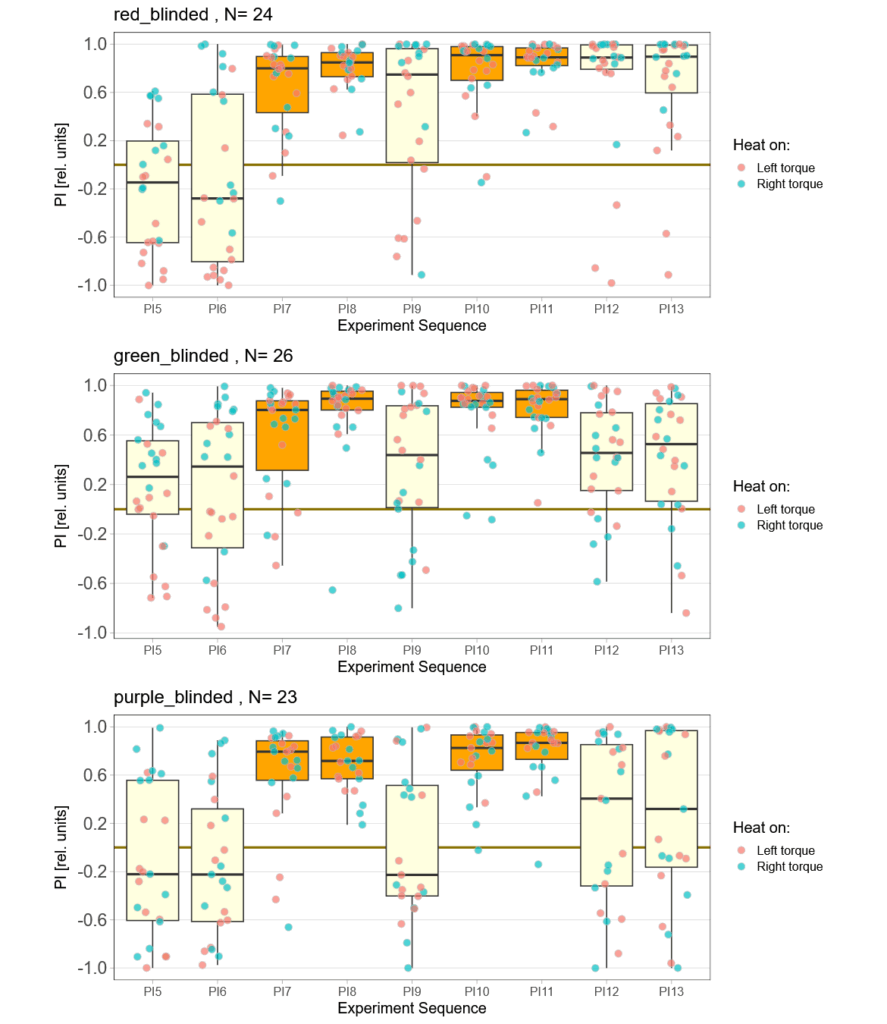
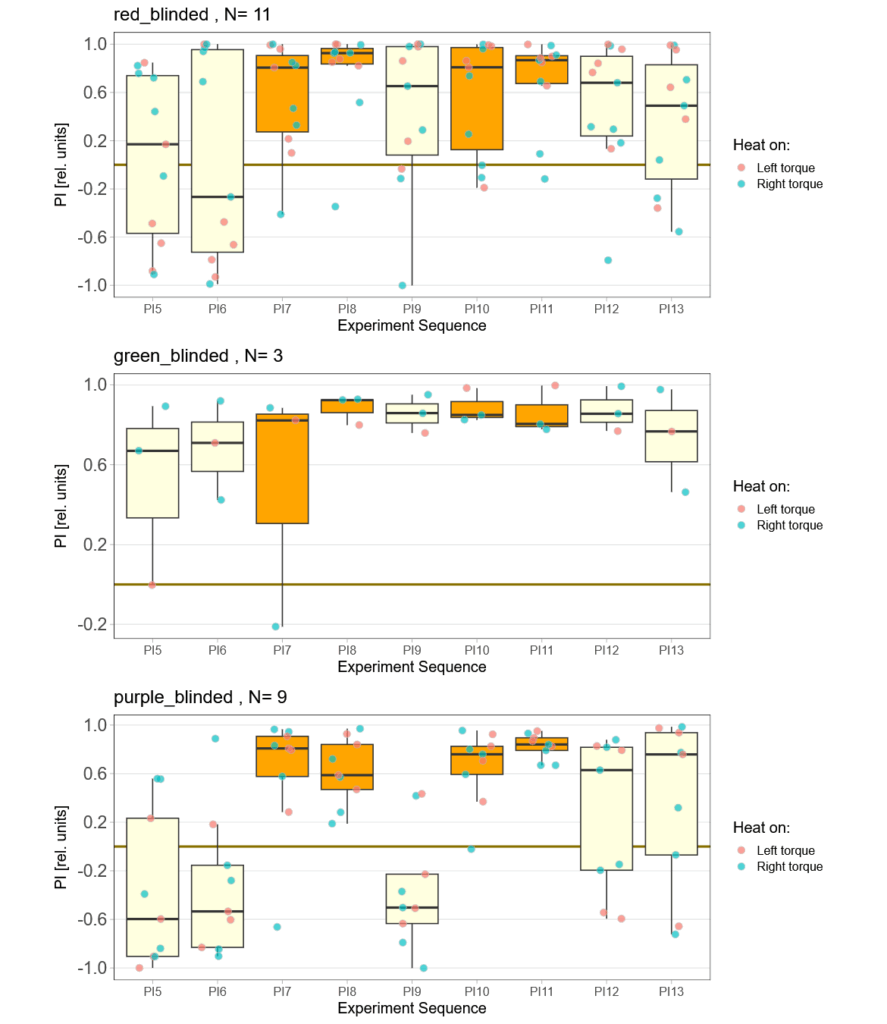
Finally found some time to go through all the individual fly data. All groups lost some flies that had to many or too long flight pauses, strong preferences already before training or some other screw-up during the experiment that I either failed to notice or only showed themselves in this quality control phase. And it was the red group, where I had thought everything just worked so fine, that lost most flies. More than a third of all the flies I had tested in this group failed the very basic quality control criteria – double the number of any other group. This is very annoying as it means there now are a lot more flies for me to test. Nothing to do about that, than to carry on. Here is the result after the massacre, where red lost 10 flies, green lost 5 and purple lost 2:
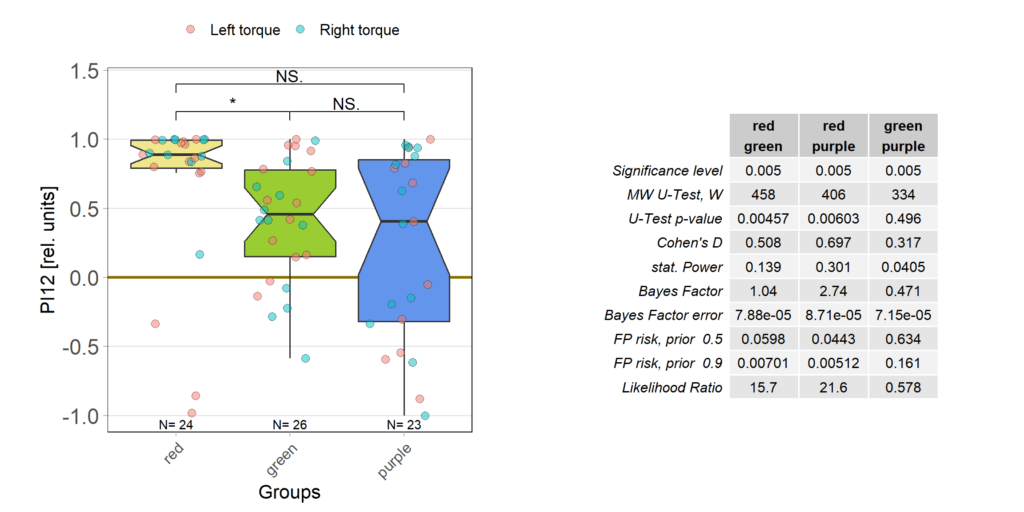
But even with so many flies removed, the red group still has the flies with the strongest optomotor response:
Collecting ellipsoid-body self-learning data, week 2
Now two weeks of data collection, but so far no time for quality control. This means a bunch of flies will likely drop out after I have been able to check for the quality of the reocrdings. So far, one group (red) seems to learn really well, while the other two are too early to tell.
Raw data avilable on the publication server.
Starting to probe the ellispoid body in torque learning
In this project, one of the two experimental groups inhibits the ellipsoid body ring neurons using TNT-E. The second uses RNAi to knock down the DopR2 receptor in these neurons and the third is the driver control. As I am blind to the groups and it’s only been one week, the data are not terribly revealing, yet.
Data sets pooled
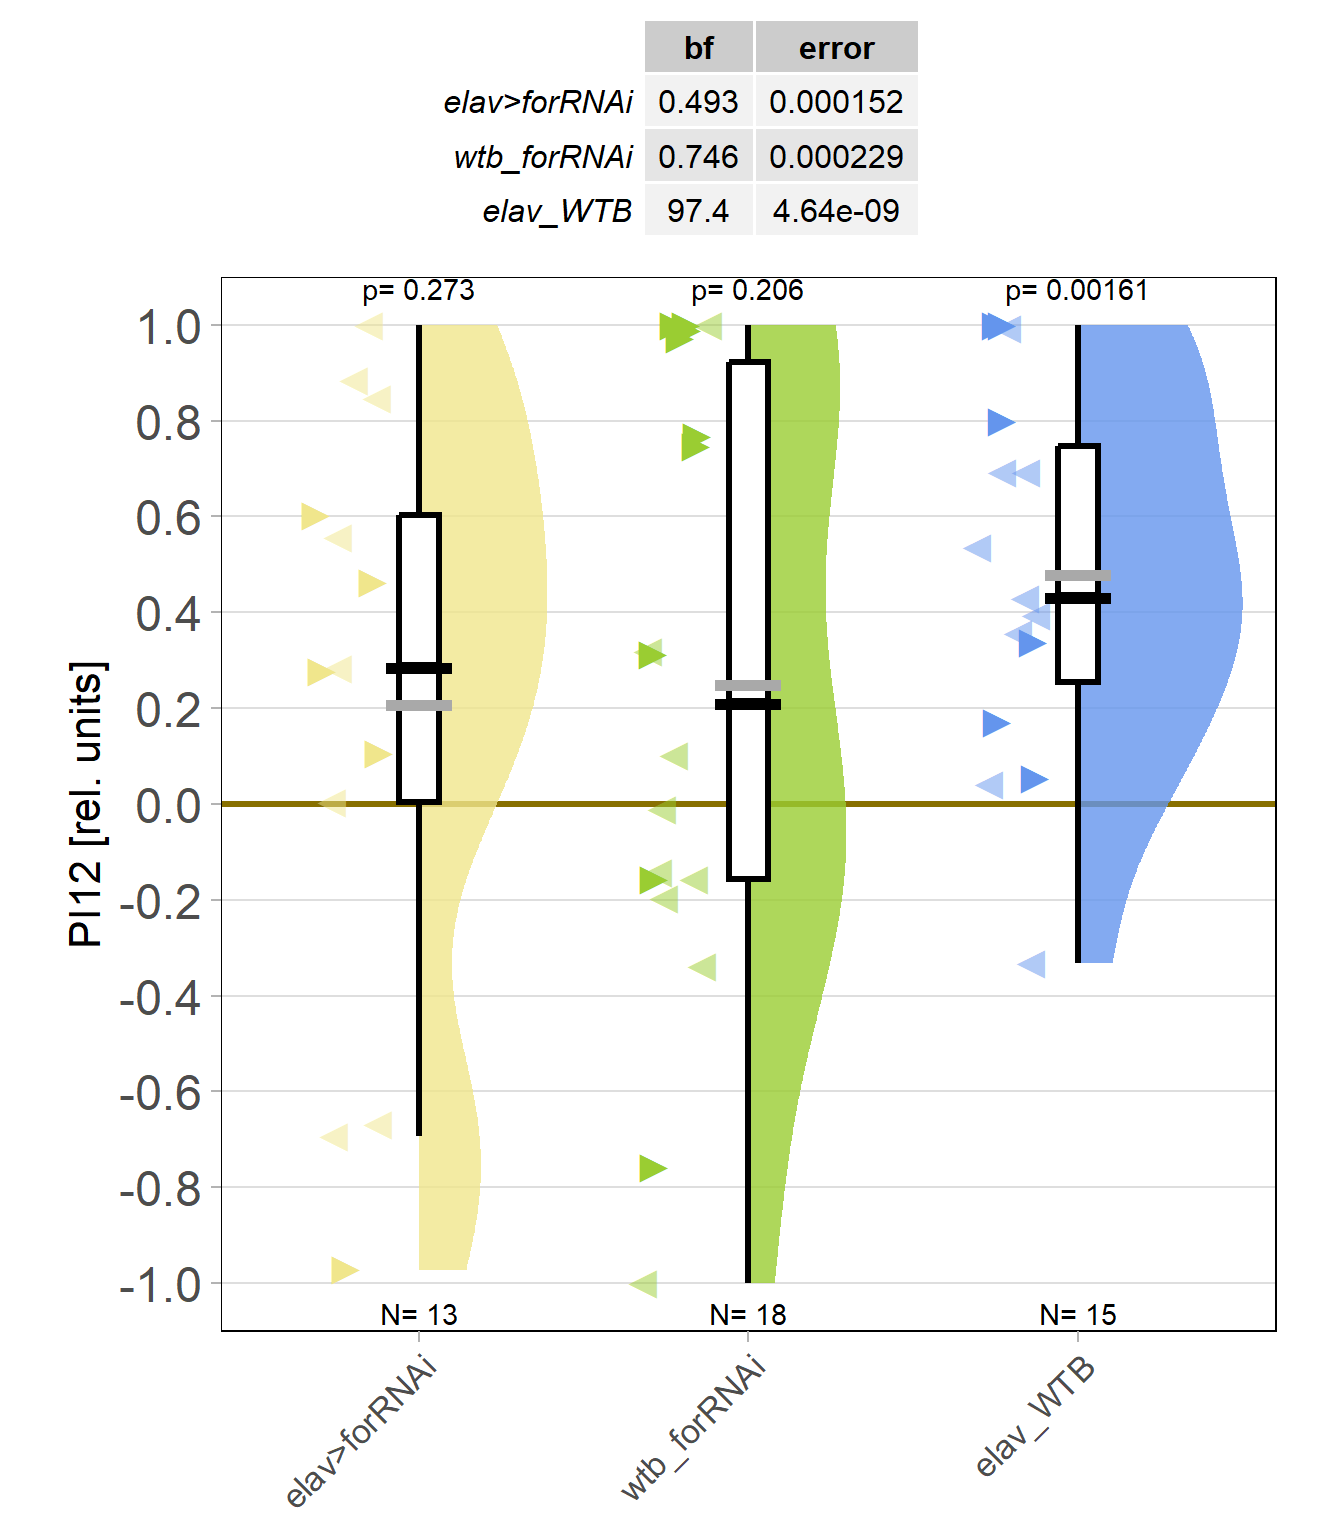
I managed to write some code that shortens Tina’s optomotor periods and then adjusted the metadata between our experiments so that the script would run without any errors. So this is what our combined tests of expressing the foraging RNAi in all neurons looks like:

The full dataset is also available on the UR publication server.
It’s alive!!
Last week, Pavan Kaushik and I finally got the VR-panel setup working. I placed four flies in the machine, one in each VR cube, and then ran each fly three times with a sequence of 8 different pattern wavelengths, also repeated three times, each one rotated both counter-clockwise and clockwise. This is also the sequence which we will use in the course. This is what the data should look like:

and this is what our data looked like:

Looks to me like we got it working on the first try. Love that data. Great example to compare the course data against.
The code for evaluating the VR-Panel data is on GitHub.
Not an unambiguous result
This is the final graph of the experiments knocking down PKG (foraging) in operant self-learning:

The data have been automatically uploaded via the new script and can be found on the University’s publication server.
This was supposed to be a reproduction of Tina’s experiment:

While in my dataset, the knock-down flies are still performing the worst of all three groups, it is not quite as clear-cut as in Tina’s results. Then again, her knock-down flies maybe were slightly too low. Now pooled with mine that were slightly to high, maybe this is what we should expect: a clear zero. We should pool the data and see how it looks.
Not clear, yet, where this is going
Getting more and more flies, but only one group looks unambiguous. The other two not so much:
Started testing for knock-down
After just three days of experiments and lees than ten flies in each group, these results don’t really mean anything, yet, other than that data collection hast started:
