Strokelitude 5 New Rec
on Monday, April 1st, 2019 2:54 | by Miroslav Stojic
New Findings:
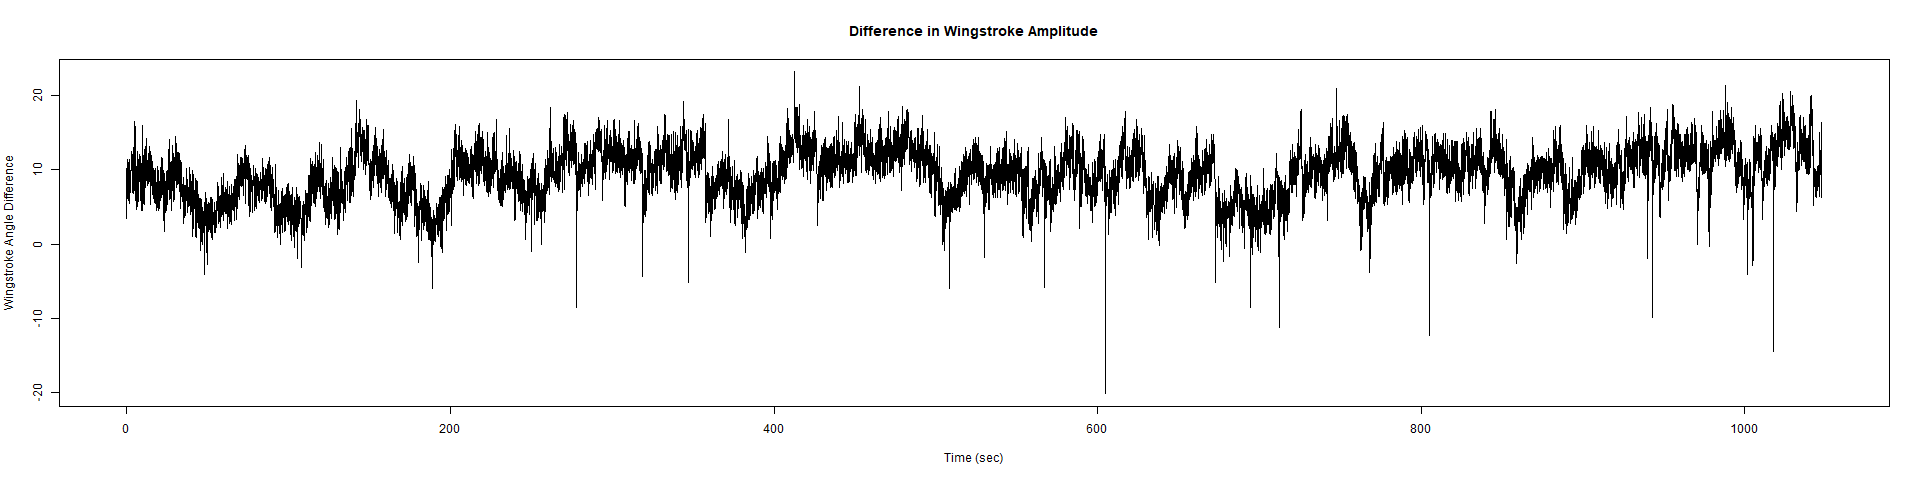
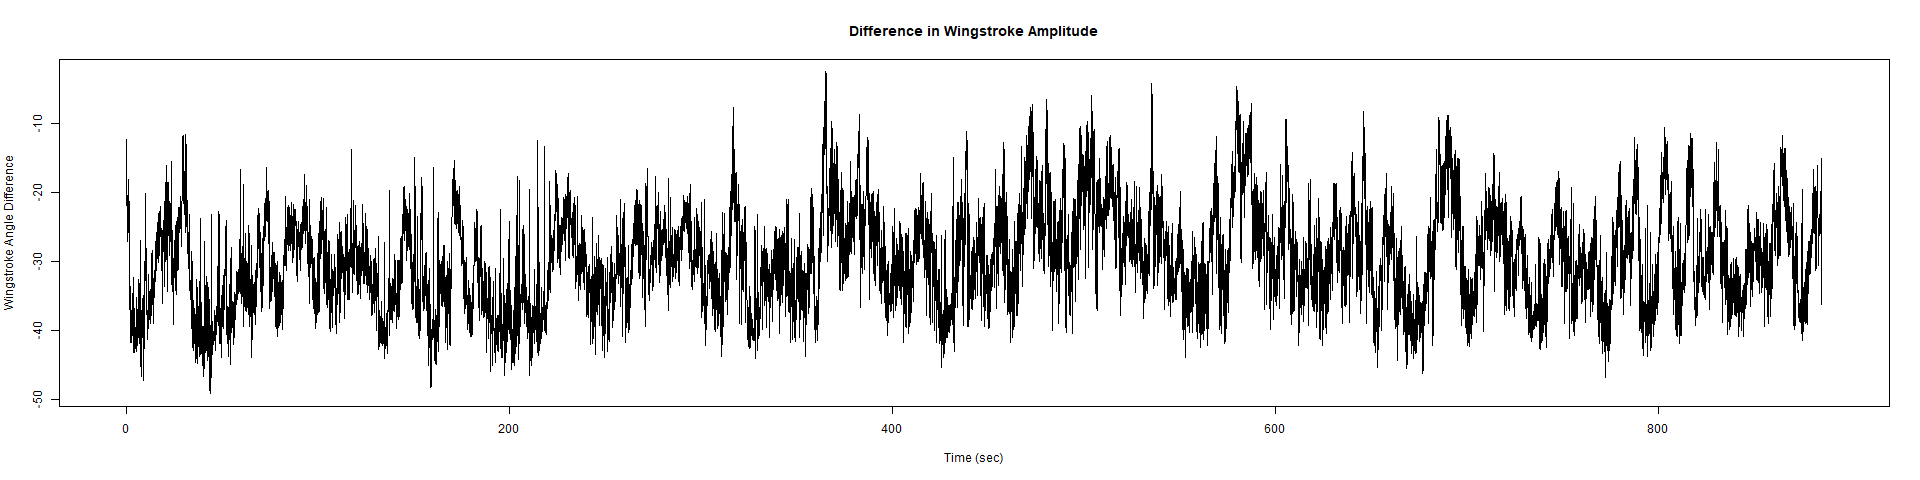
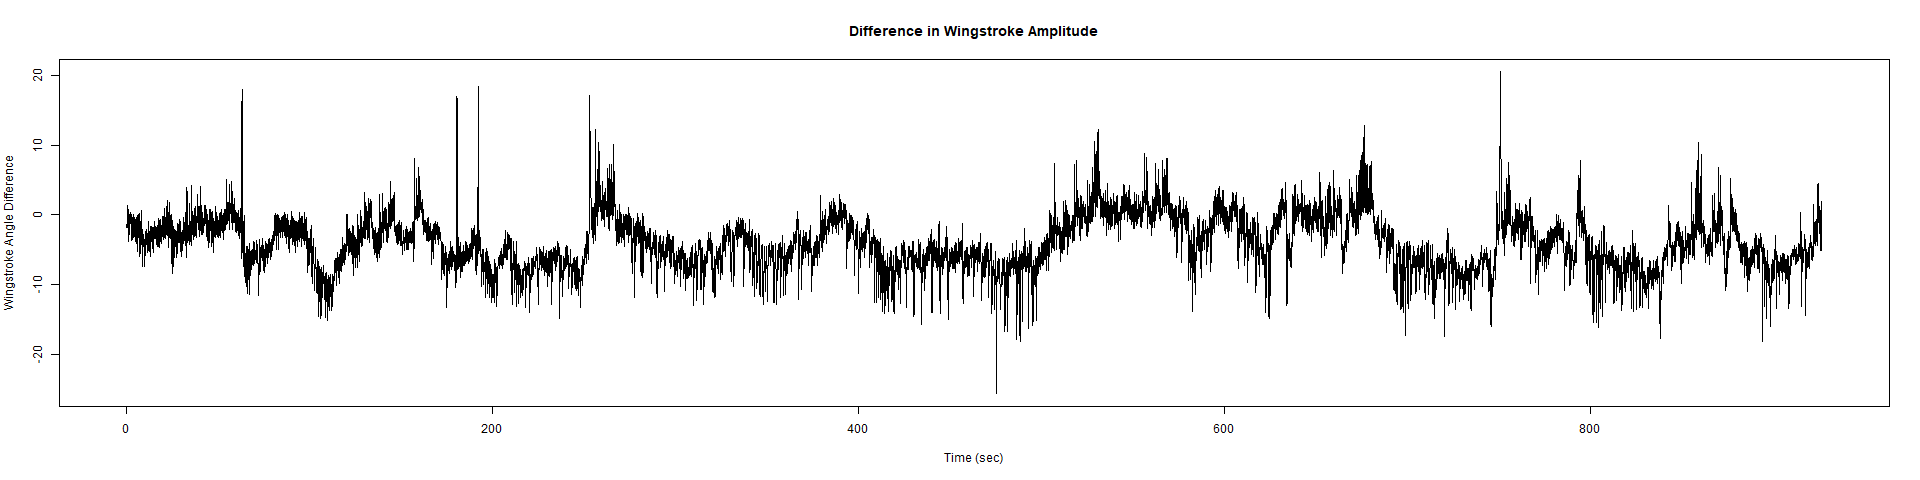
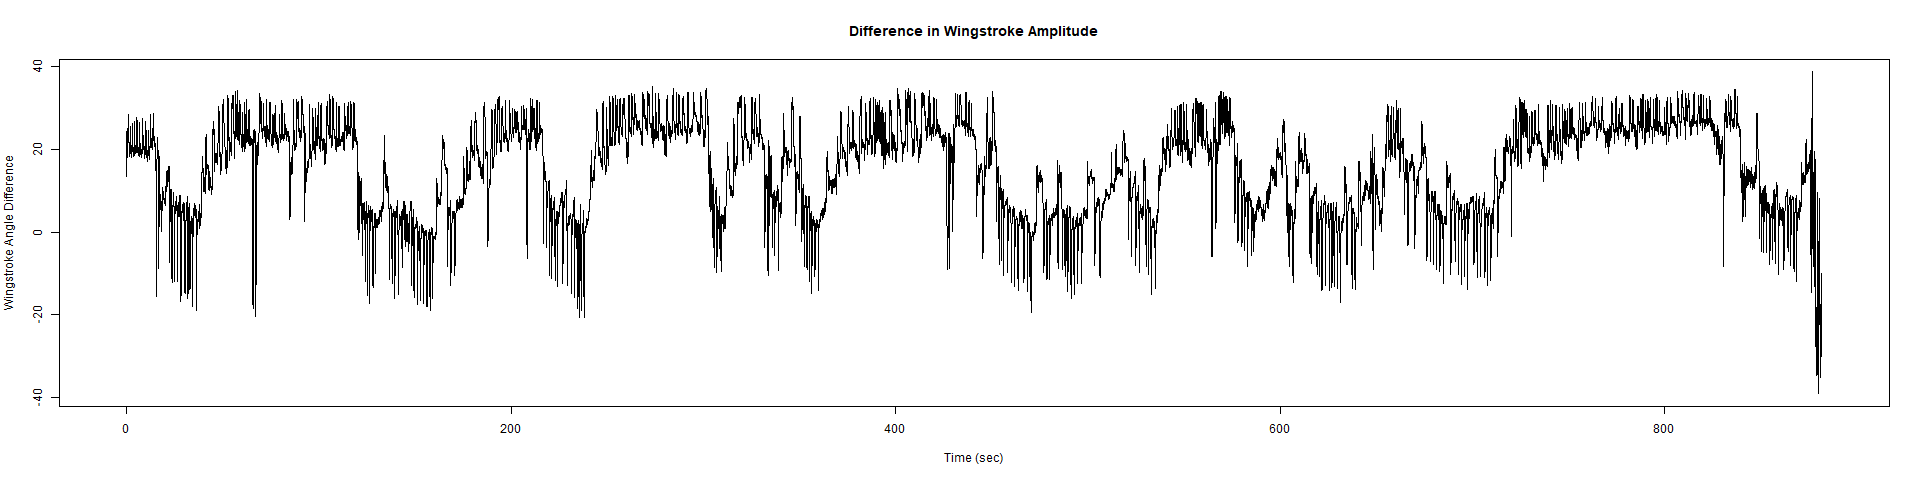
Elav-Gal4 x UAS-SERCA 44581 flies => Lethal before adulthood! (in all 5 vials so far)


Category: crosses, Spontaneous Behavior, strokelitude, WingStroke | No Comments
Strok(e)litude – Practice
on Monday, March 25th, 2019 12:49 | by Miroslav Stojic
And the journey begins…
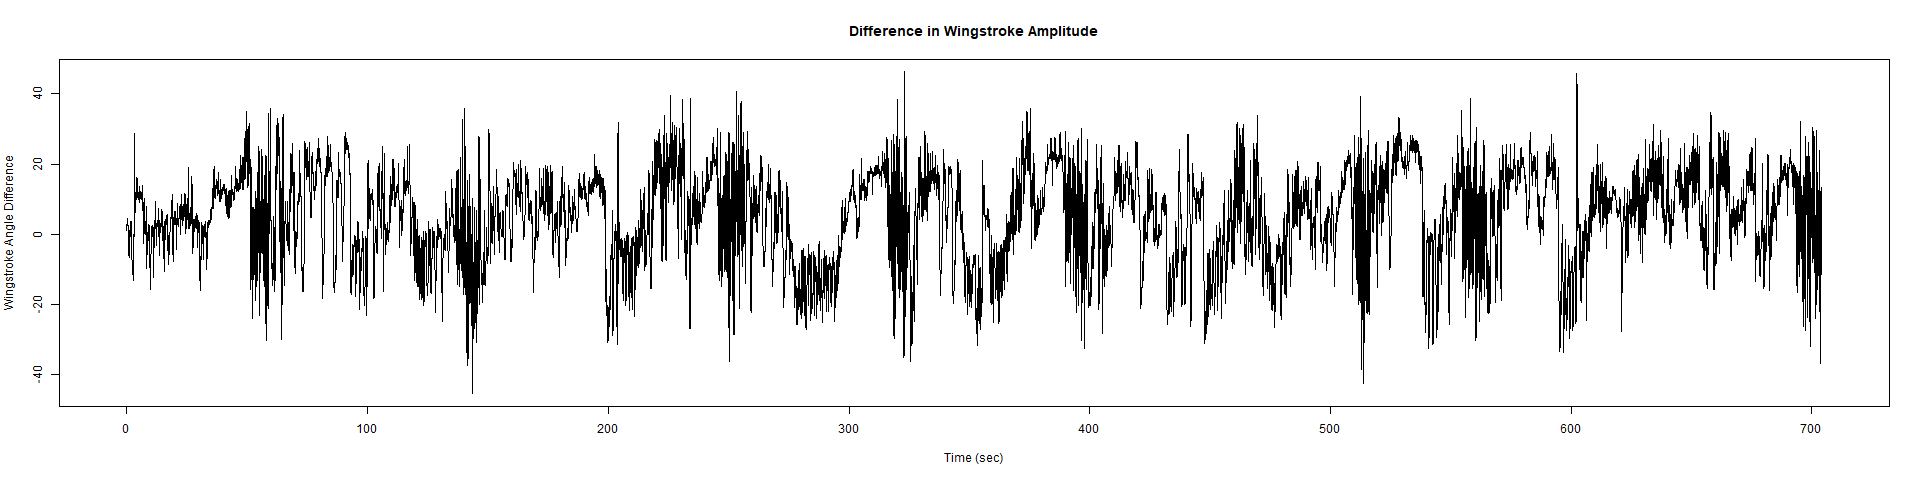
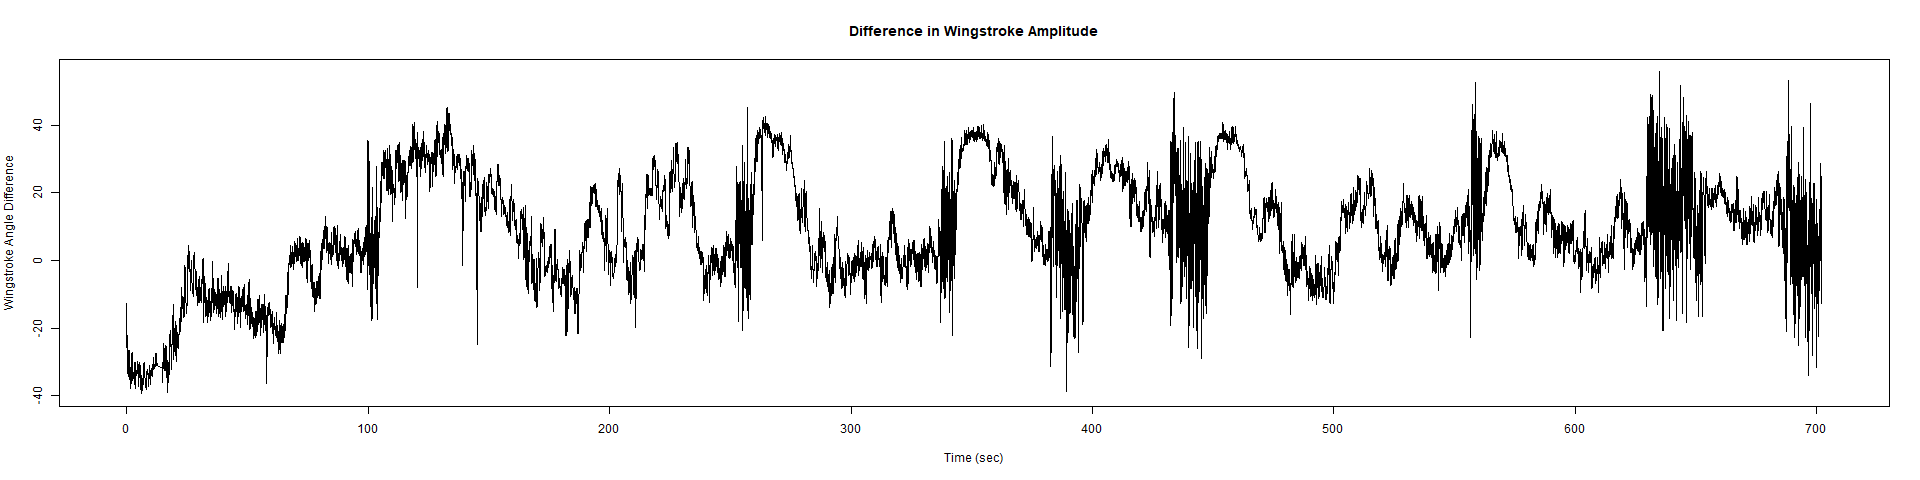
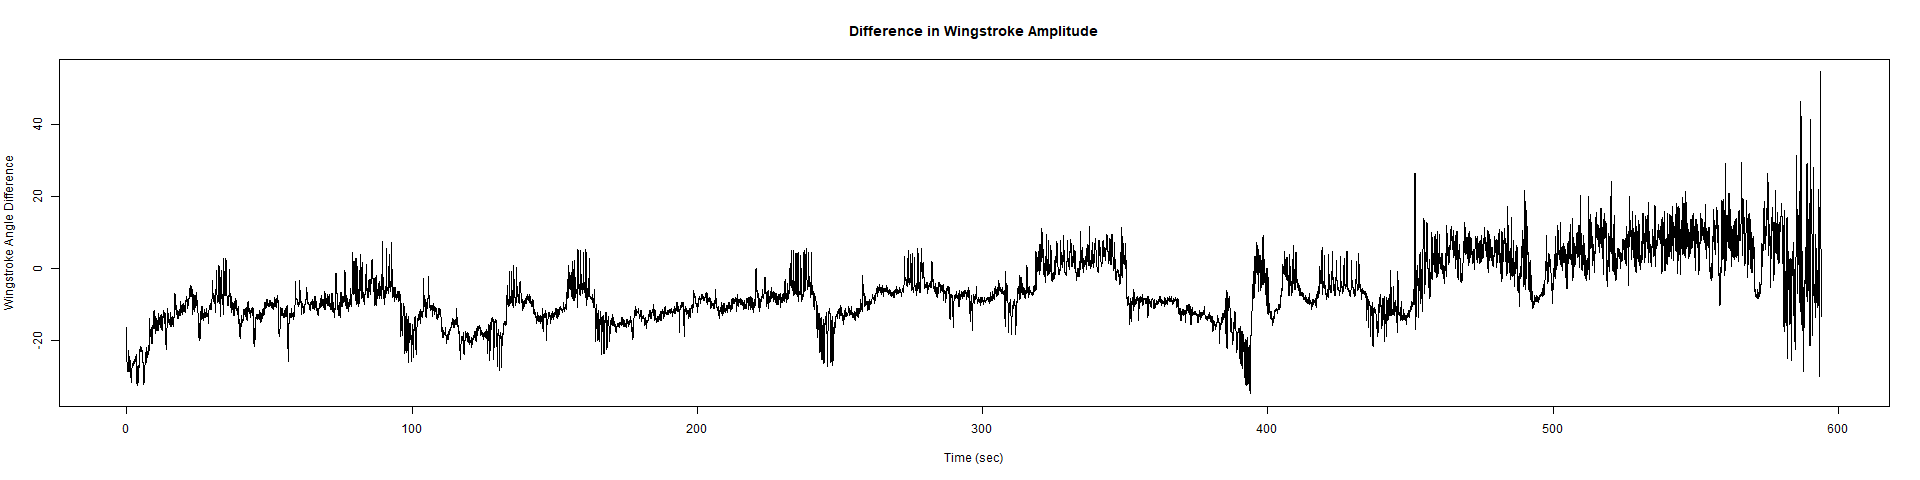
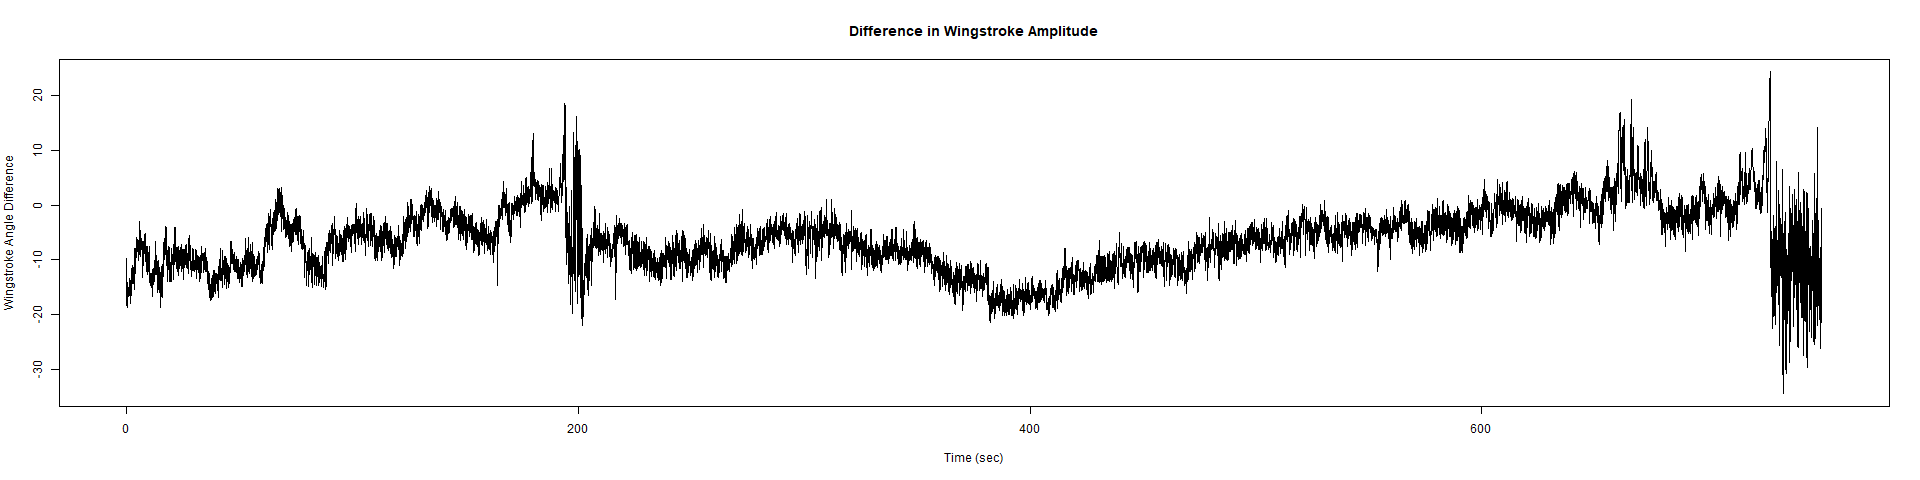
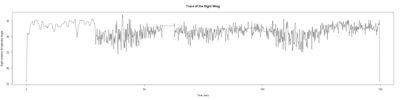
ElavGal4 x UASRyr65 “the wrong vials”
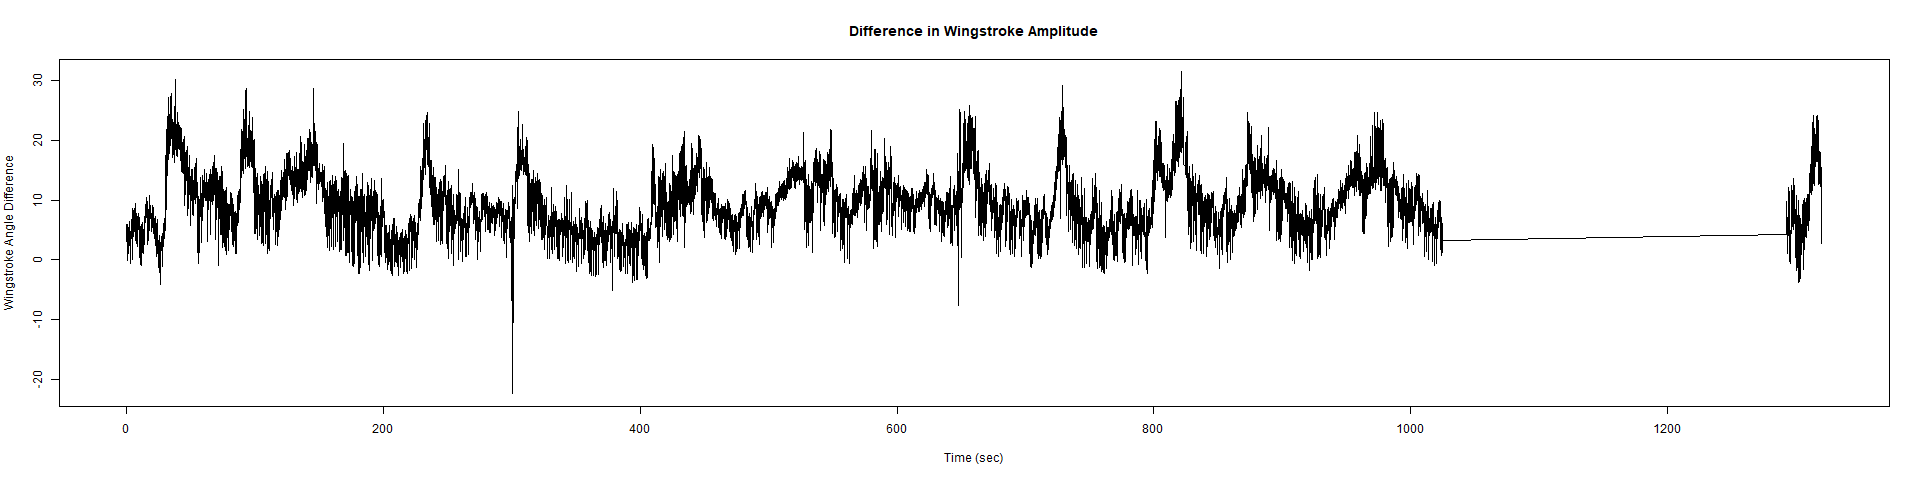
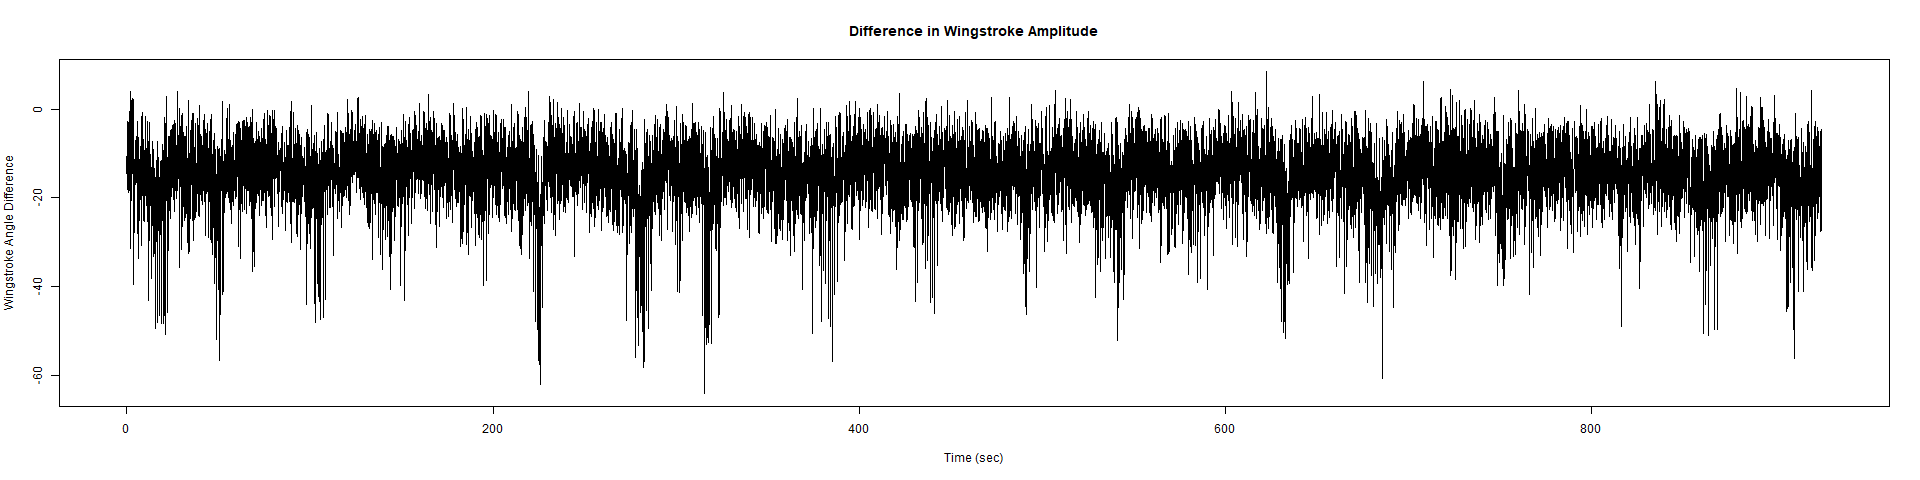
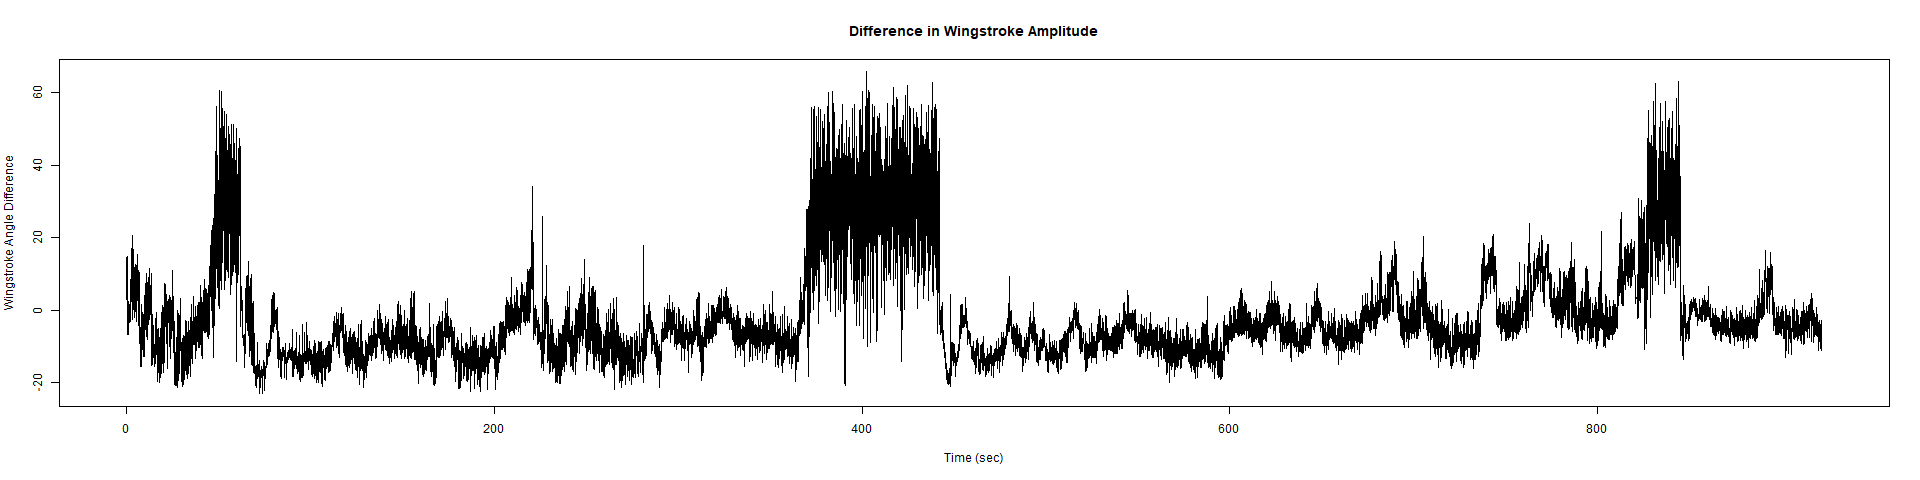
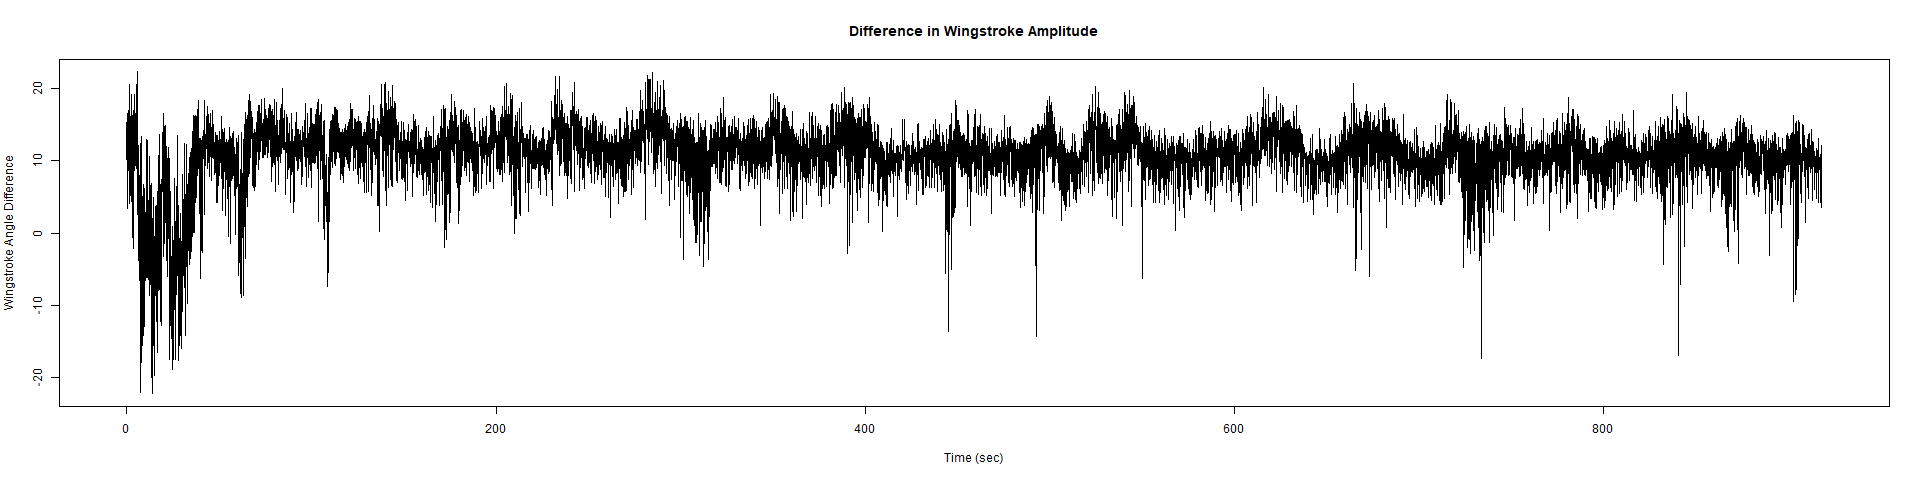
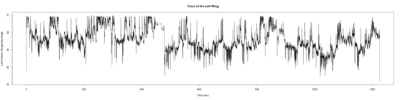
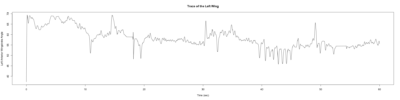
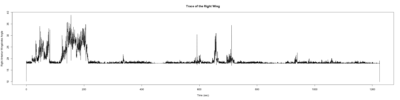
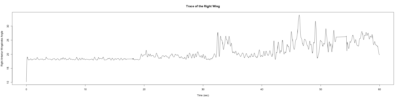
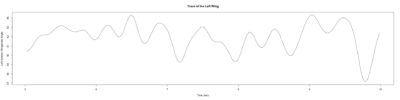
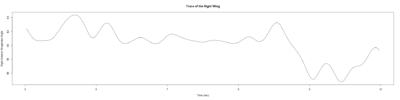
– > Graphs of the Trace.png (RightTrace – LeftTrace):

Category: Spontaneous Behavior, strokelitude, WingStroke | No Comments
Stroklitude Testing Pt. 2
on Monday, July 30th, 2018 1:52 | by Anokhi Kashiparekh
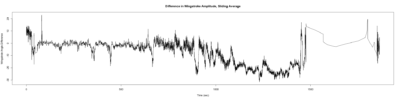
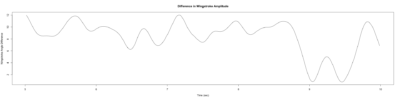
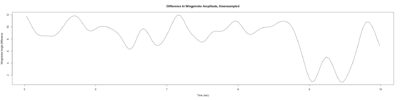
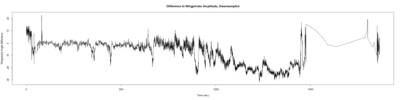
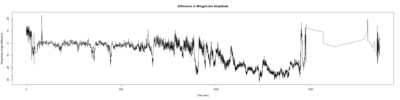
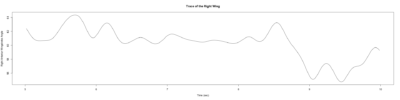

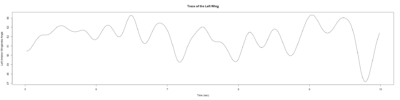
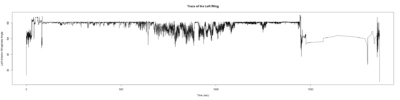
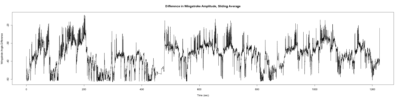
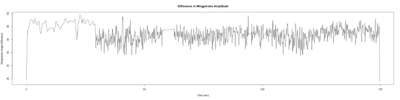
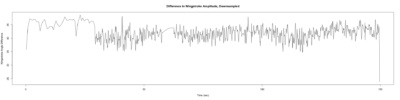
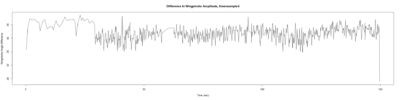
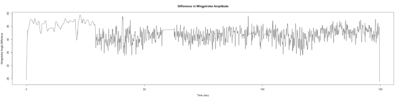
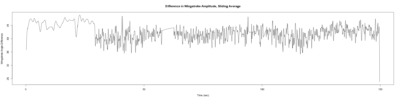
Monica:
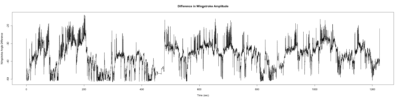
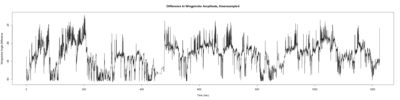
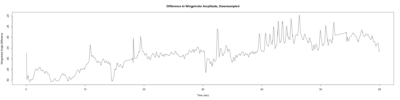
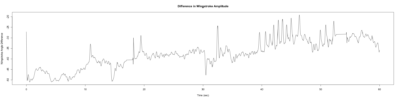
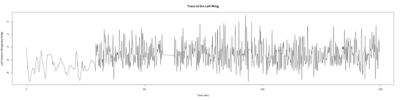
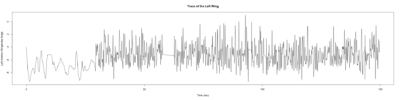
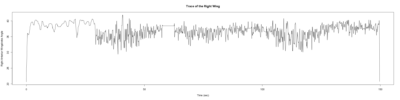
Anokhi:
Category: open science, Spontaneous Behavior, strokelitude, WingStroke | No Comments
Stroklitude Data
on Monday, July 23rd, 2018 1:55 | by Anokhi Kashiparekh
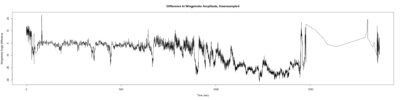
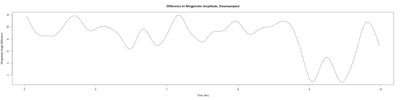
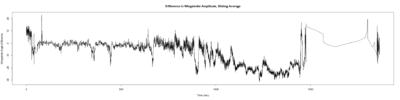
Category: lab.brembs.net, R code, Spontaneous Behavior, strokelitude, WingStroke | No Comments
Experiment Update
on Monday, July 16th, 2018 1:46 | by Anokhi Kashiparekh
IMG_2907 (1)
The text file looks something like this: Not very sure how to interpret it because there is no column header.
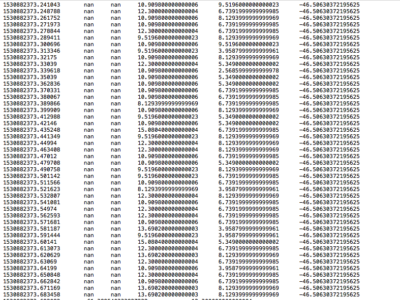
> Did not find any RU486 fly lines in the Brembs fly stock.
What is RU486 and why are we using it? It is a conditional transactivation method that gets activated when introduced with Mifepristone/RU486 and works on the UAS promoter (Roman et al, 2001).
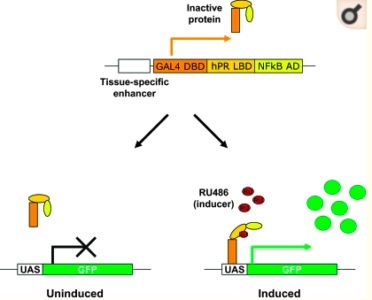
The genes we are knocking down:
1) SERCA gene
2) Ryr gene
Category: open science, Spontaneous Behavior | No Comments
Sathish scripts in my hands are reproducing results
on Friday, May 18th, 2018 3:34 | by Christian Rohrsen
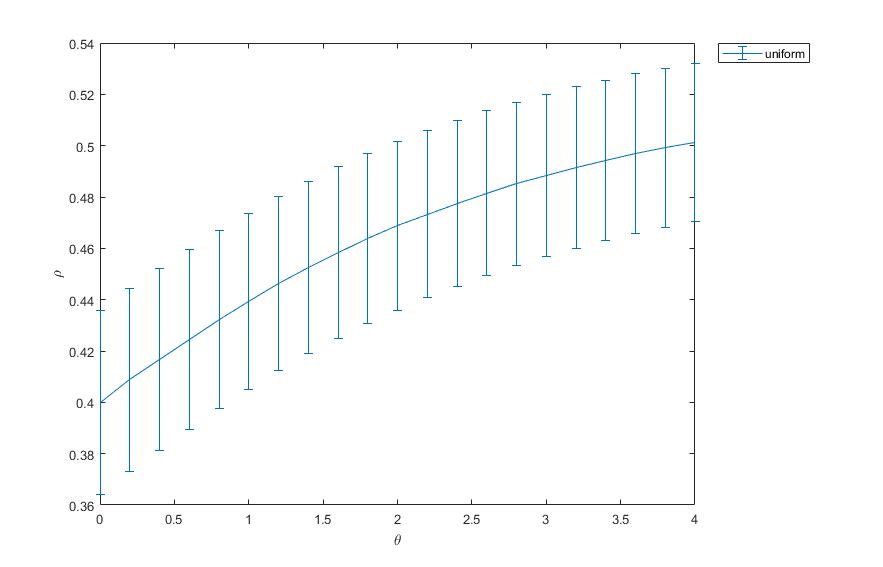
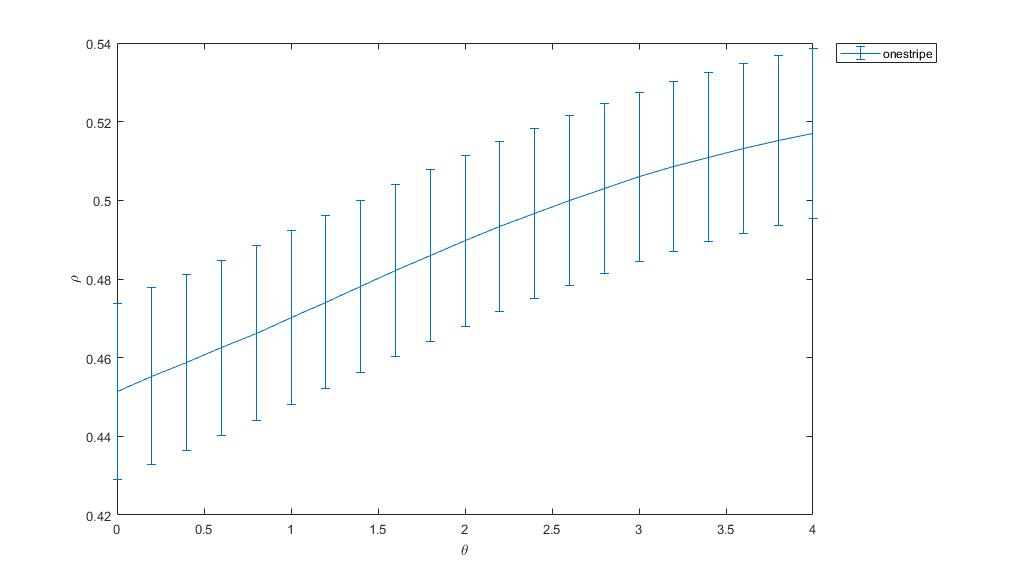
This is a picture of the supplemental figure from Maye et al. 2007
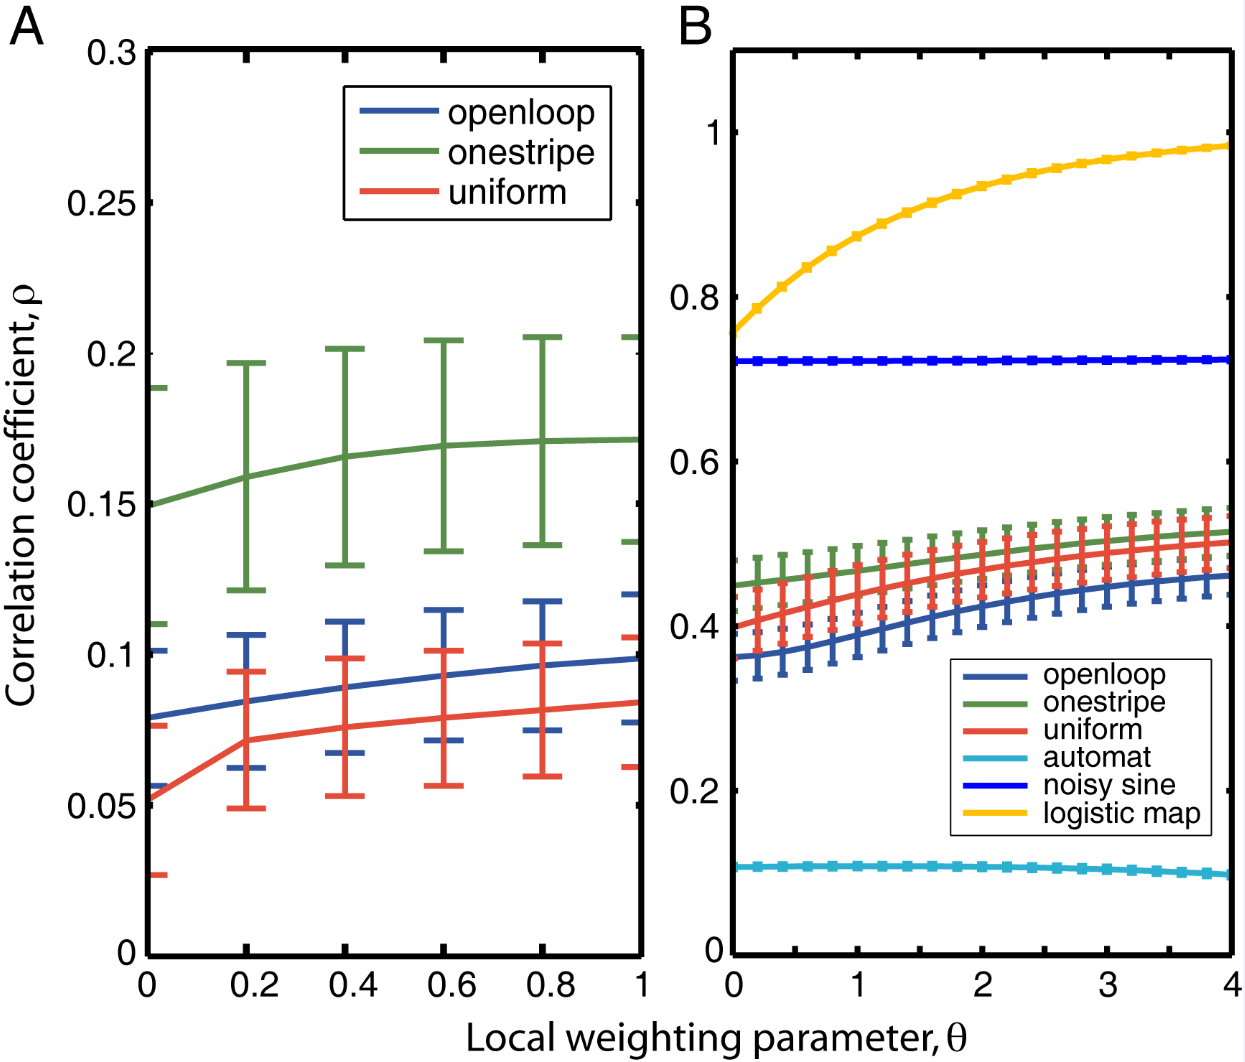
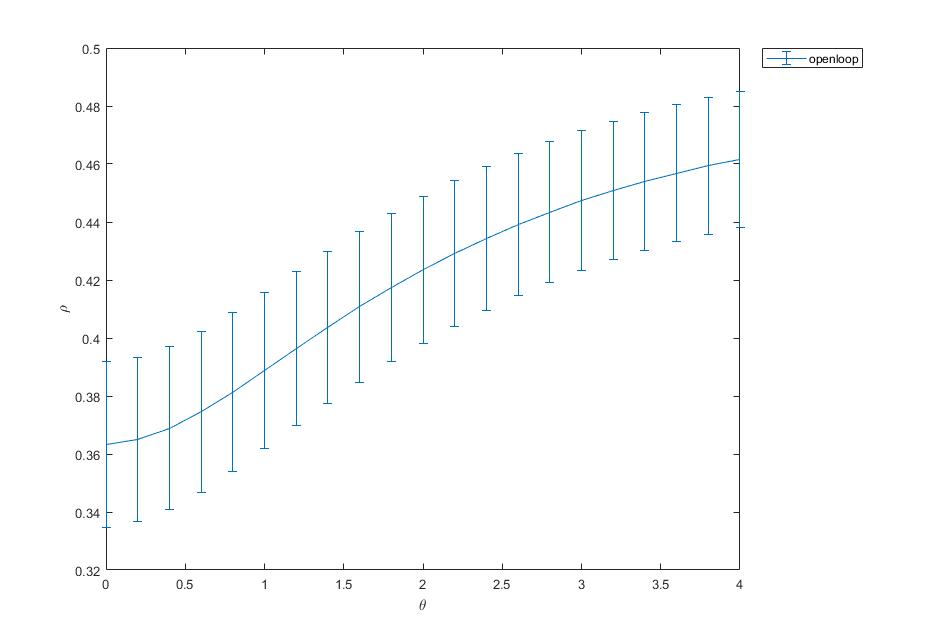
Below the results from the sathish scripts running on the data from Maye et al. 2007. It matches, so Sathish scripts in my hands work fine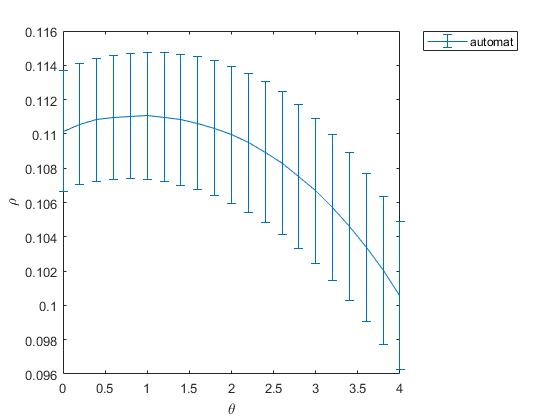
Category: flight, Spontaneous Behavior, strokelitude | No Comments
Confocal images and boxplots from my results in strokelitude
on Tuesday, May 15th, 2018 12:26 | by Christian Rohrsen
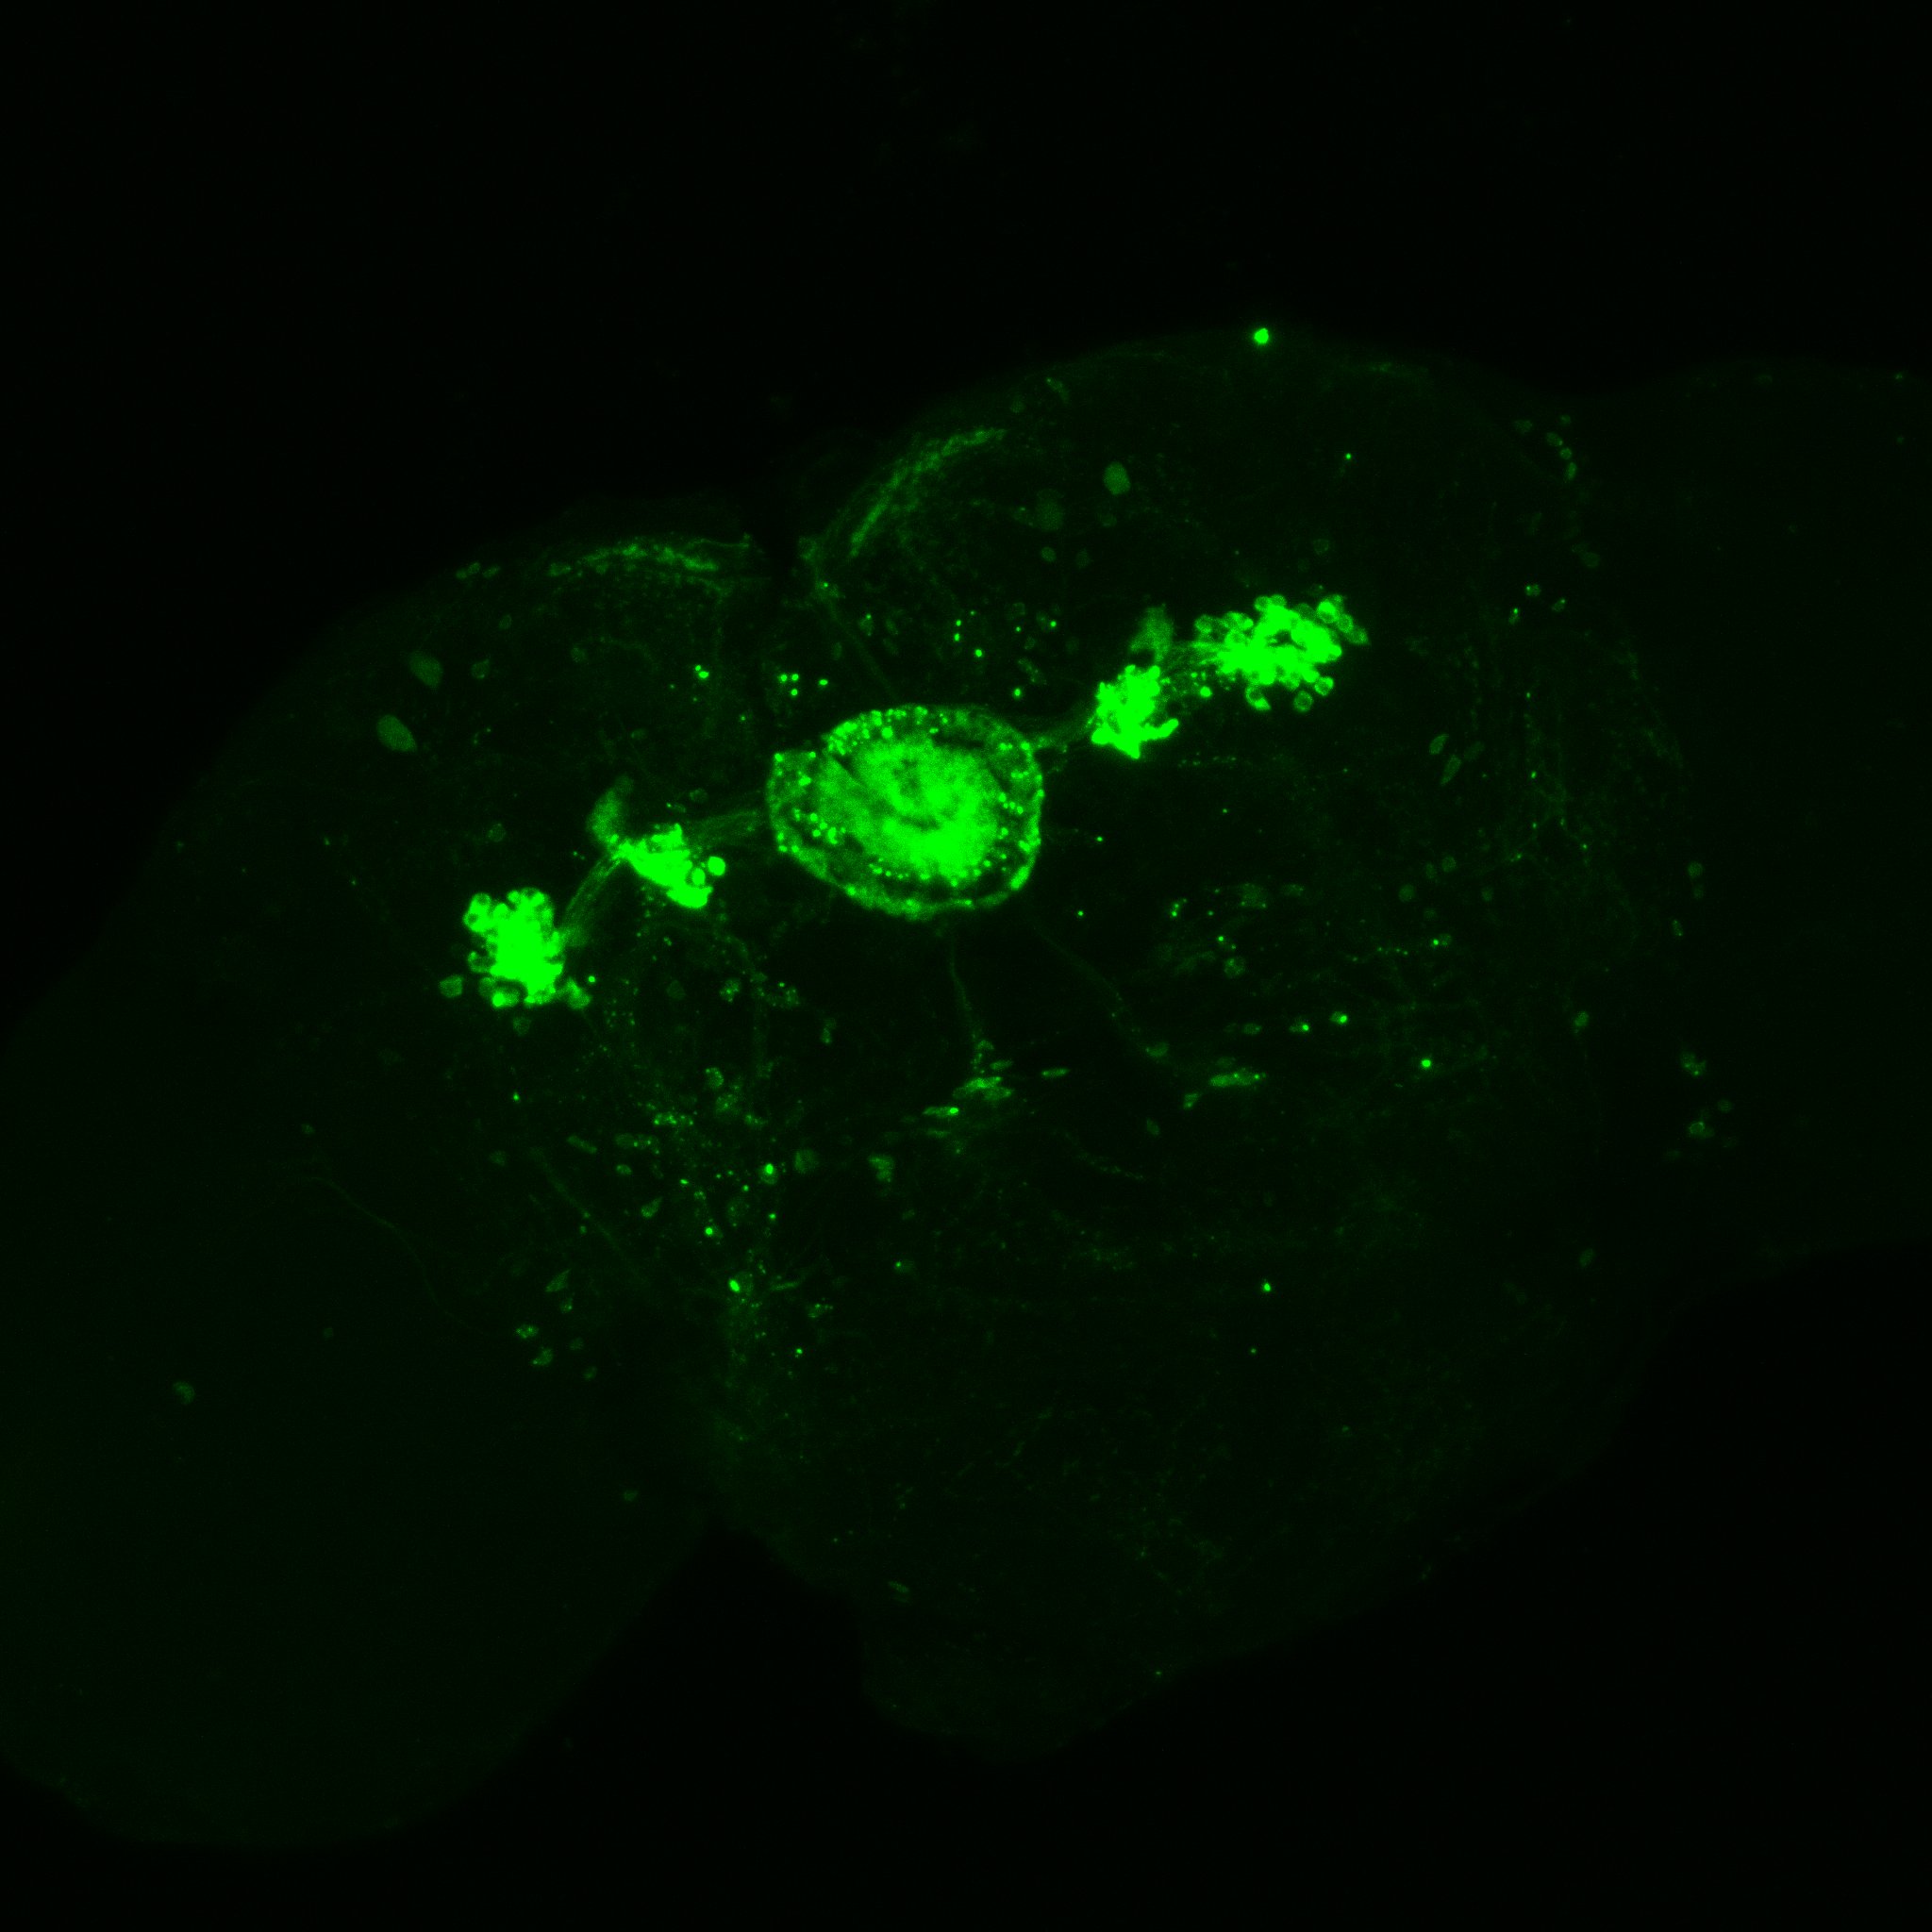
and at 40x
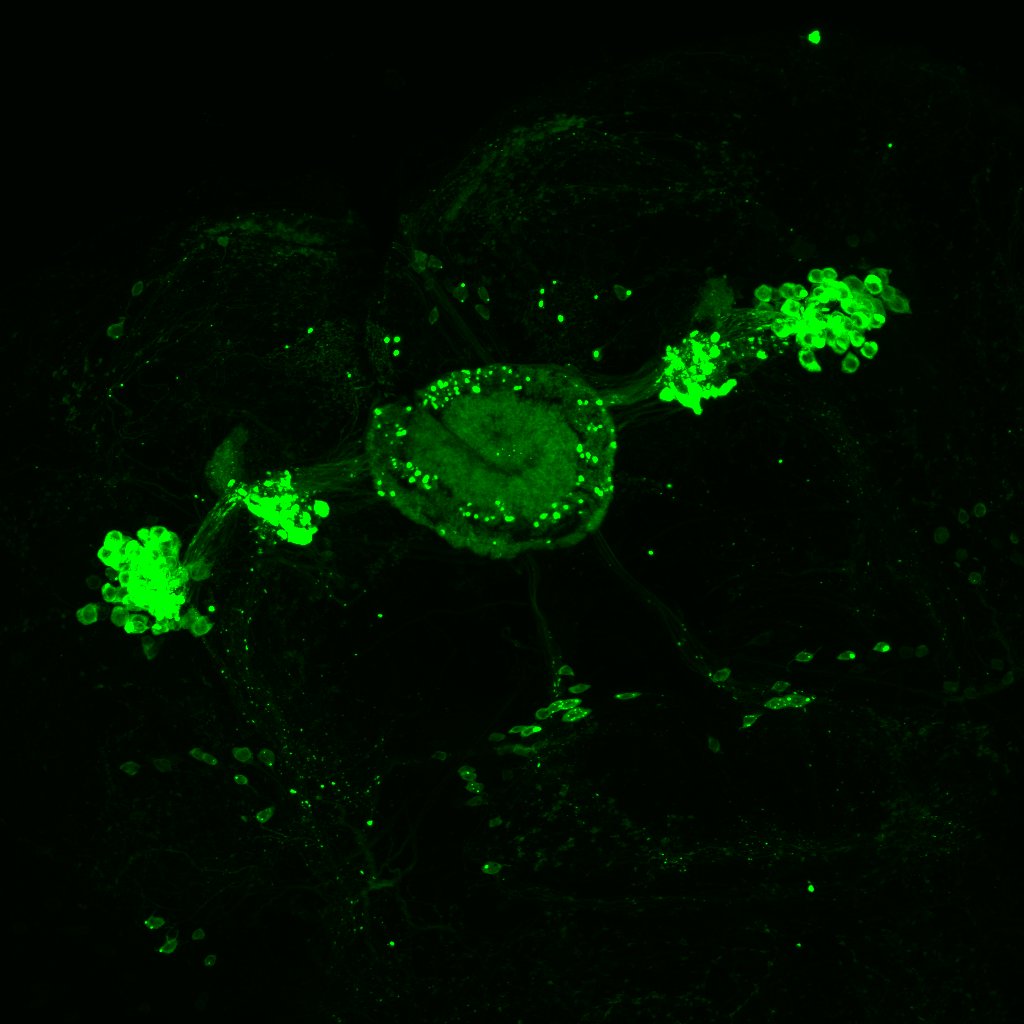
In this link we have a video of a 3D stainning pattern zoomed_CC
In addition I add here teh boxplots from the final results of the Ping Pong ball setup with these experiments 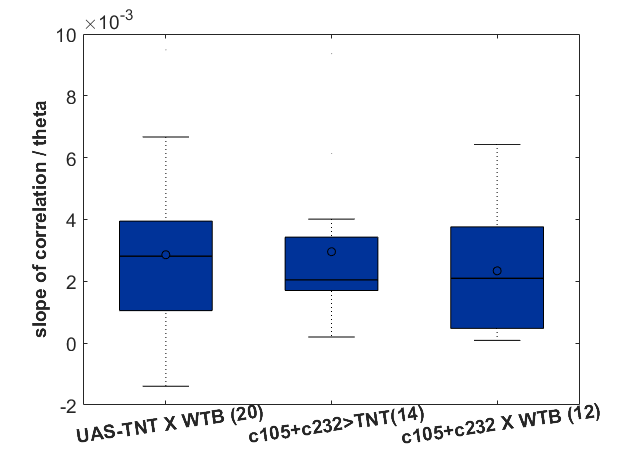
Category: Anatomy, flight, Spontaneous Behavior, strokelitude, WingStroke | No Comments
Stainning c105;;c232
on Monday, May 14th, 2018 11:22 | by Christian Rohrsen
The first figure shows each of the central complex ring neurons types (Martín Pena et al., 2014). The c105-G4 targets the R1 neurons and the c232-G4 targets the R2 and the R4d neurons
This is the c105-G4 stainning from Martín Pena et al., 2014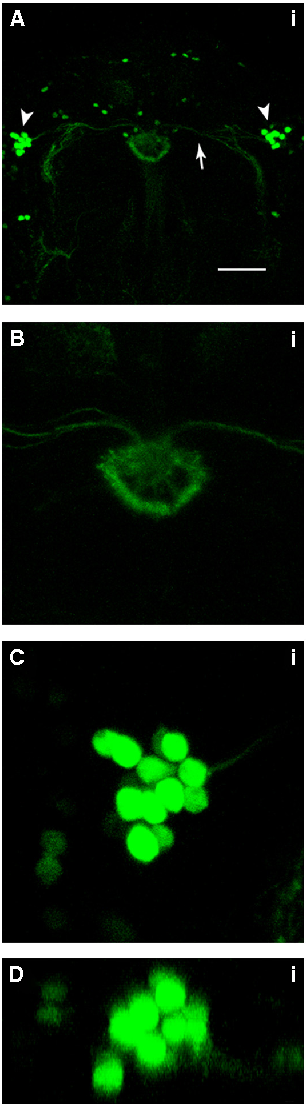
232-G4 stainning from Kahsai et al., 2012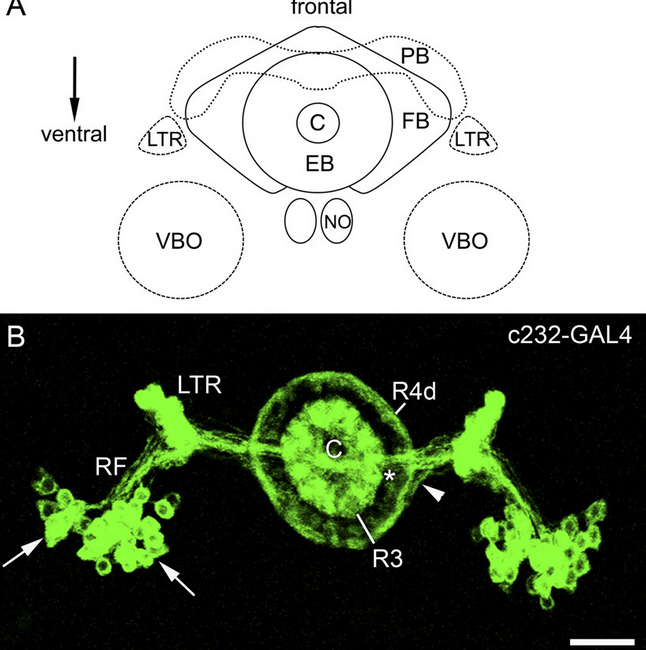
Axel stainning from c232-G4 alone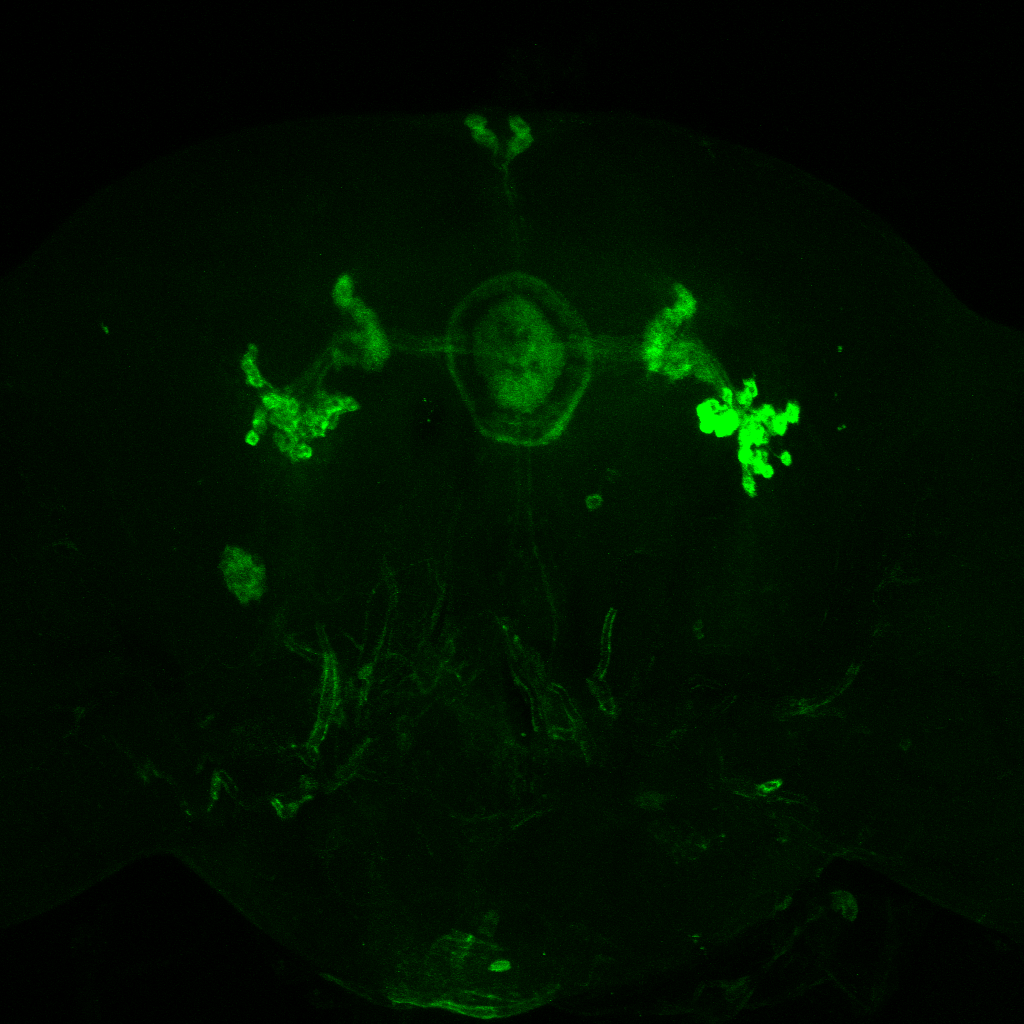
Axel stainning from c105-G4 alone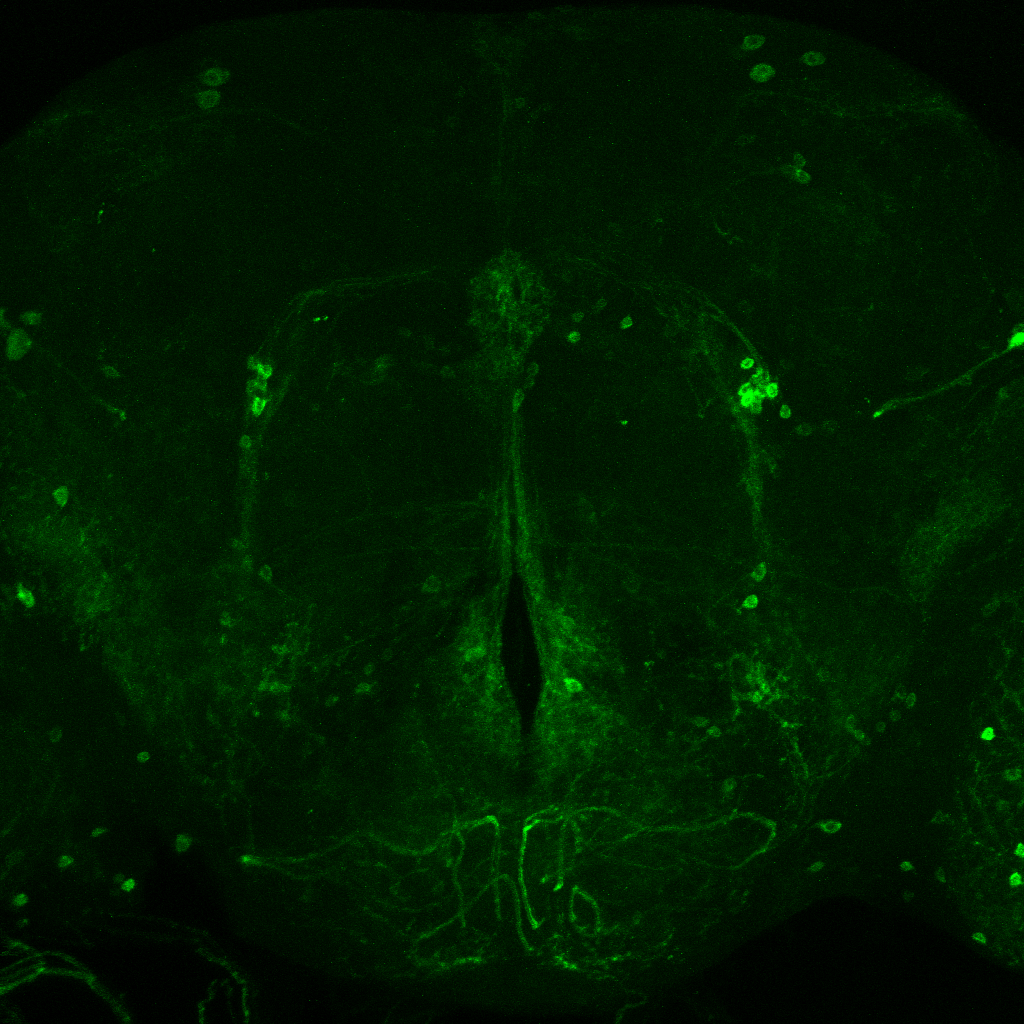
Axel stainning from both drivers together. I would say it really contains both driver lines.
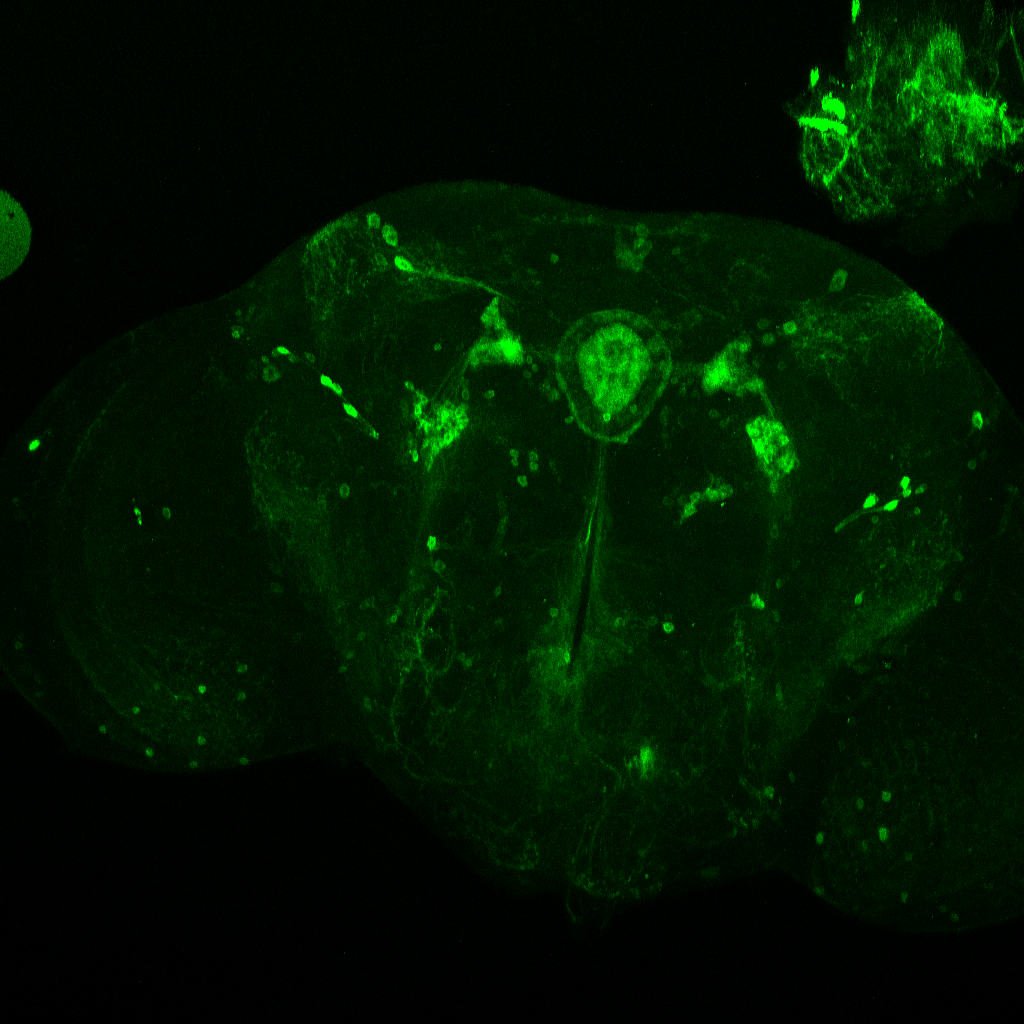
This are both driver lines together as well from Axel. To me it seems that only c105 is present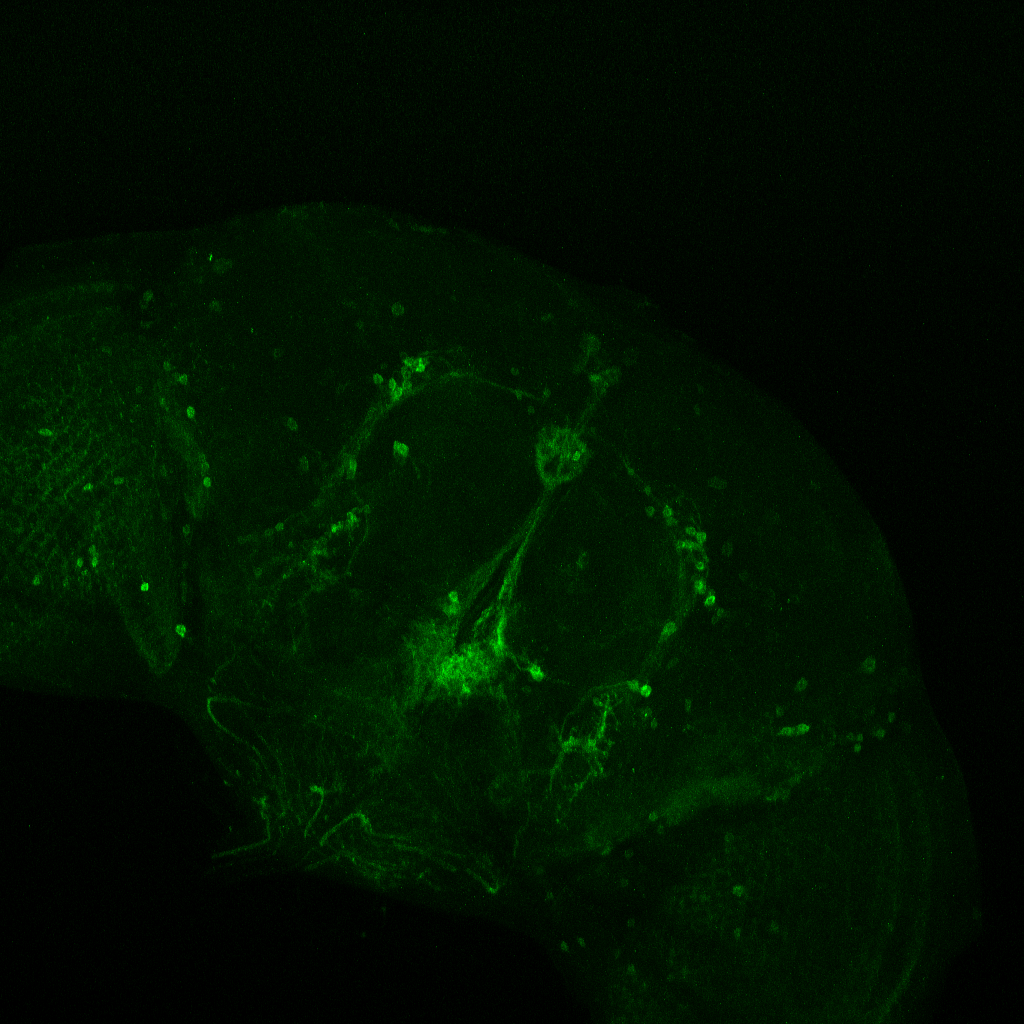
This are my stainnings at the fluorescence microscope (no confocal). This is to show that in all of the 10-12 brains I have looked at, they all had the c232 pattern present
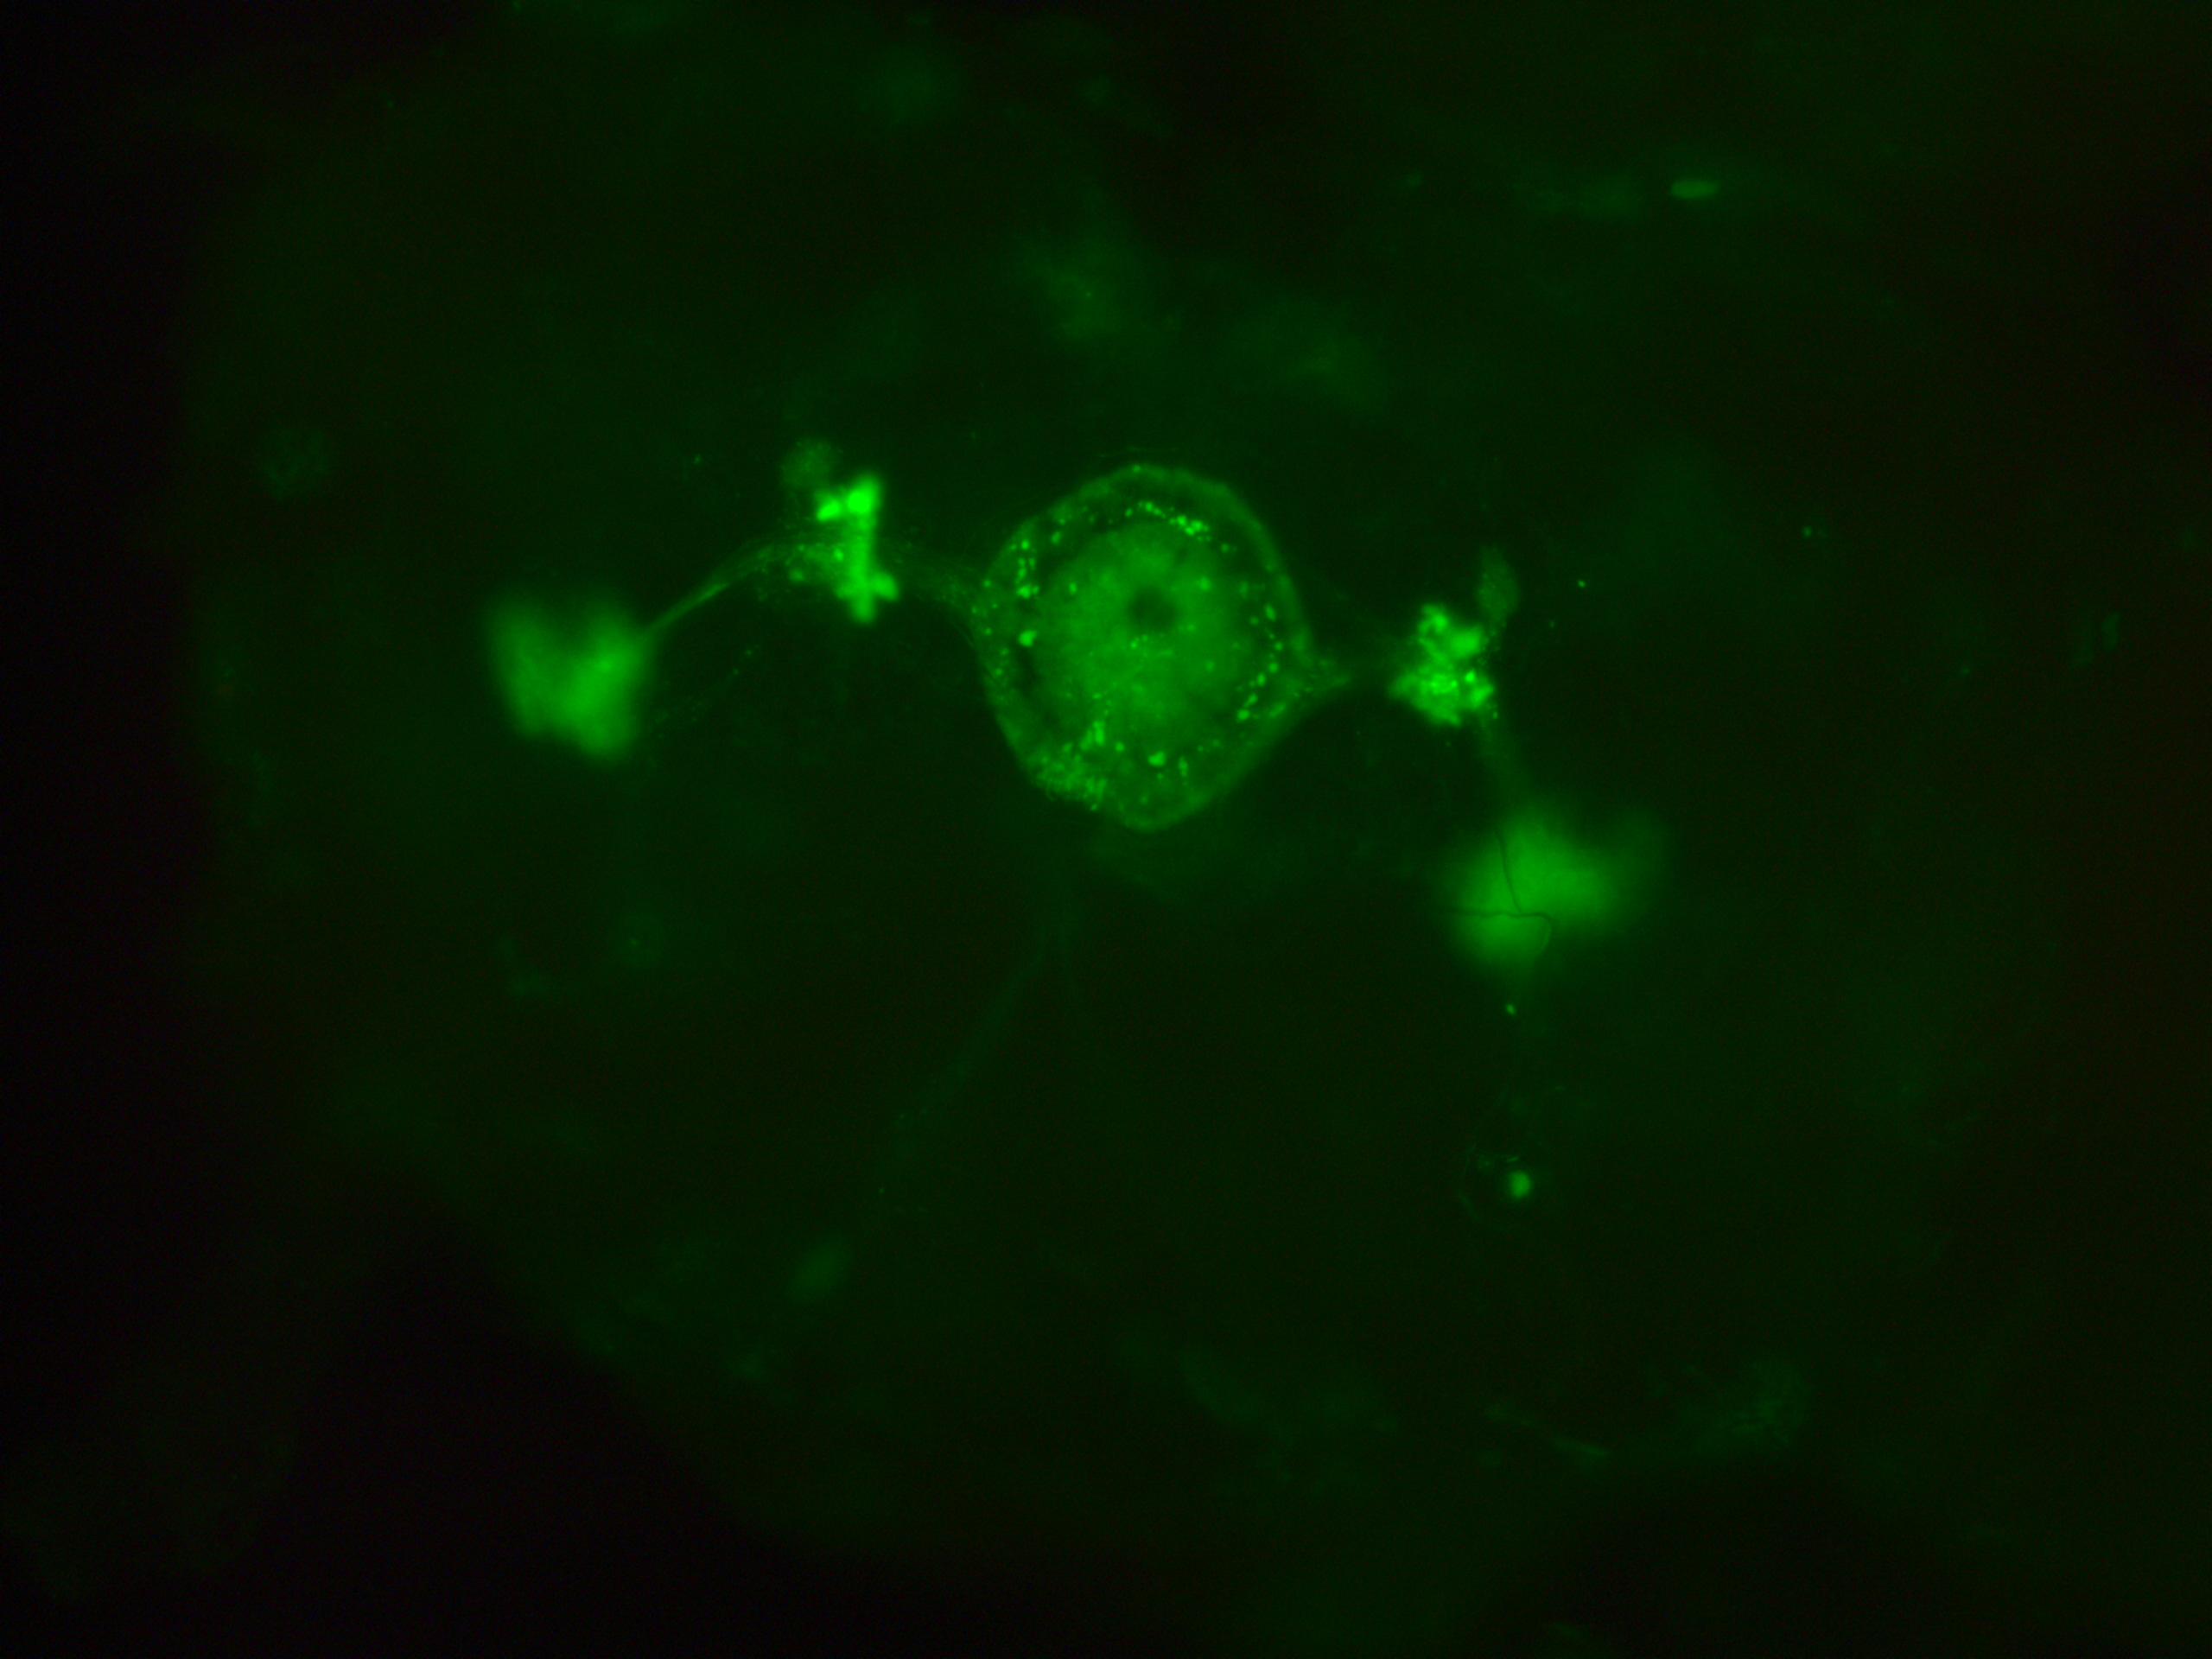
In addition, they had many more neurons outside from the central complex which I believe belong to the c105-G4 line. This is my only proof to show that c105 is also present, since the R1 neurons seem to be hidden when R2 neurons are stained.
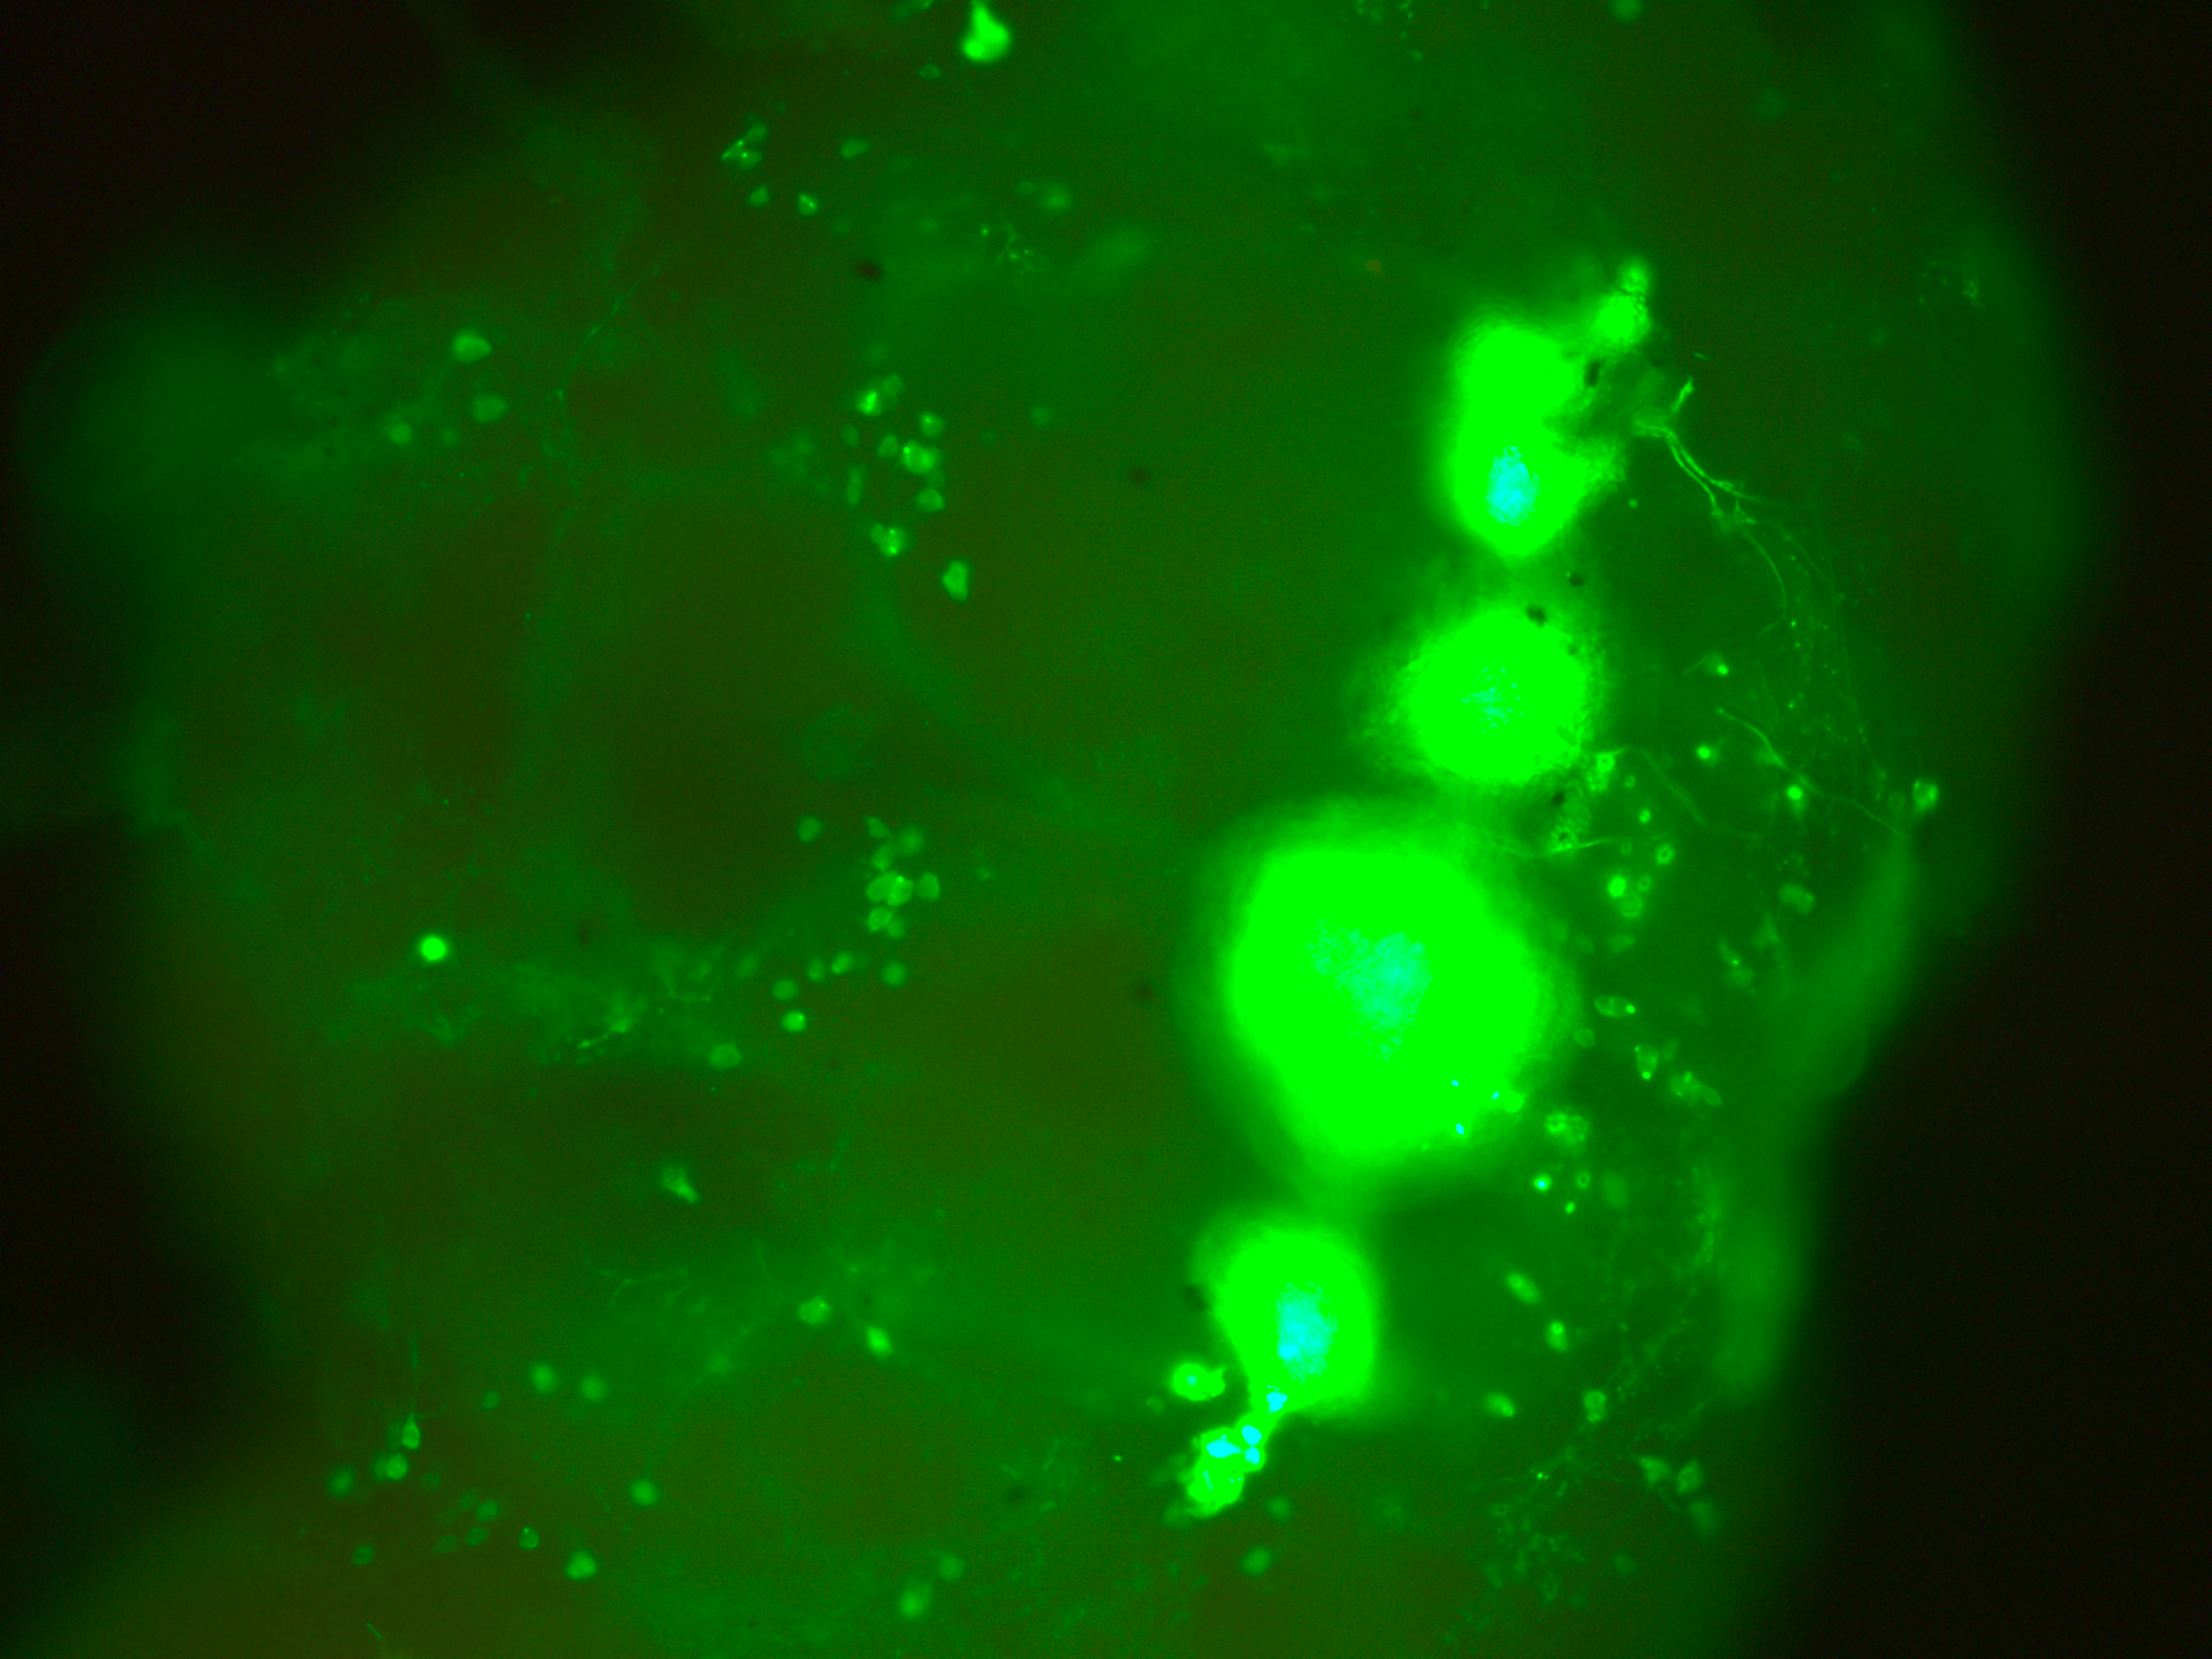
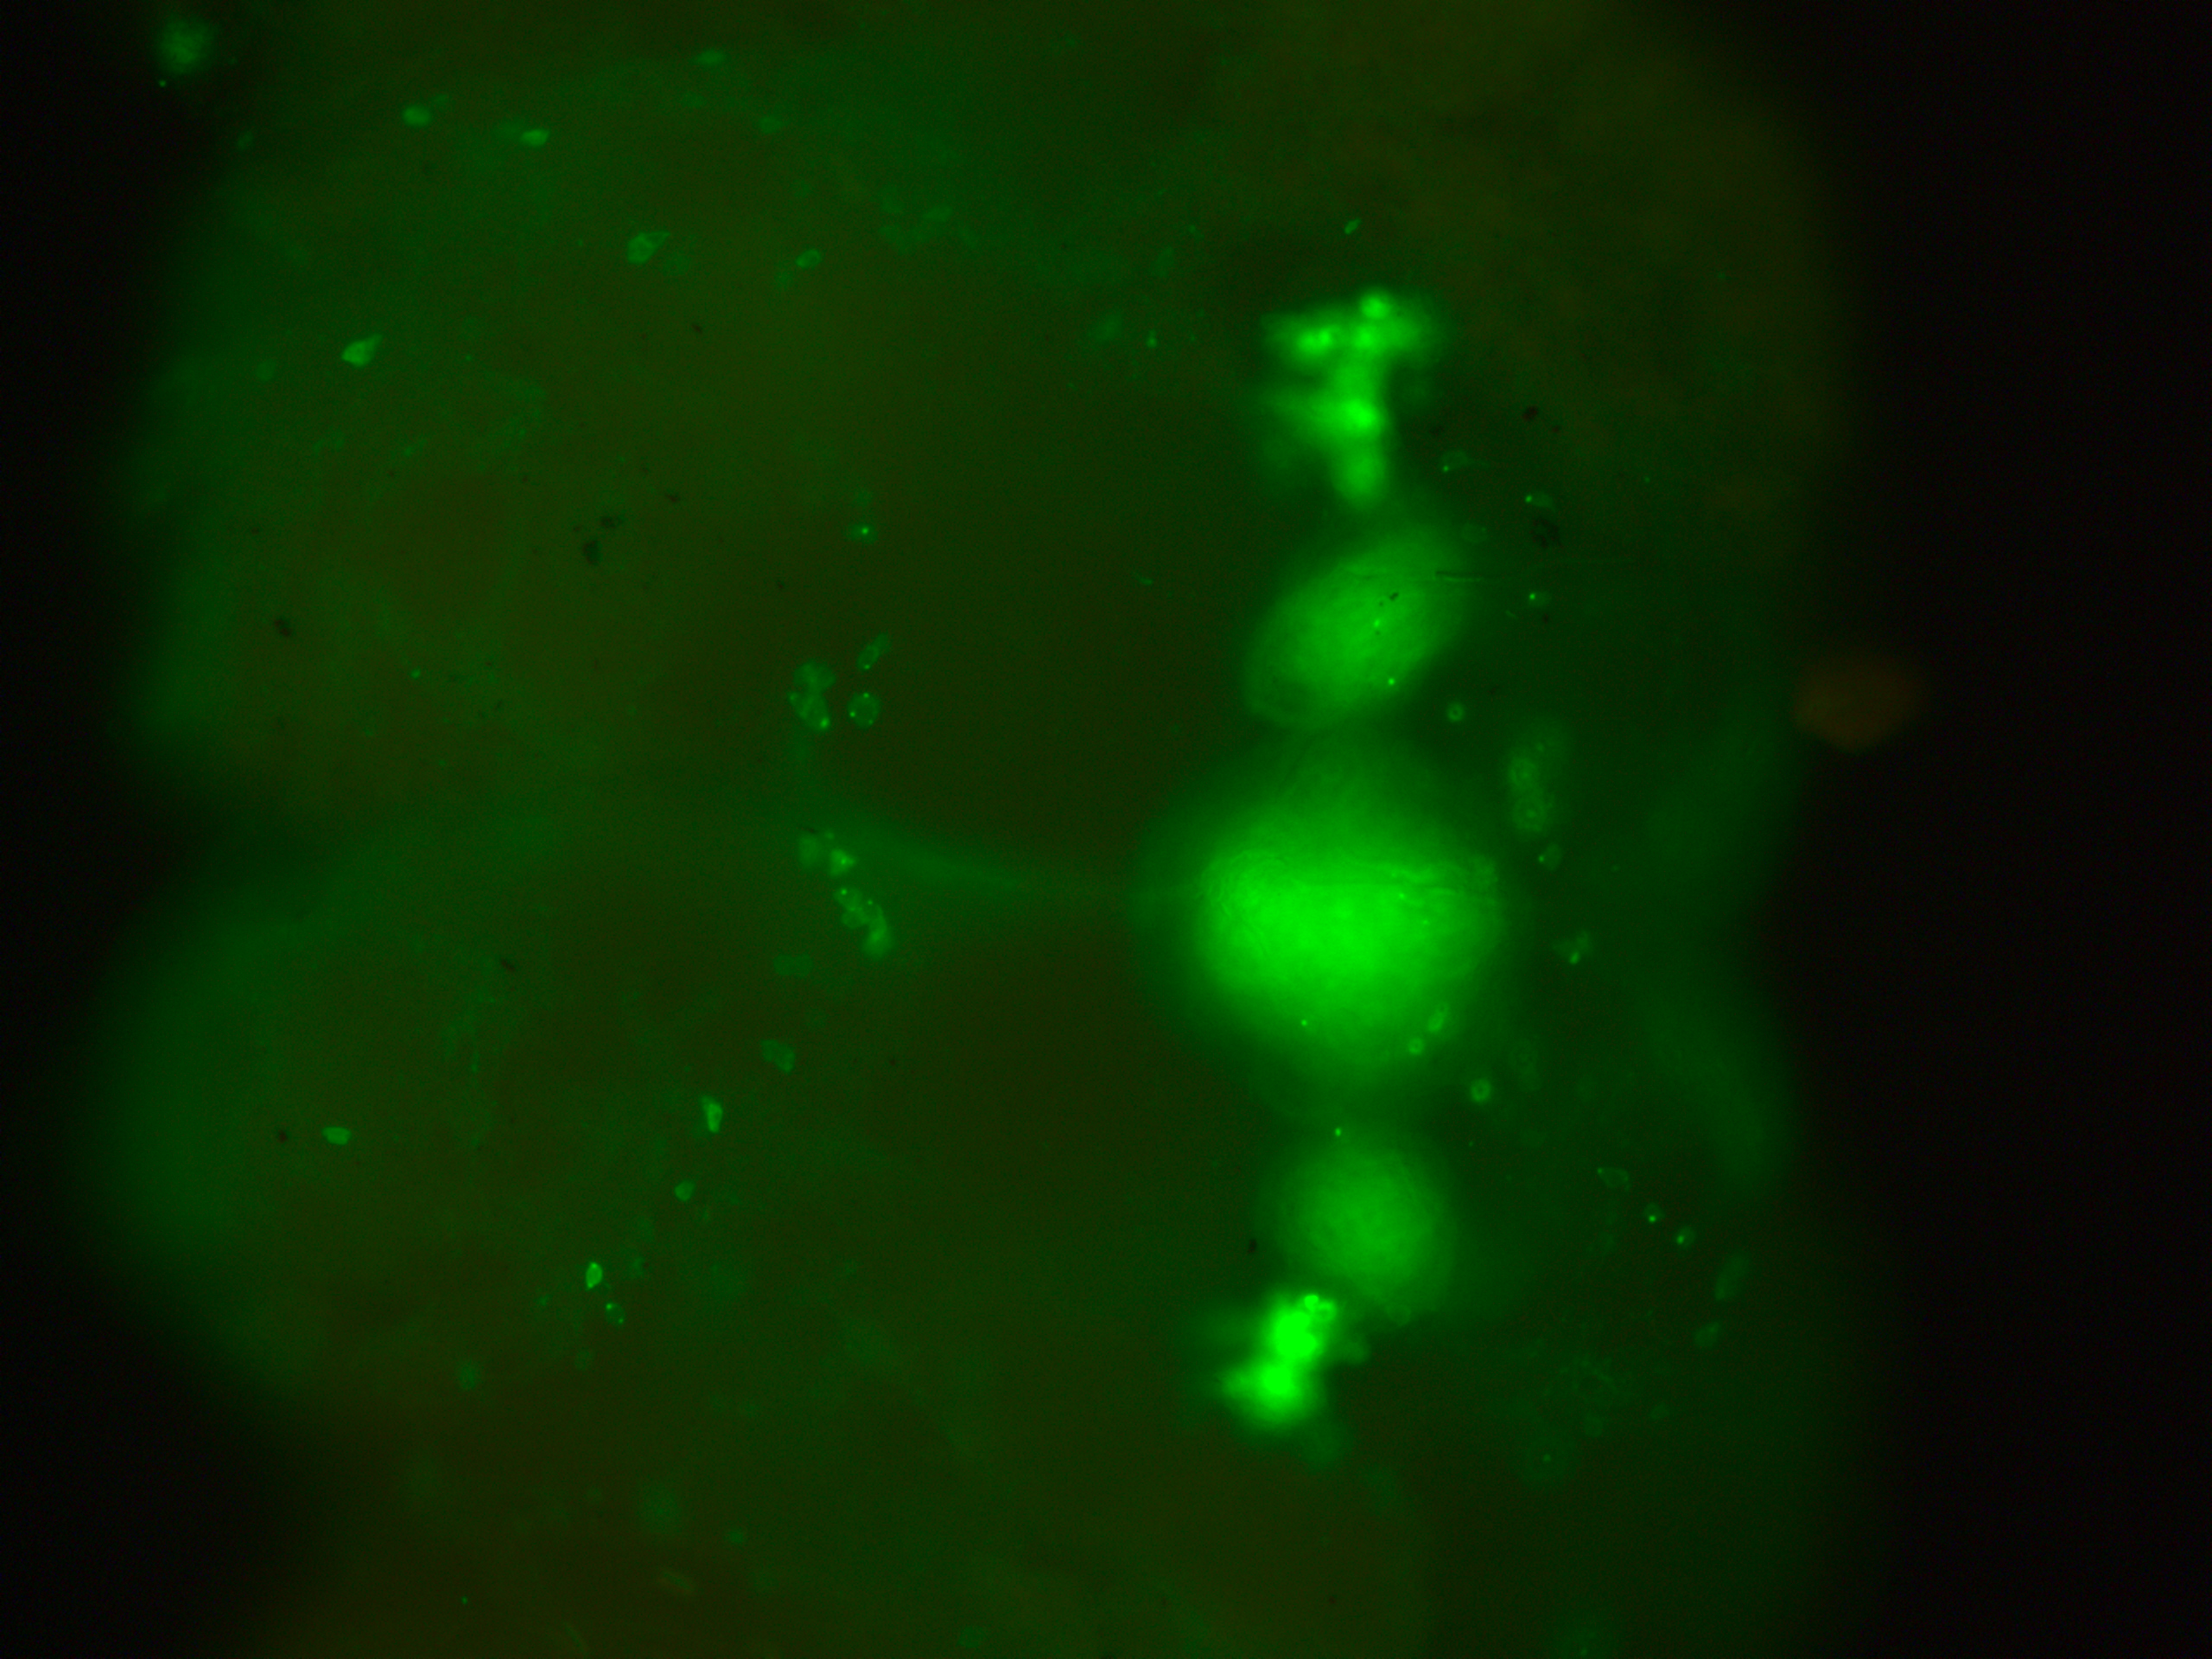

I was also looking to the youtube video you have online, Björn. To me it seems I can only see the R1 ring neuron from the c105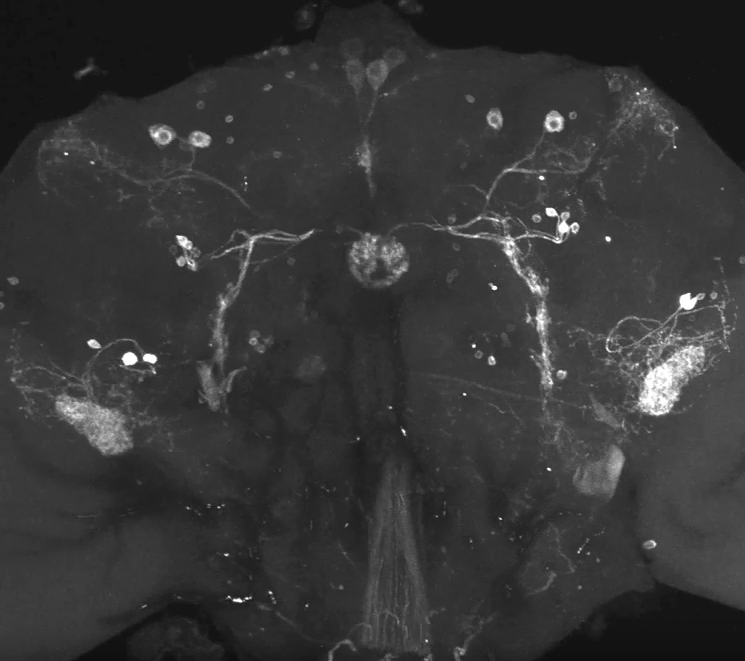
Category: Anatomy, flight, Spontaneous Behavior | No Comments
Nonlinearity is present the fast timescales
on Wednesday, April 4th, 2018 3:38 | by Christian Rohrsen
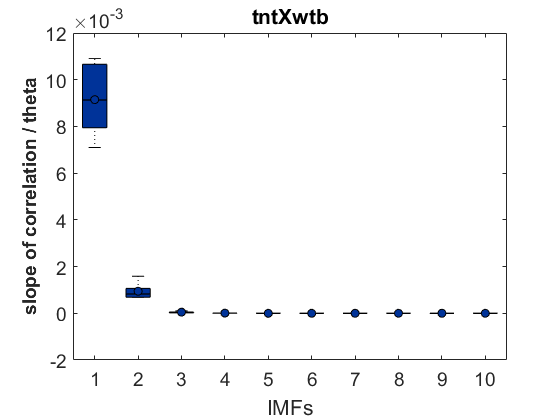
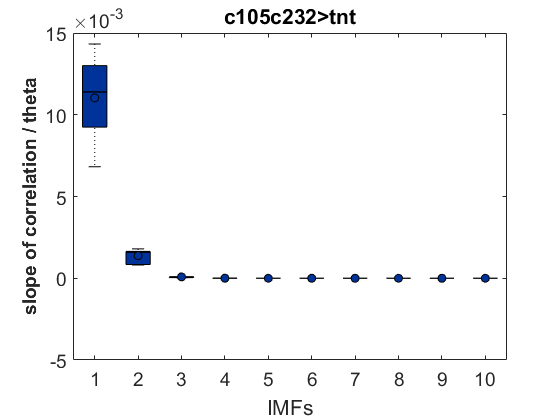
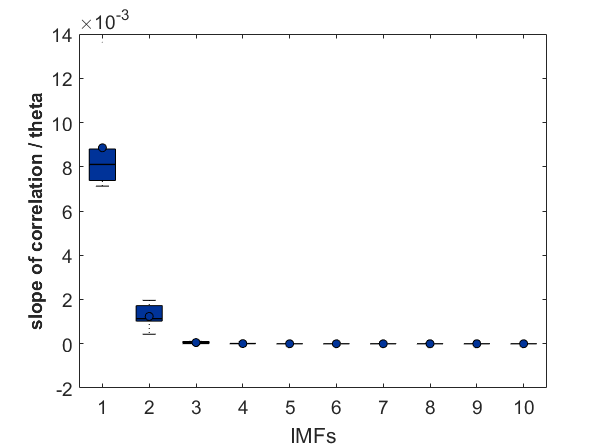
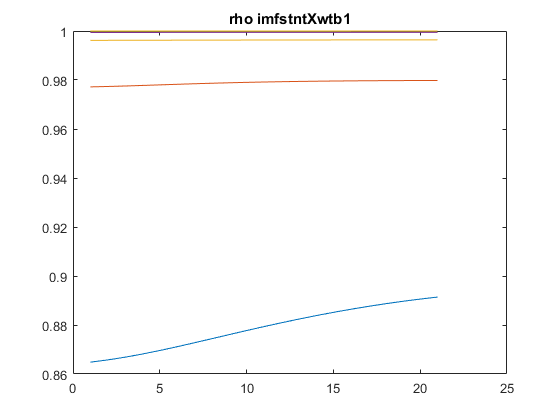
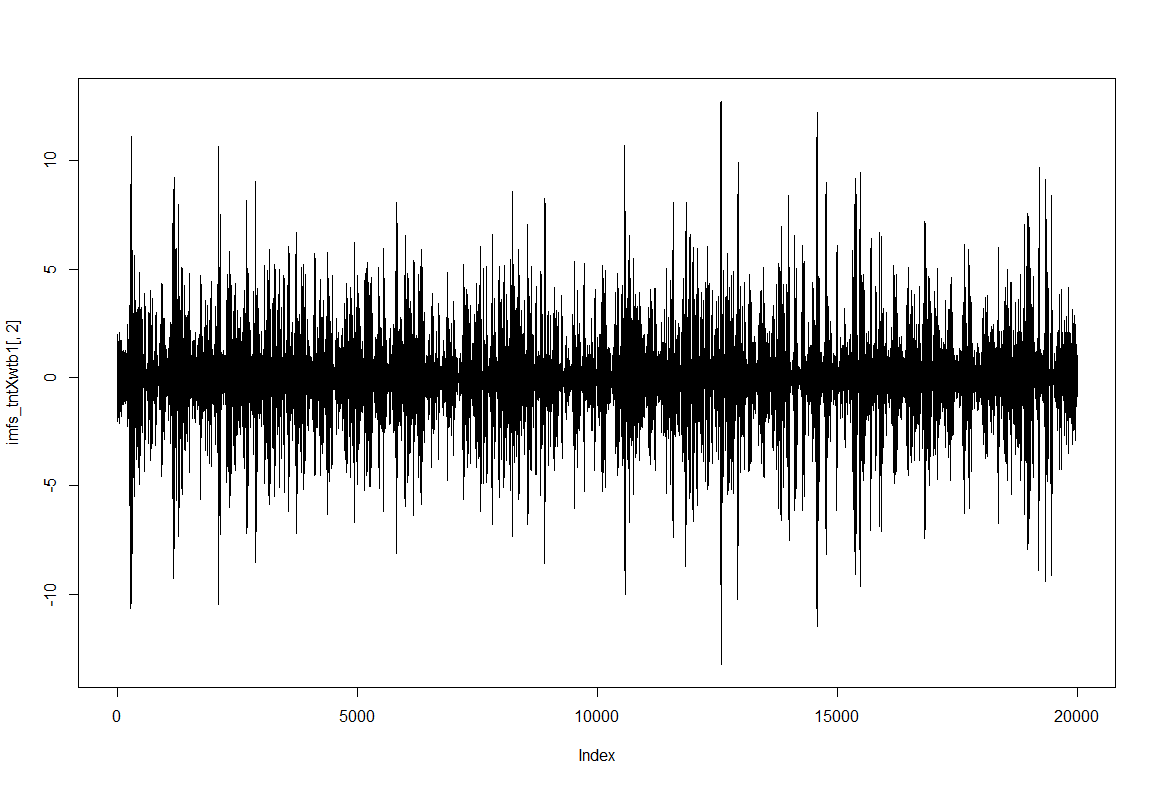
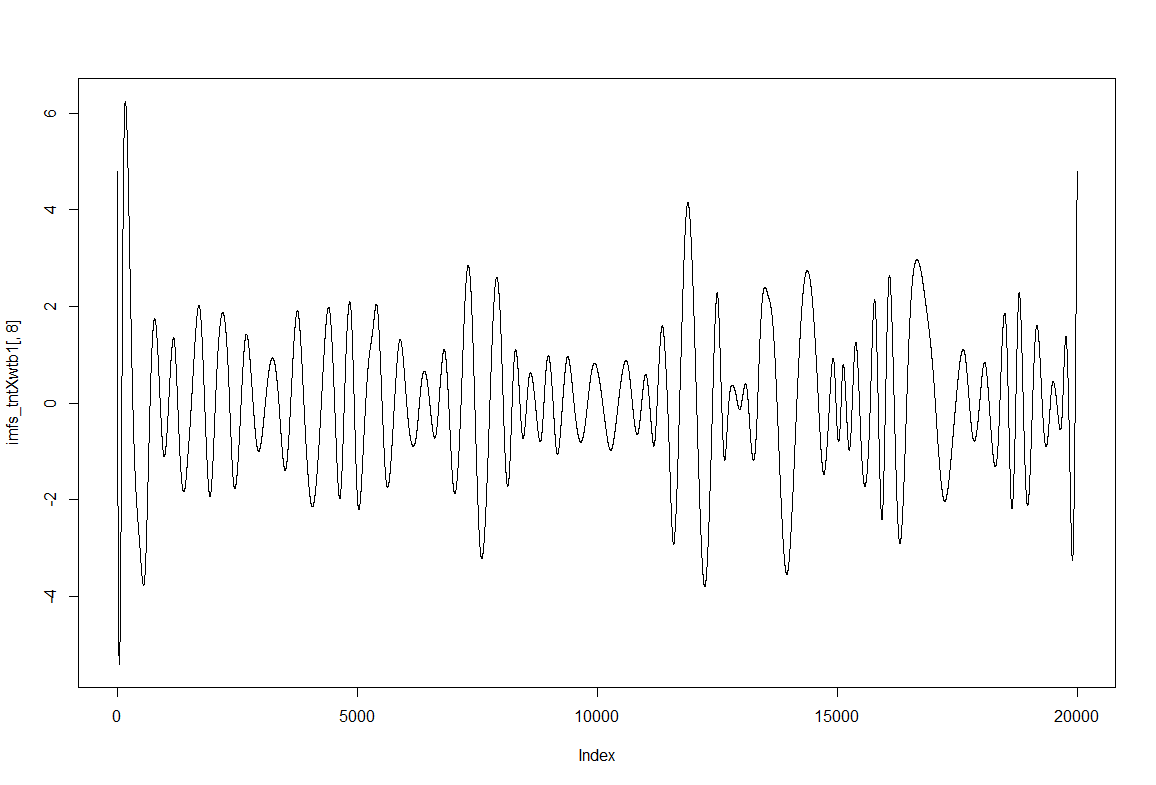
As a groundtruth I have used the same analysis pipeline for the traces in the uniform arena from Maye et al. 2007. Here the effect is even more pronounced at the fastest time scales. So I will conclude that this is real fly behavior and not noise that is shared among both setups: the Ping pong ball machine and the torquemeter. In order to gain more insights into the underlying flight structure I took one random flight trace to explain a few observations. The x-axis is the theta (that actually goes from 0-4 in steps of 0.2 and therefore we see the 21 points), in the y-axis is the correlation of the prediction to groundtruth. We see that IMF has a bigger slope, but not only that, also that its prediction correlation is around 0.88, whereas lower timescales prediction is basically perfect. That is, fast time scales are not only more nonlinear but also less unpredictable. This pattern is repeated in every fly measured
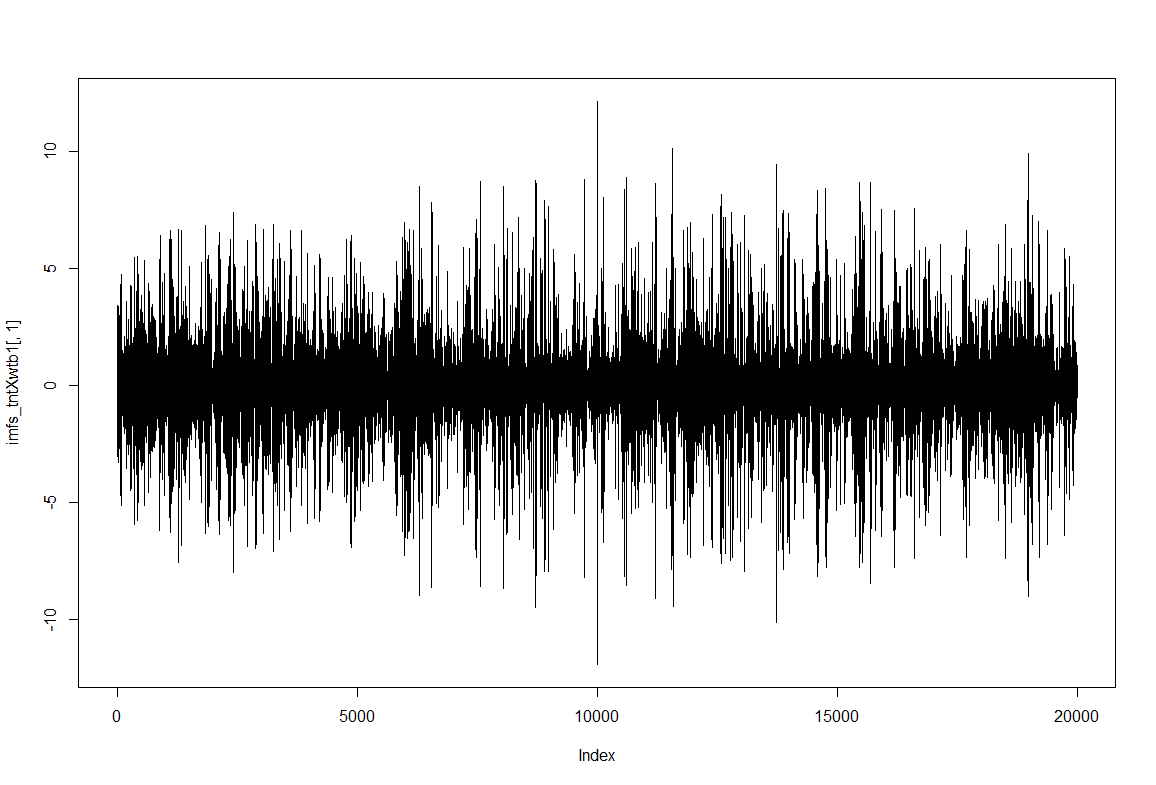
 To have an impression of how these IMF resultant traces look like: IMF1, IMF2 and IMF8
Category: Spontaneous Behavior, strokelitude, WingStroke | No Comments
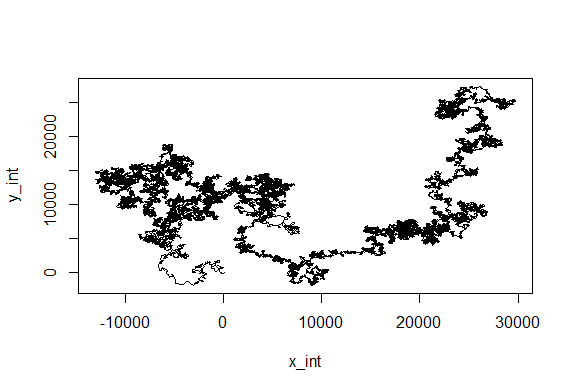
Just creating cartesian traces from polar coordinates
on Tuesday, March 27th, 2018 5:10 | by Christian Rohrsen
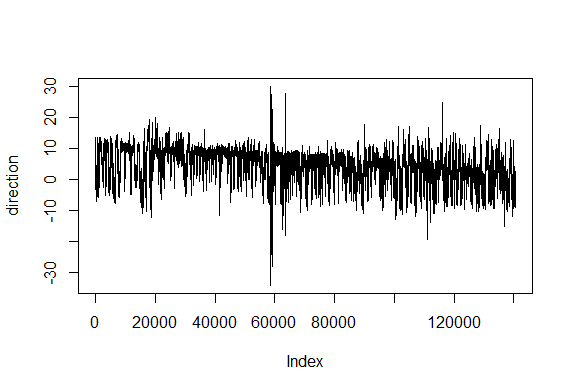
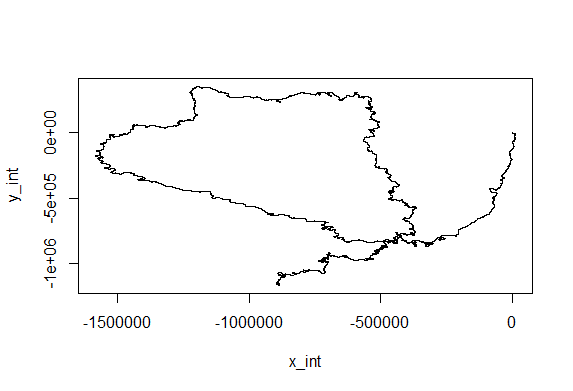
This is for the sake of playing and curiosity. I made out of these two traces a modelling of their flying trace in a 2D world. Direction is right wing amplitude – left wing amplitude and distance flown is dependent on the sum of both (more amplitude of both, more forward thrust). Funny enough, the second one looks kind of fractal, which is characteristic of chaotic behaviors. If there is any comment to add to this new visualization, all ears!
Category: Spontaneous Behavior, strokelitude, WingStroke | No Comments