Results for Dop1R1-RNAi, Amon-RNAi and the course data
Firstly, I did an experiment where Dop1R1 was knocked down via RNAi. The following shows the results:

For the next experiment, the controls groups were the same, however in the experimental group Amon was down regulated. These are the results:

Lastly, in the course the data for the larvae experiment was collected only under blue light, so I used the same crossings and tested them under red light to use as a control.

Results for MB145B, SS01716 and SS02180
All figures show the results for preference tests (salt/pure) conducted under red and blue light for different gal4-lines.
MB145B:

SS01716:

SS02180:

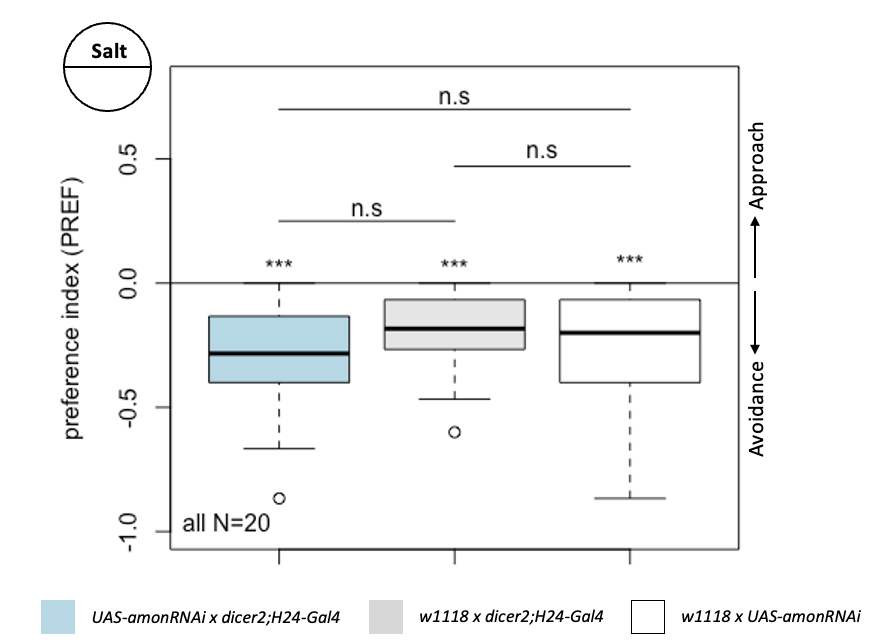
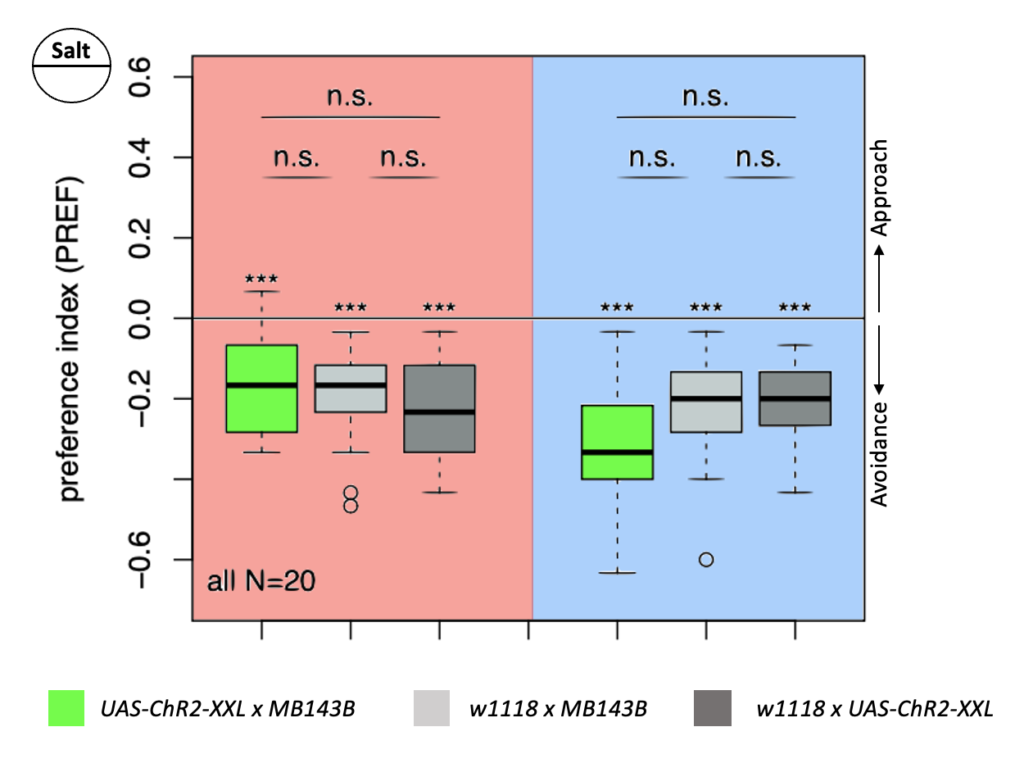
Results for amon-RNAi and MB143B
The first figure shows the results for the preference test (salt/pure) conducted with amon-RNAi only under red light.
For the next experiment I conducted the same preference test but with the split-gal4 line MB143B under red and blue light.
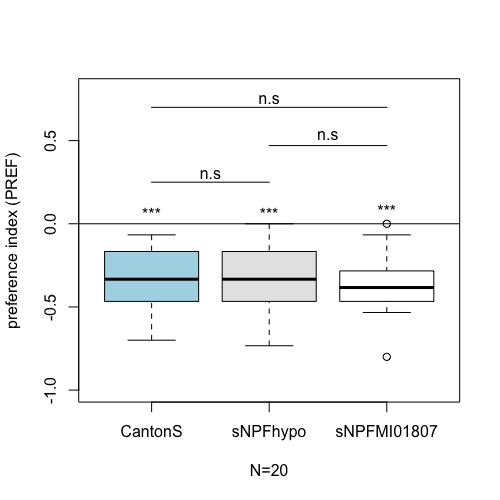
Results sNPF mutants
The following picture shows the results for the conducted preference tests (pure/salt) for sNPF mutants. All Experiments were performed under red light.
Results for MB+DANs and MB054B
The first experiment tested the activation of KCs with simultaneous ablation of pPAM which showed the following results:
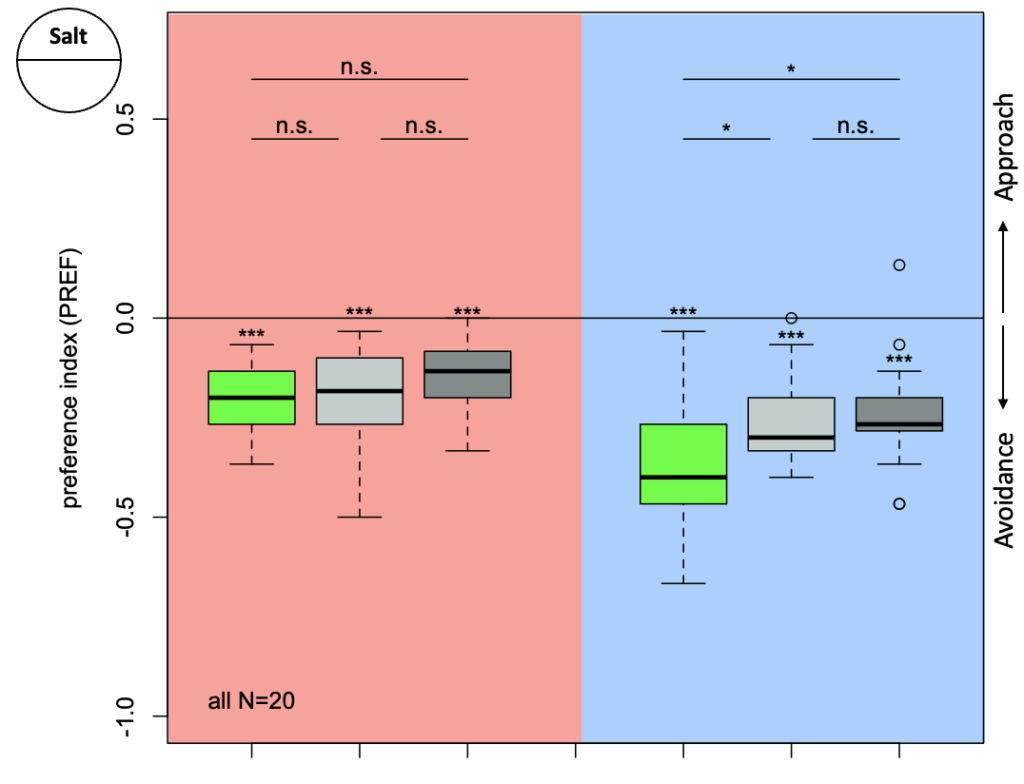
Green: UAS-ChR2-XXL; LexAop-rpr x 58E02-LexA; H24-Gal4
Lightgrey: UAS-ChR2-XXL; LexAop-rpr x H24-Gal4
Darkgrey: UAS-ChR2-XXL x 58E02-LexA; H24-Gal4
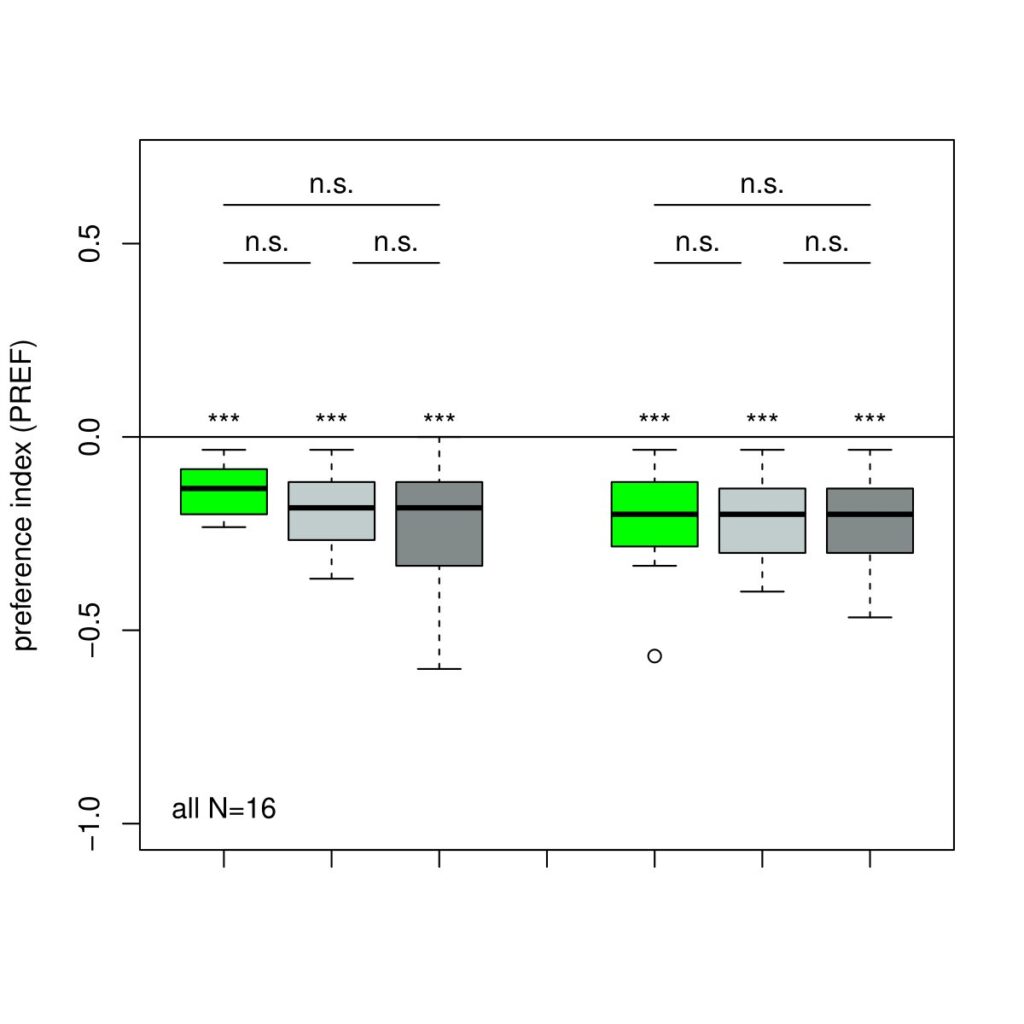
The next experiment was conducted with the split-Gal4 line MB054B (DAN-f1/DAN-g1) and showed the following:
Optogenetic stimulation of DANs
With the focus on dopaminergic neurons, I conducted two experiments with two different driver lines to see how the naive gustatory behavior in Drosophila larvae is affected.
The first cross I tested was R58E02-Gal4 x UAS-ChR2-XXL, which gave me the following results:
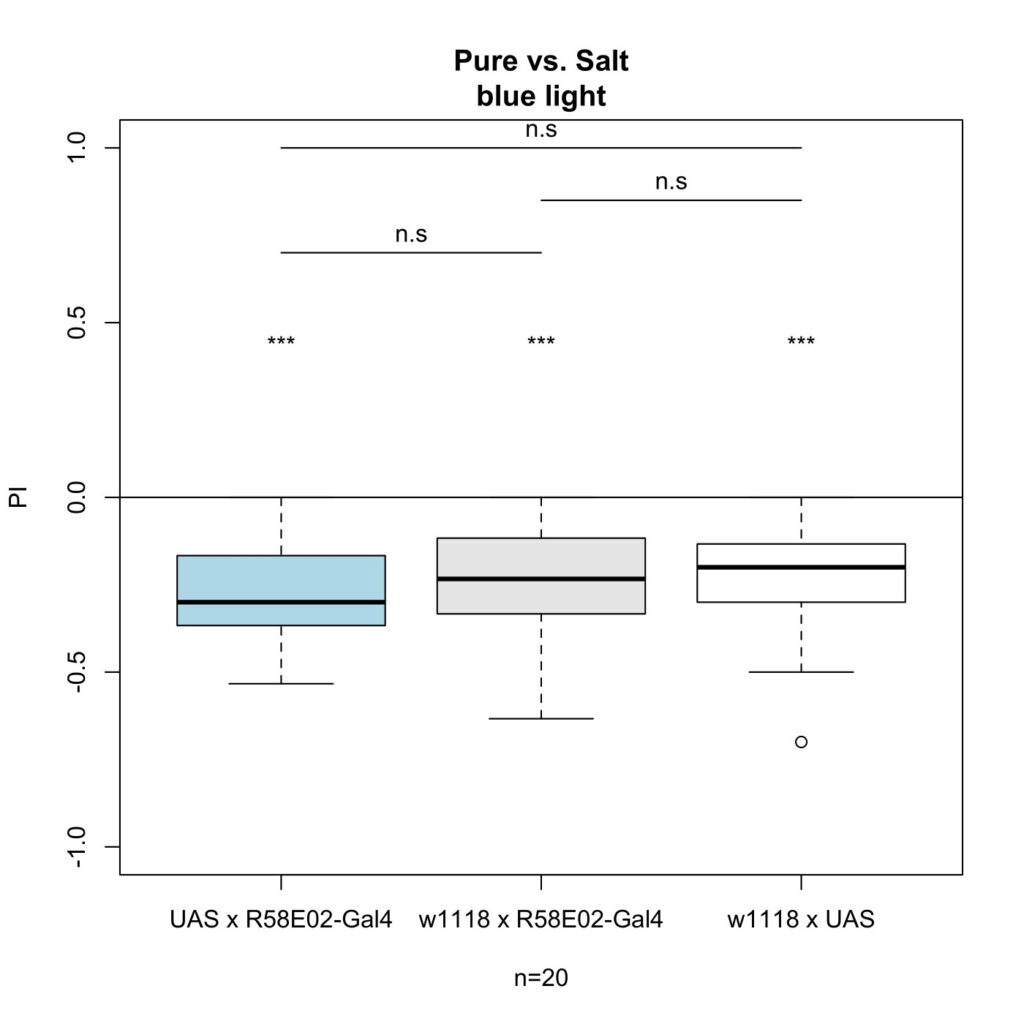
As seen in the figures, there was no effect under blue light.
For the second experiment I crossed TH-Gal4 x UAS-ChR2-XXL with these results:
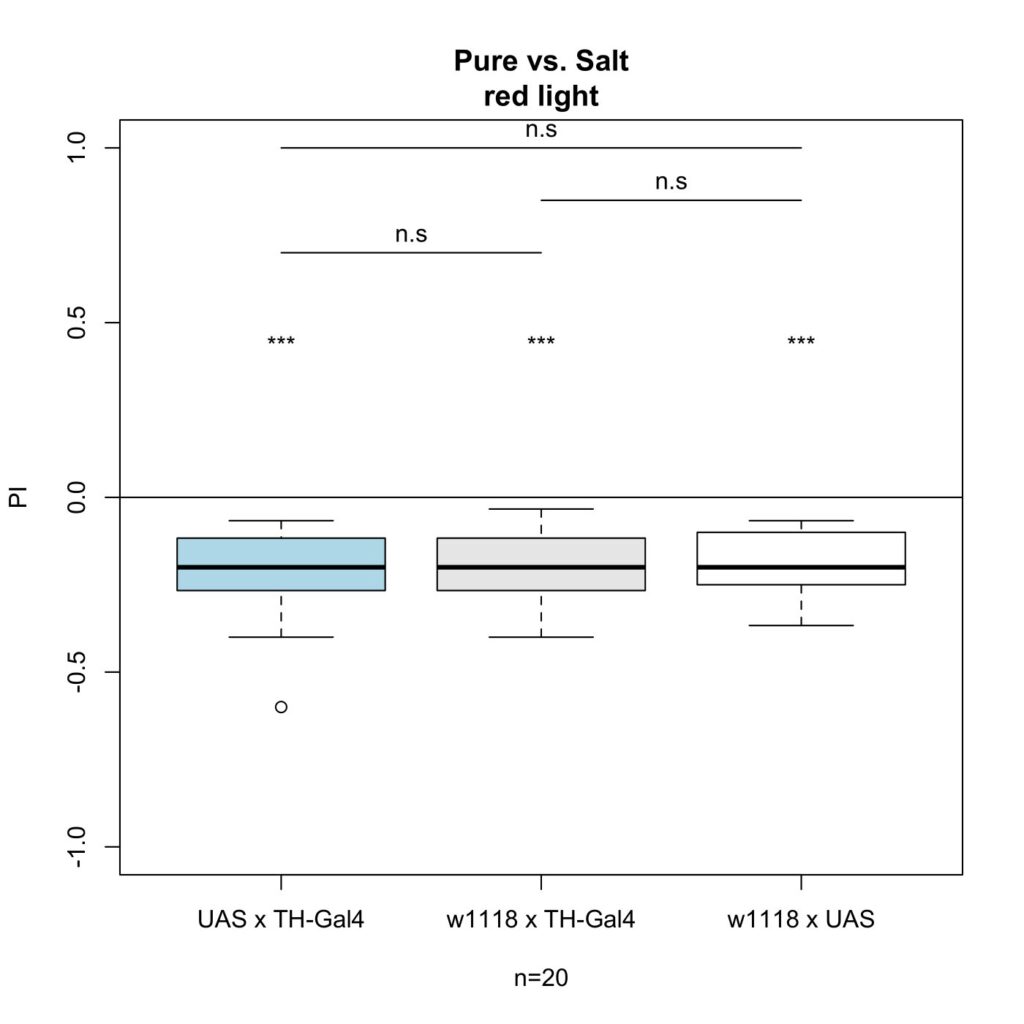
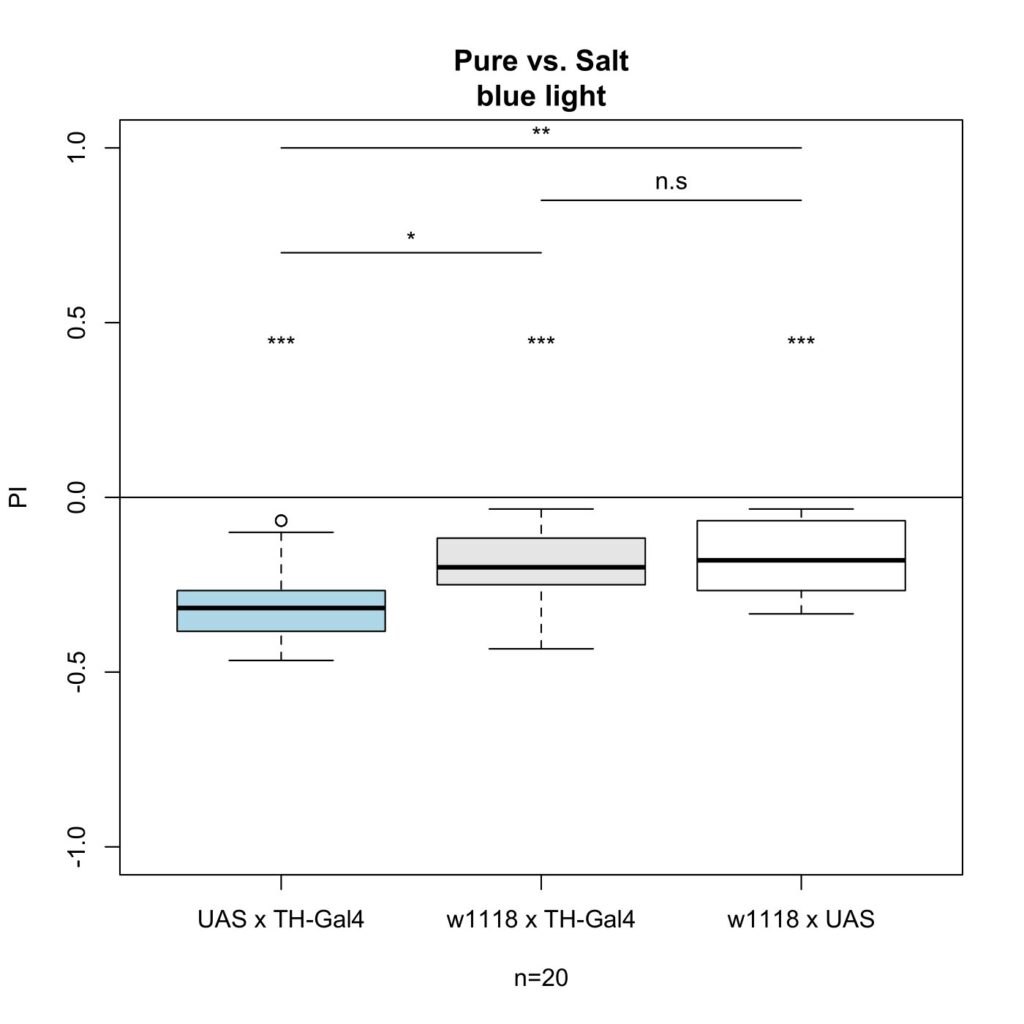
With this experiment, there was an effect on gustatory behavior as there is a clear significant difference between the experimental group and the control group.
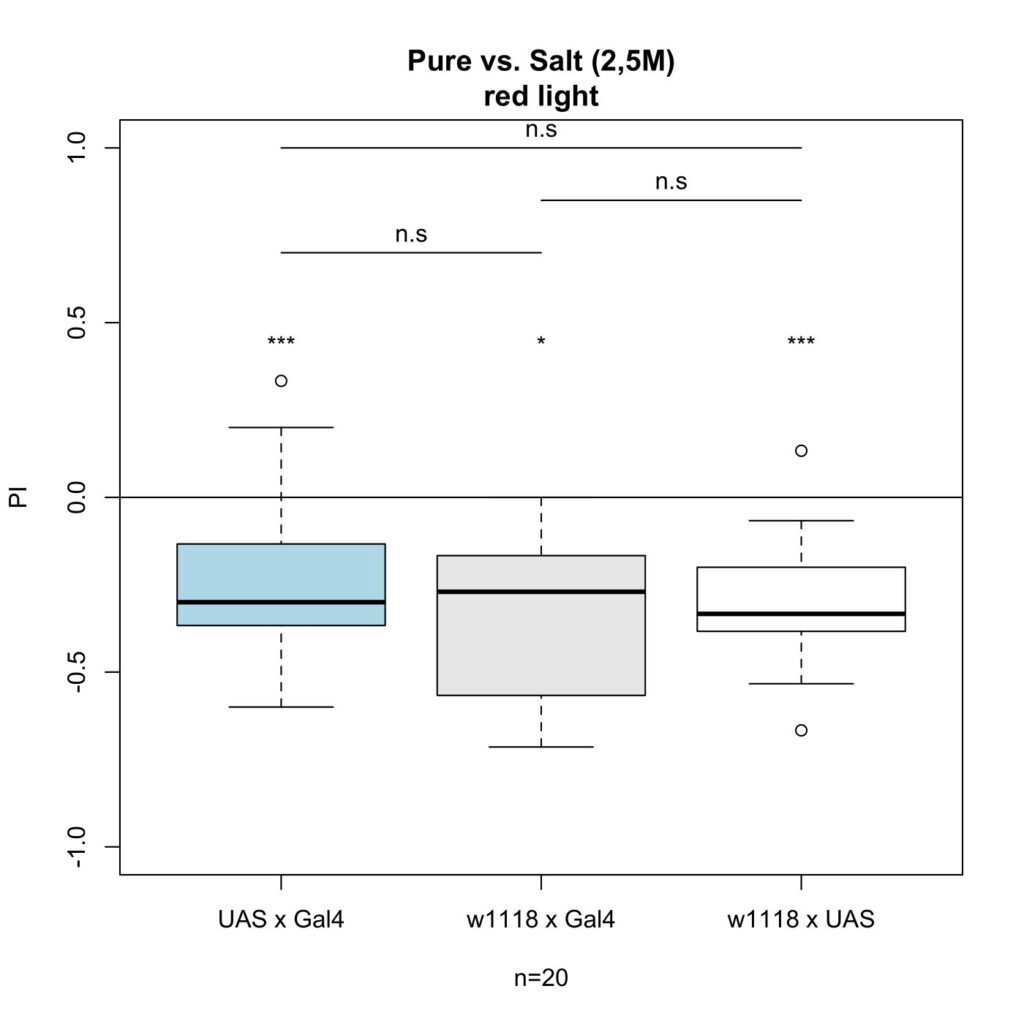
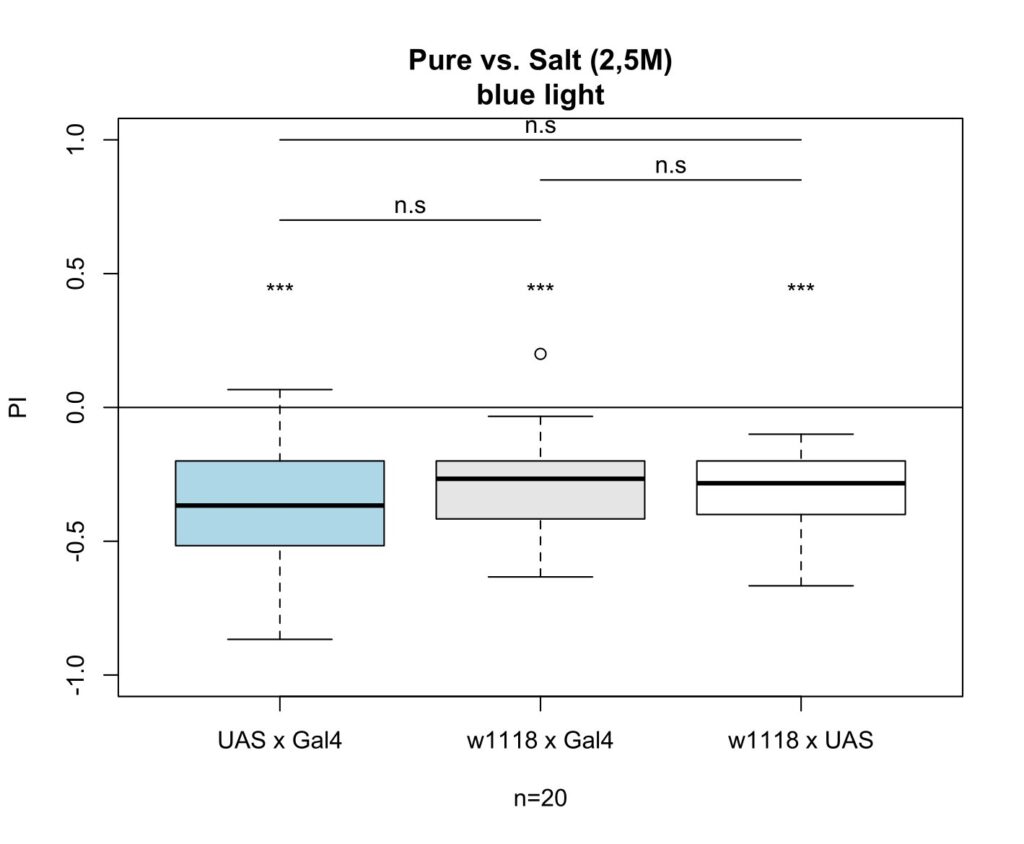
Preferences with higher salt concentration
The following plots show the results after I increased the salt concentration from 1,5M to 2,5M. It shows that the difference between the control groups and experimental group are not significant anymore.
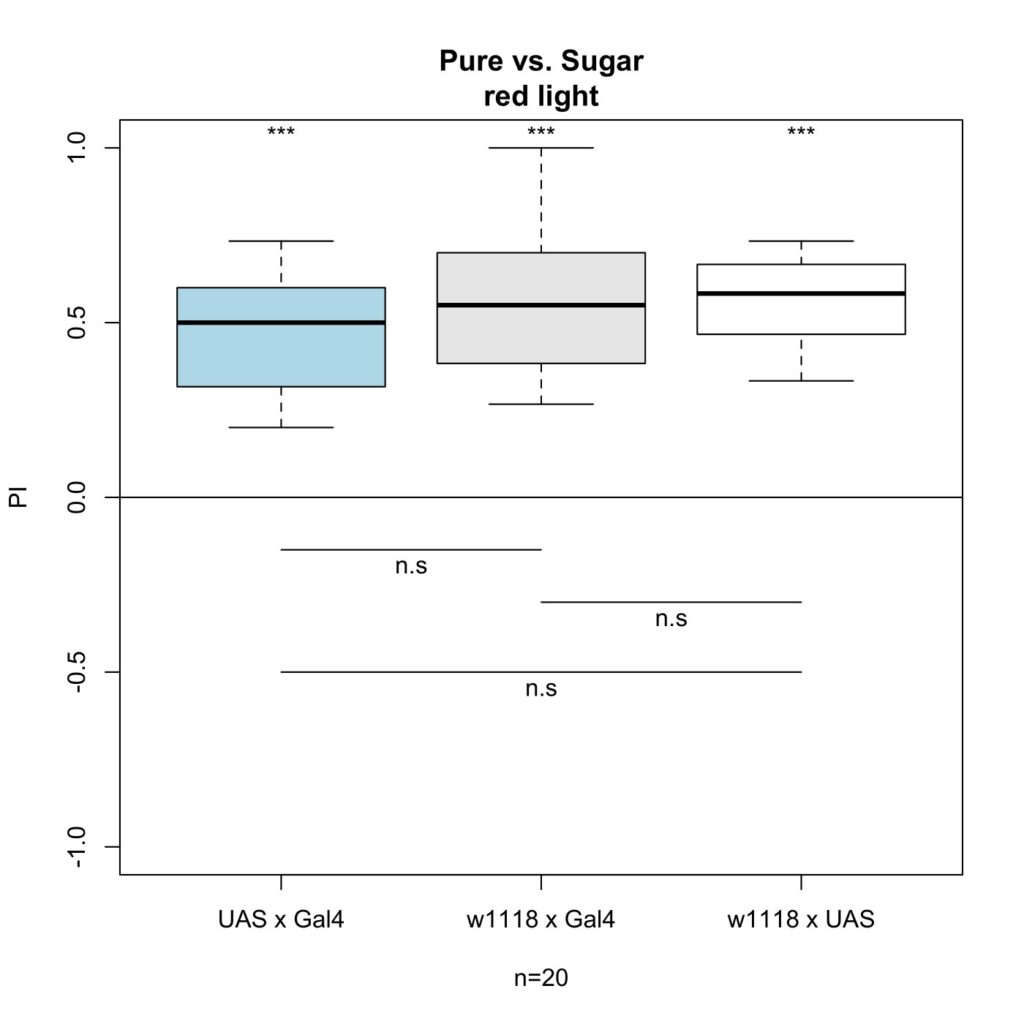
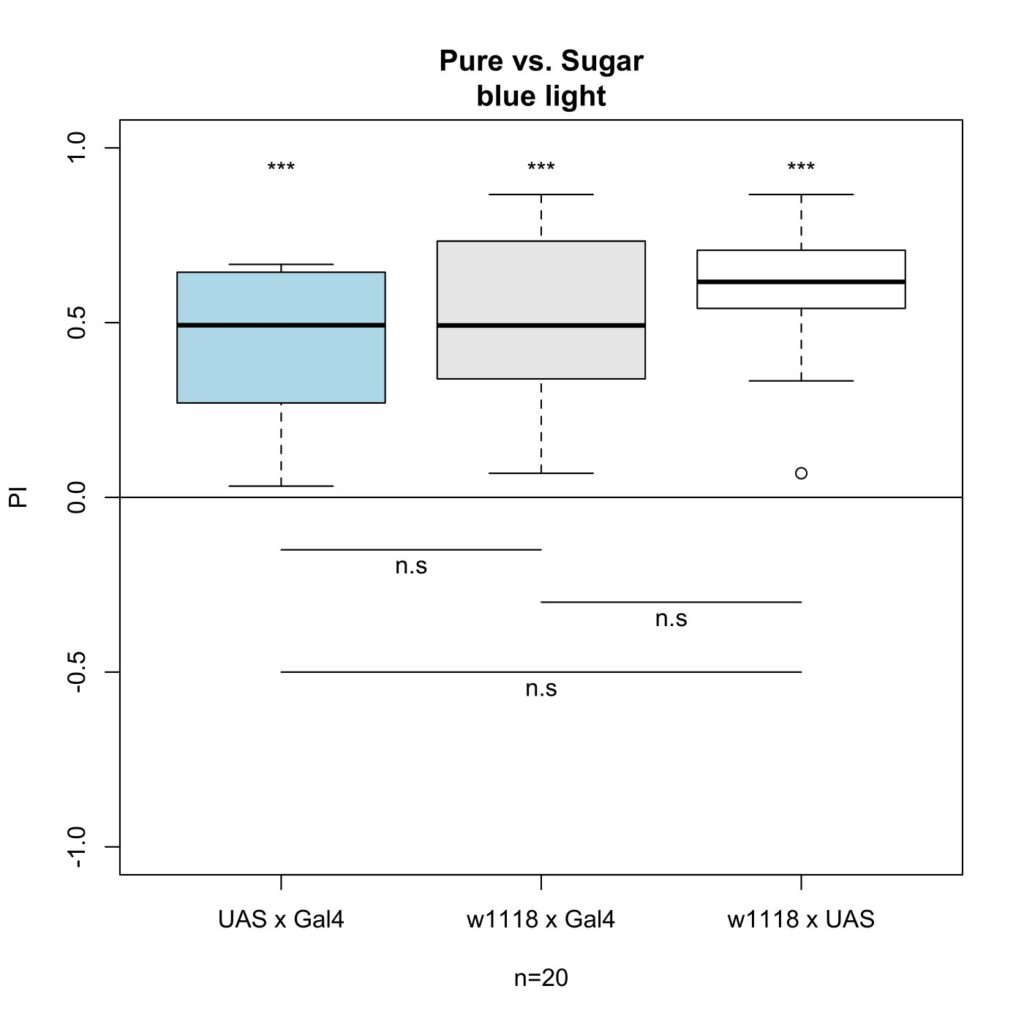

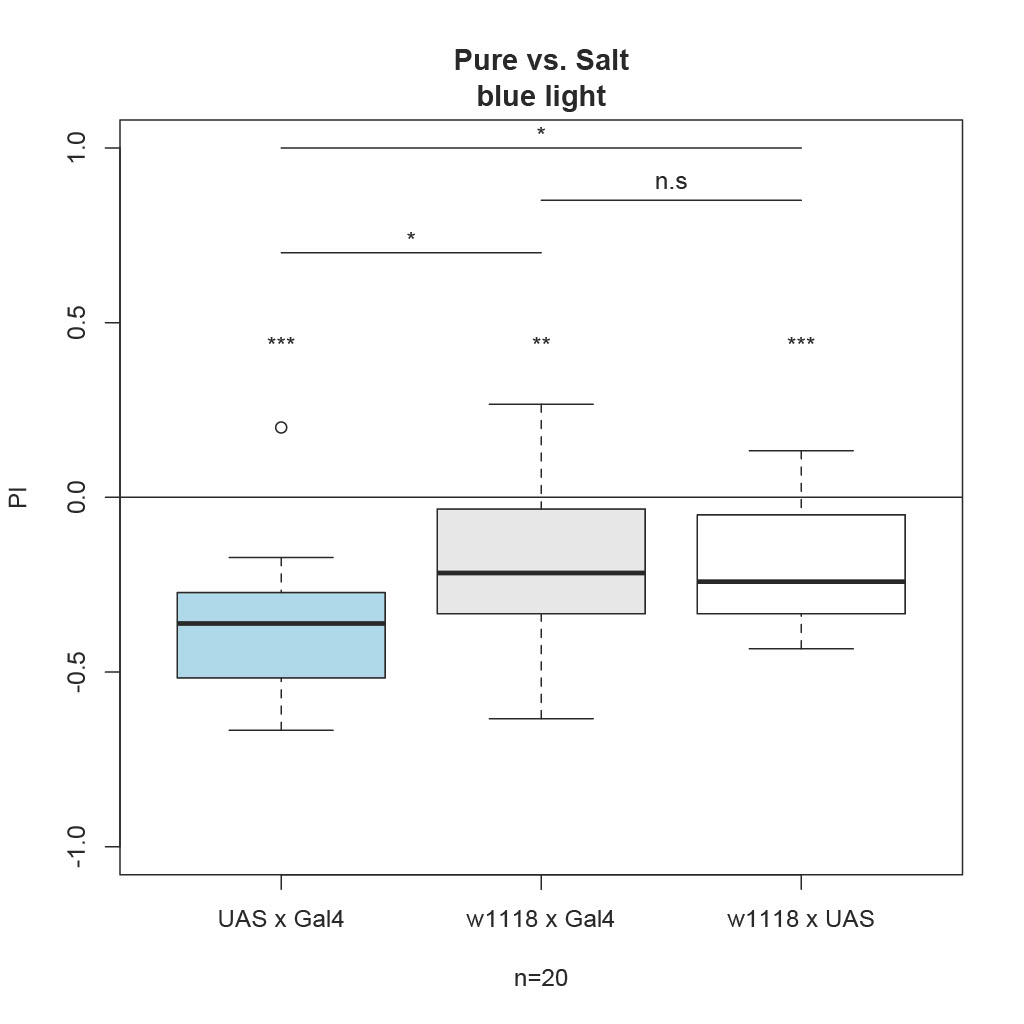
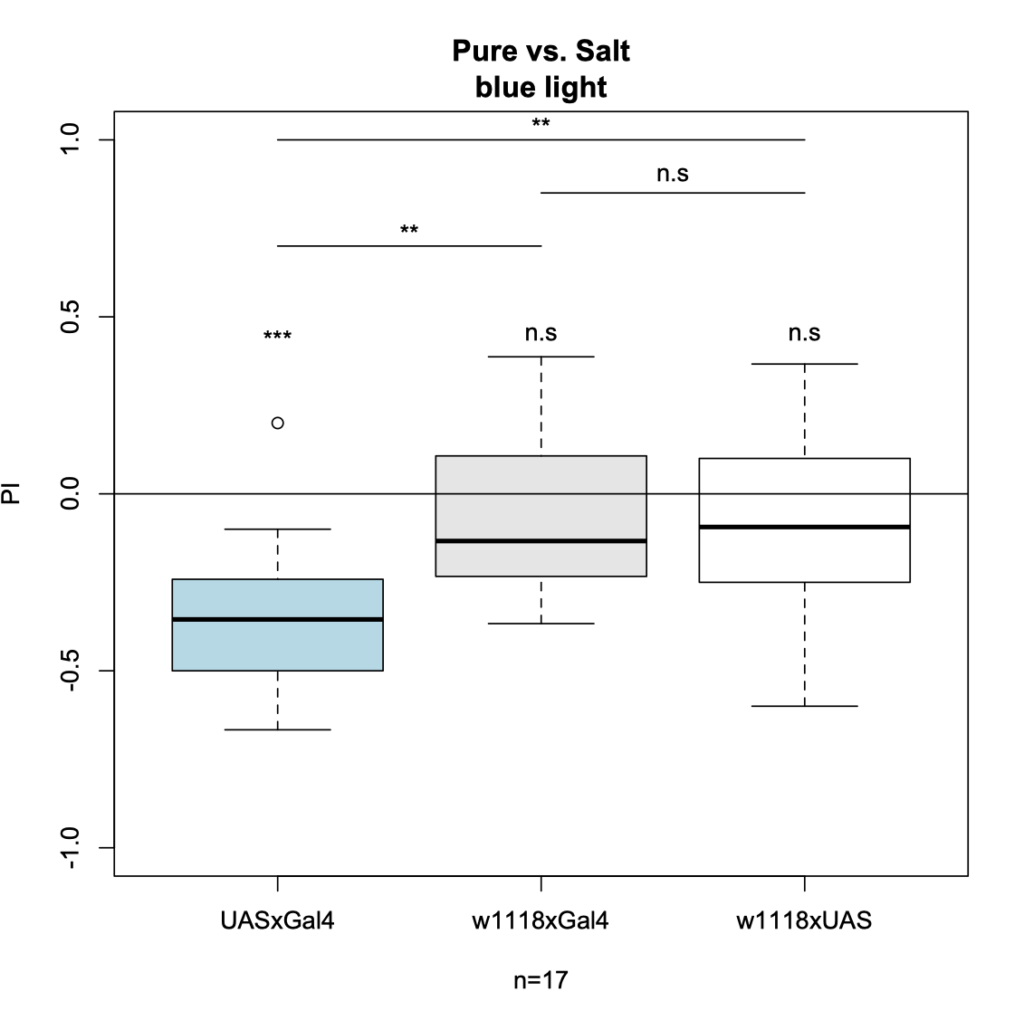
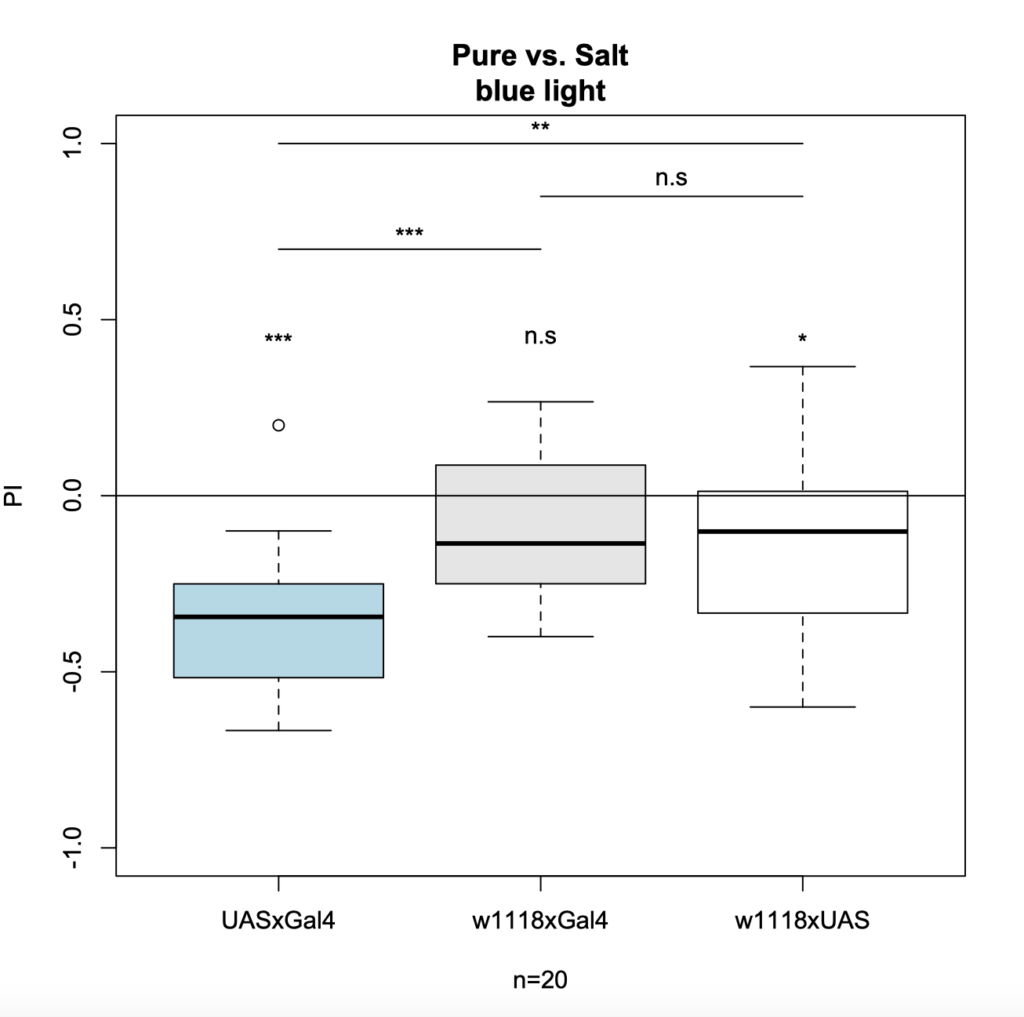
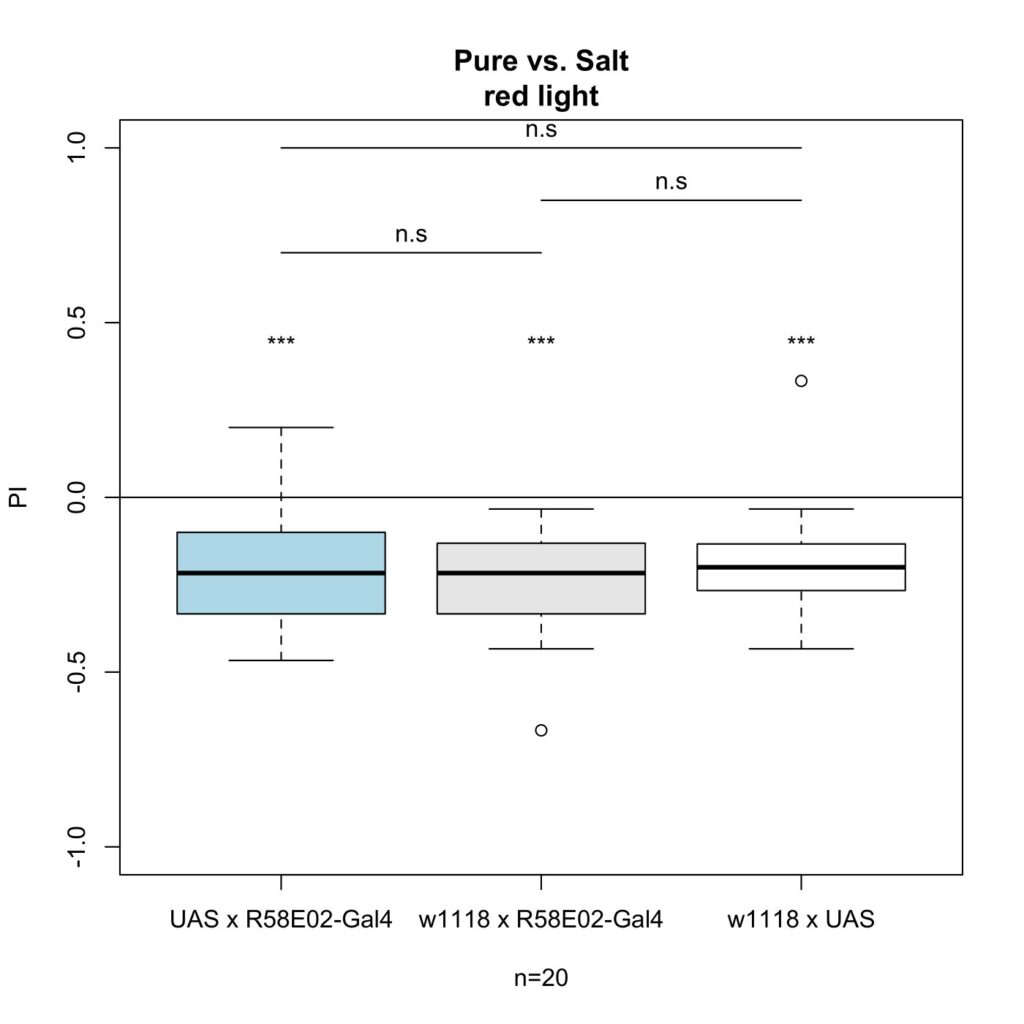
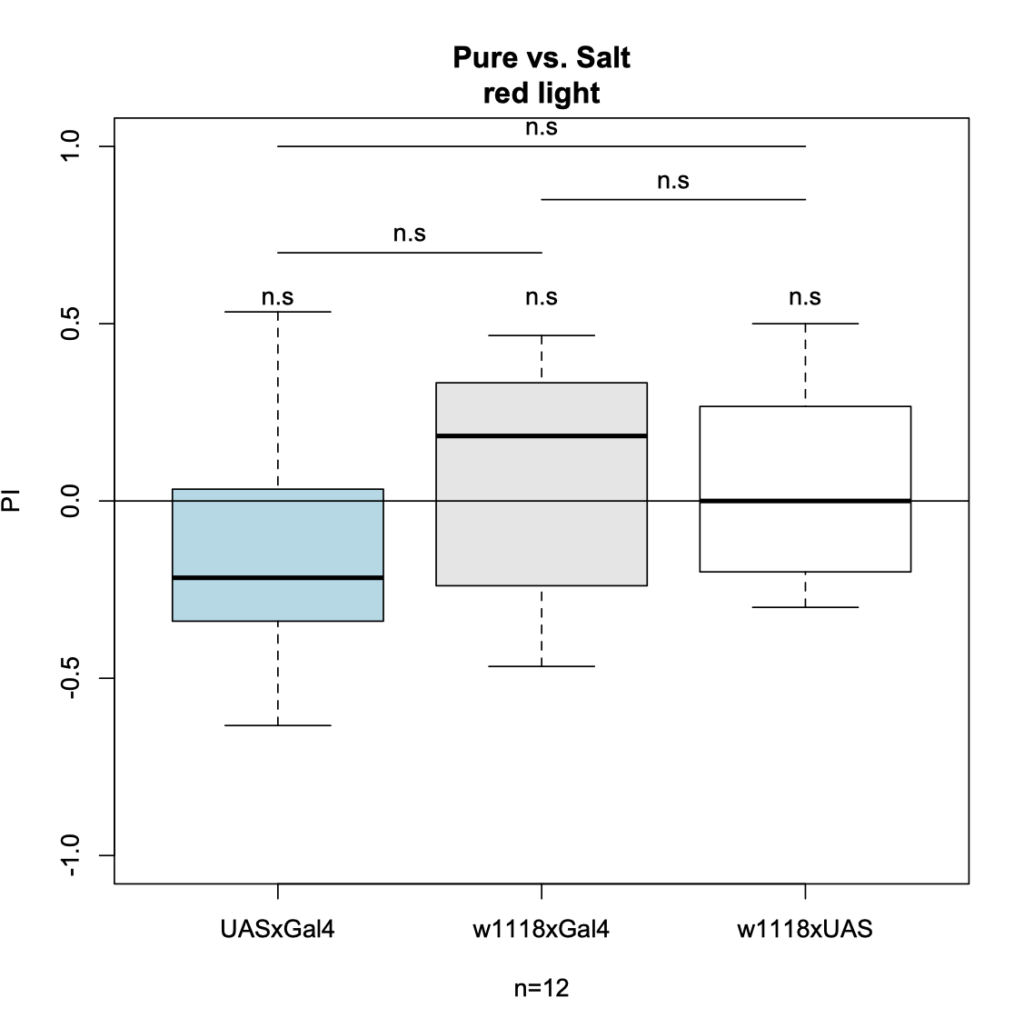
Preference results: pure vs salt
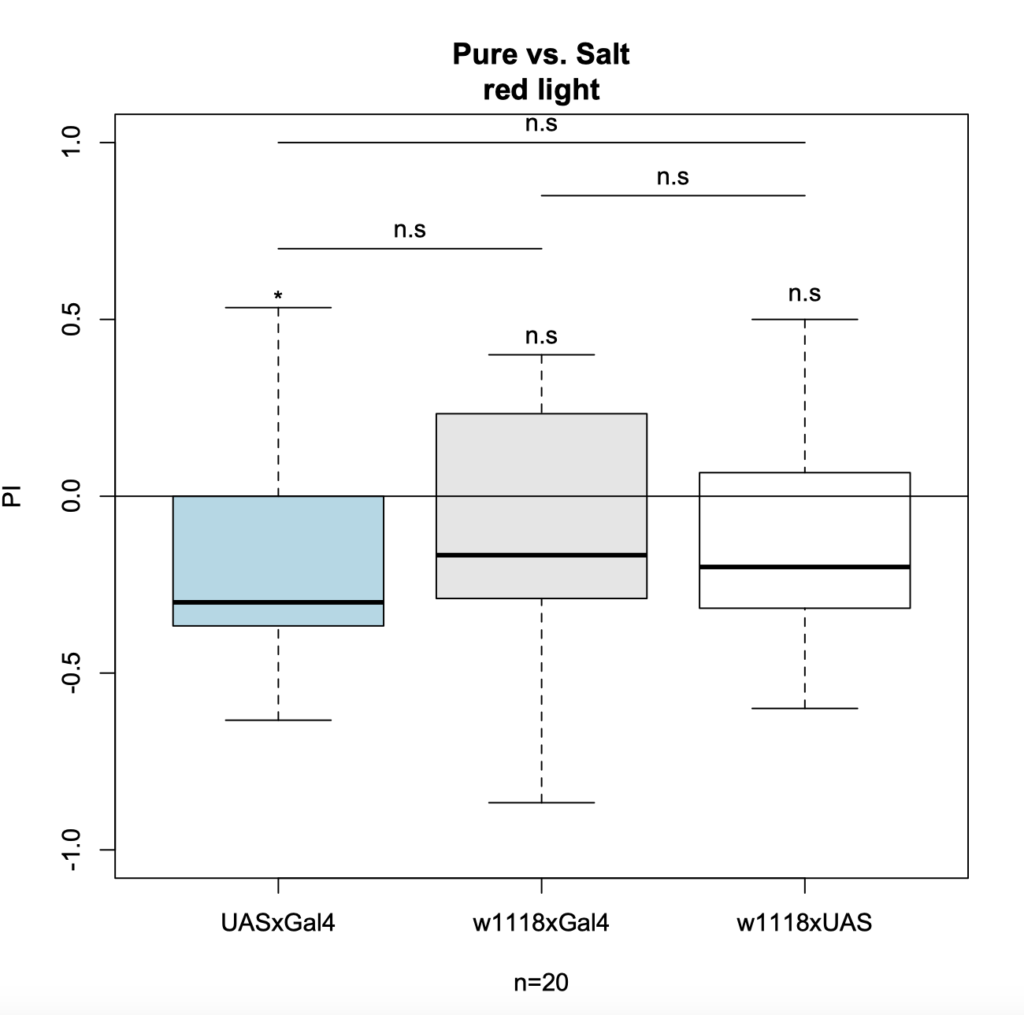
The first plot of each group show my results from the week before, and the ones beneath show the final results for red and blue light, after filling the sample size up to 20n.
Red light:
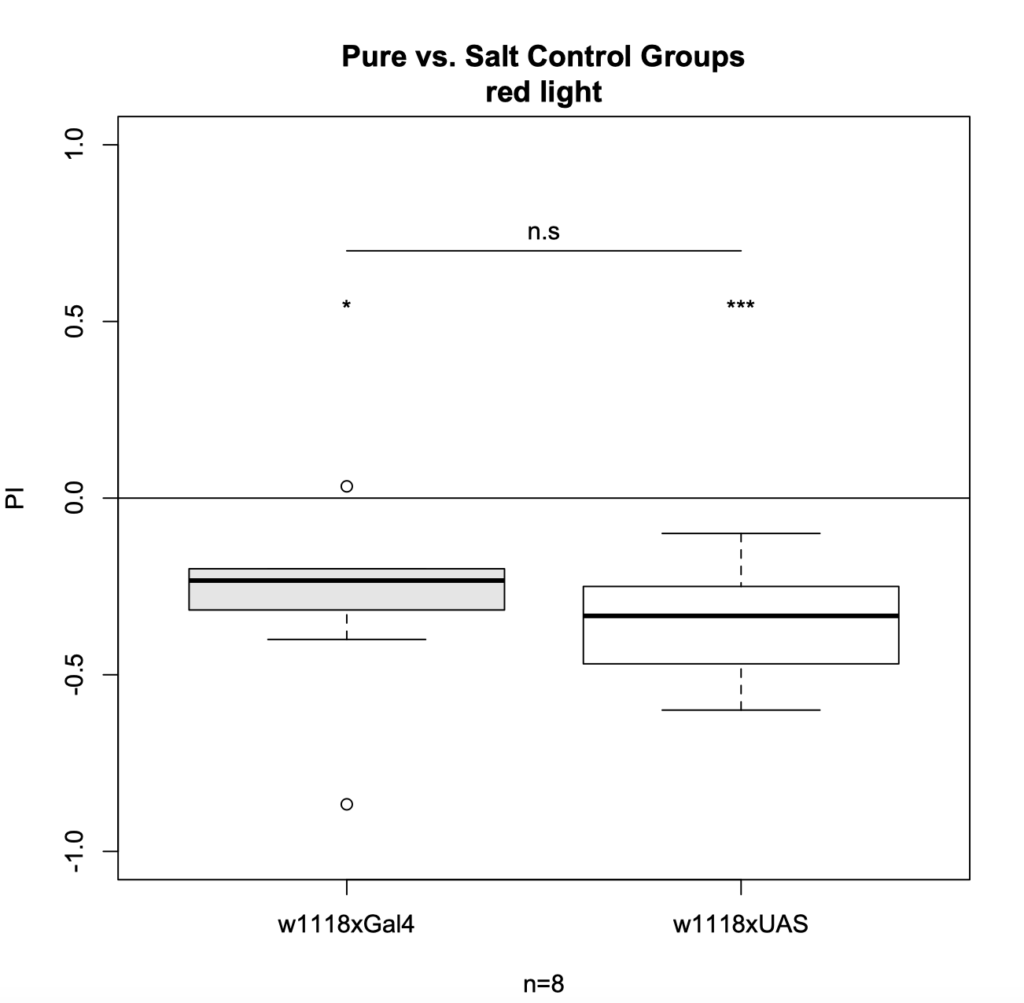
for comparison, this plot shows the control groups for the remaining 8n I had left separately:
Blue light: