Update2: Variability of Phototaxis 4: Buridan
on Monday, November 23rd, 2015 11:19 | by Isabelle Steymans
I continued collecting data for the Buridan experiment, so that now I can also show some data for the tubes 3-5.
Like in the previous post the different plots differ more form each other than in the first experiment. (Fig. 1-4)
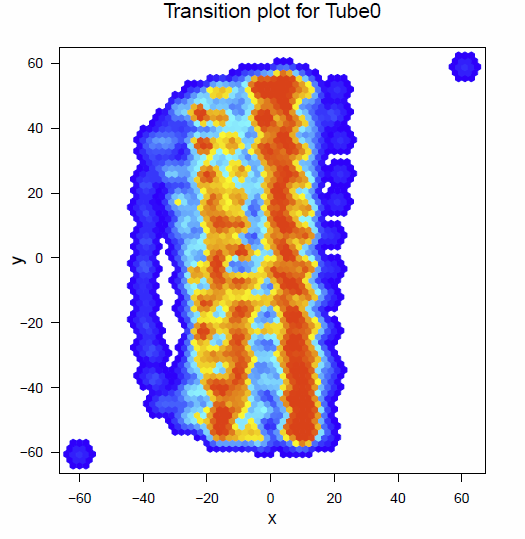
Fig. 1 Transitionplot for Tube 0

Fig. 2 Transitionplot for tube 1& 2
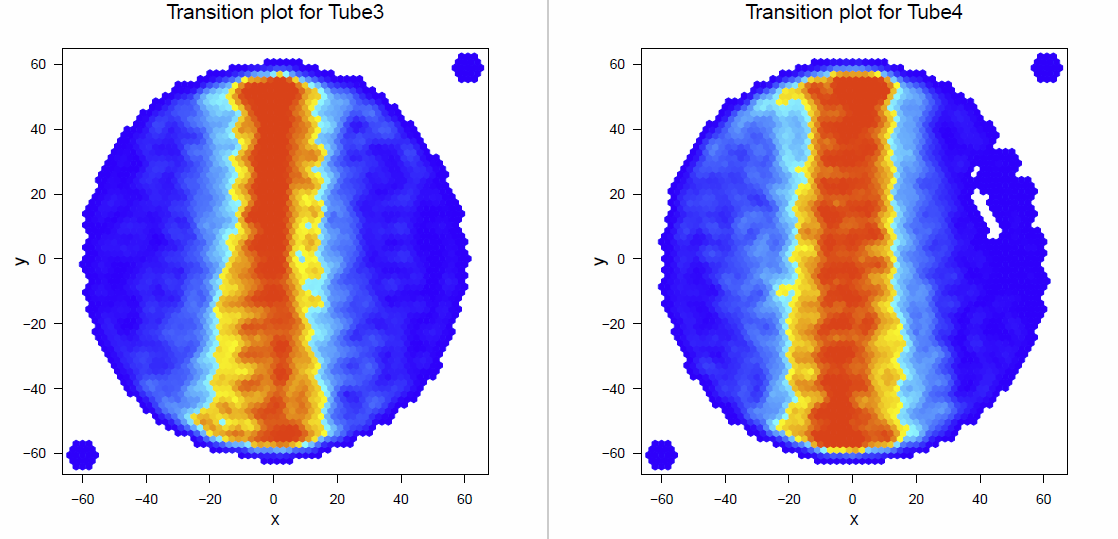
Fig.3 Transitionplot for tube 3 & 4
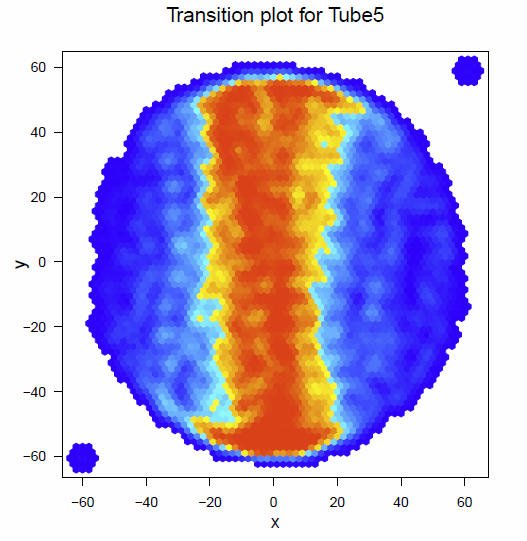
Fig. 4 Transitionplot for tube 5
And also this time I had again a look on the distance traveled per minute (Fig. 5) and the median speed (Fig. 6), the activitytime per minute (Fig. 7), the pause length (Fig. 8) , the number of pauses per minute and the number of walks (Fig. 9)
The flies of tube 0 traveled the smallest distance (Fig.5) and have the lowest activitytime (Fig.7) , but they have quite the same speed as the flies of the other groups (Fig.6). This can be explained by the number of pauses and the number of walks (Fig. 9). The flies of tube 0 make more pauses and less walks than the flies of the other tubes.

Fig. 5 Distance traveled per minute
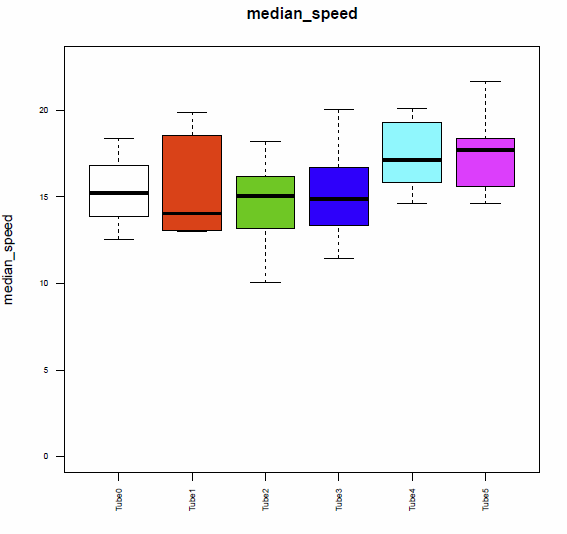
Fig. 6 median speed

Fig. 7 Activitytime per minute
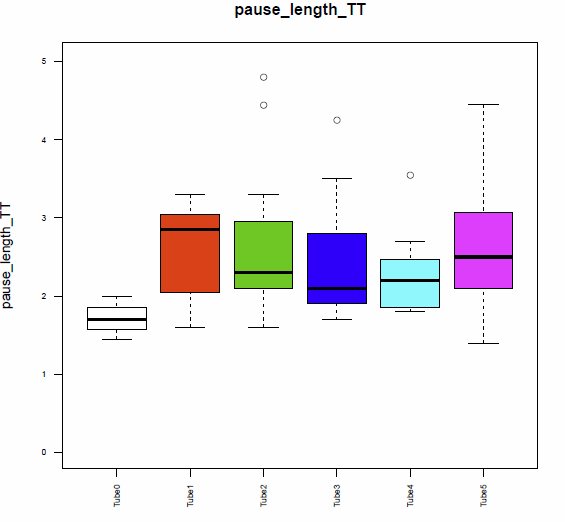
Fig. 8 Pause length
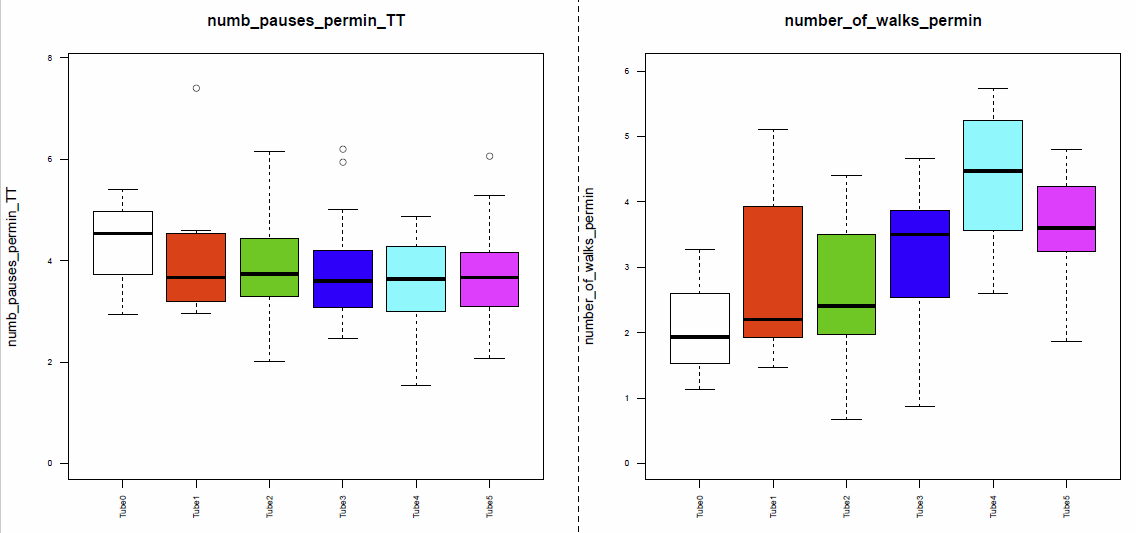
Fig. 9 Number of pauses & number of walks per minute

Phototactic Flexibility (OA neurons) – Update & ‘Staining’ of tbh
on Sunday, November 15th, 2015 1:30 | by Bianca Birk
Phototactic Flexibility
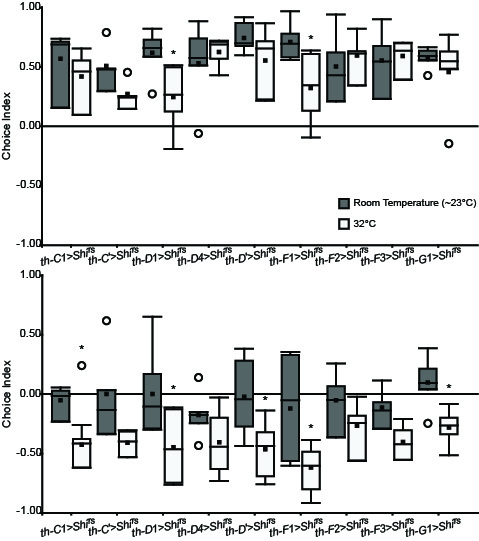
These are the newest results of the tbh-subgroups screen.
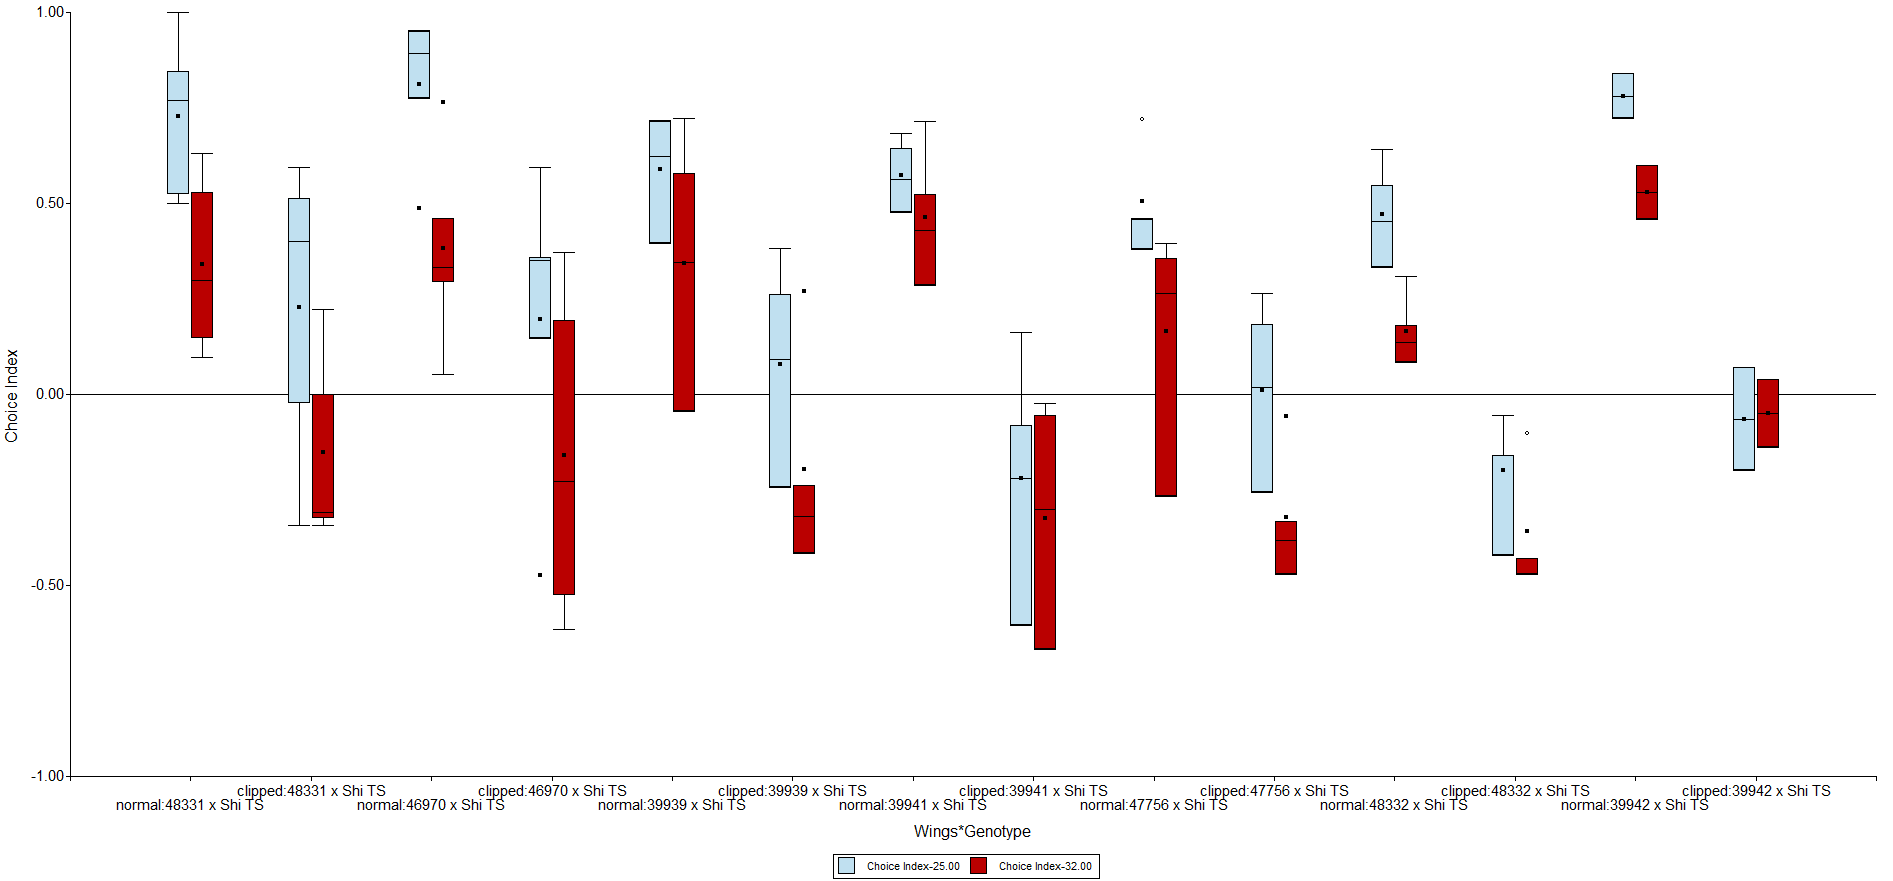
Fig 1: tbh-subgroups tested at RT and 24 h later at 32°C
‘Staining’ of tbh subgroup 46970
I crossed tbh-46970 to GFP (nucl), dissected the brains and mounted them (No antibodies were used).
Fig 1: 46970 x GFP
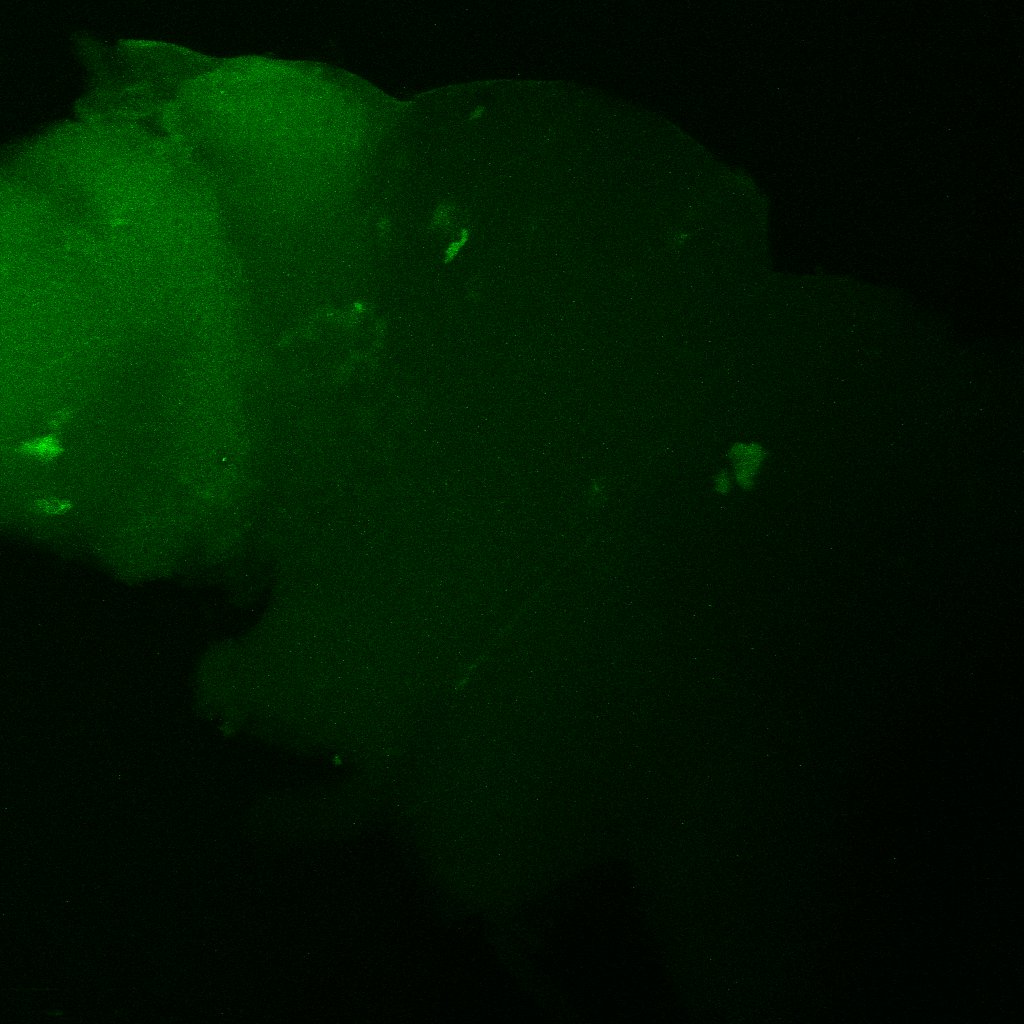
Fig 2: 46970 x GFP
Category: wing clipping | No Comments
Update: Variability of Phototaxis 4: Buridan
on Friday, November 13th, 2015 11:06 | by Isabelle Steymans
Because the data in the last experiments seemed to be very similar in each of the different tubes and there were many problems with the evaluation of this data, I decided to redo this experiment.
I started testing the tubes 0 to 2, with only a number of 4 flies in group 0, 5 flies in group 1 and 7 flies in group 2. This difference in the number of flies is due to the previous Benzer-experiments I did to split the flies.
Below there are the new transitionplots of the different tubes tested (Fig.1) In this case we see that the different plots differ more form each other than in the last experiment.
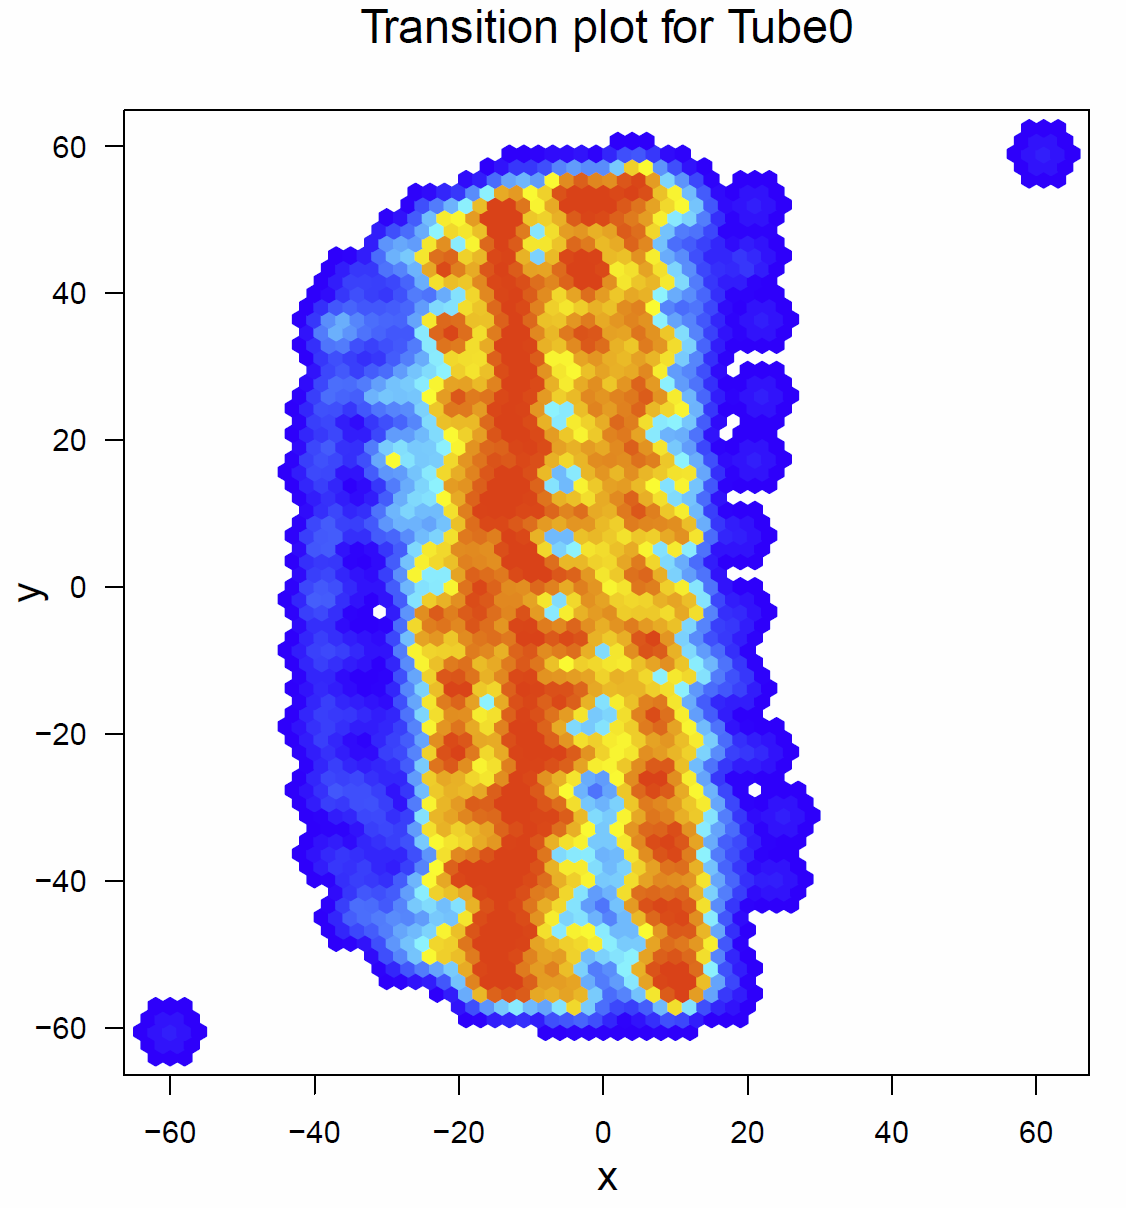
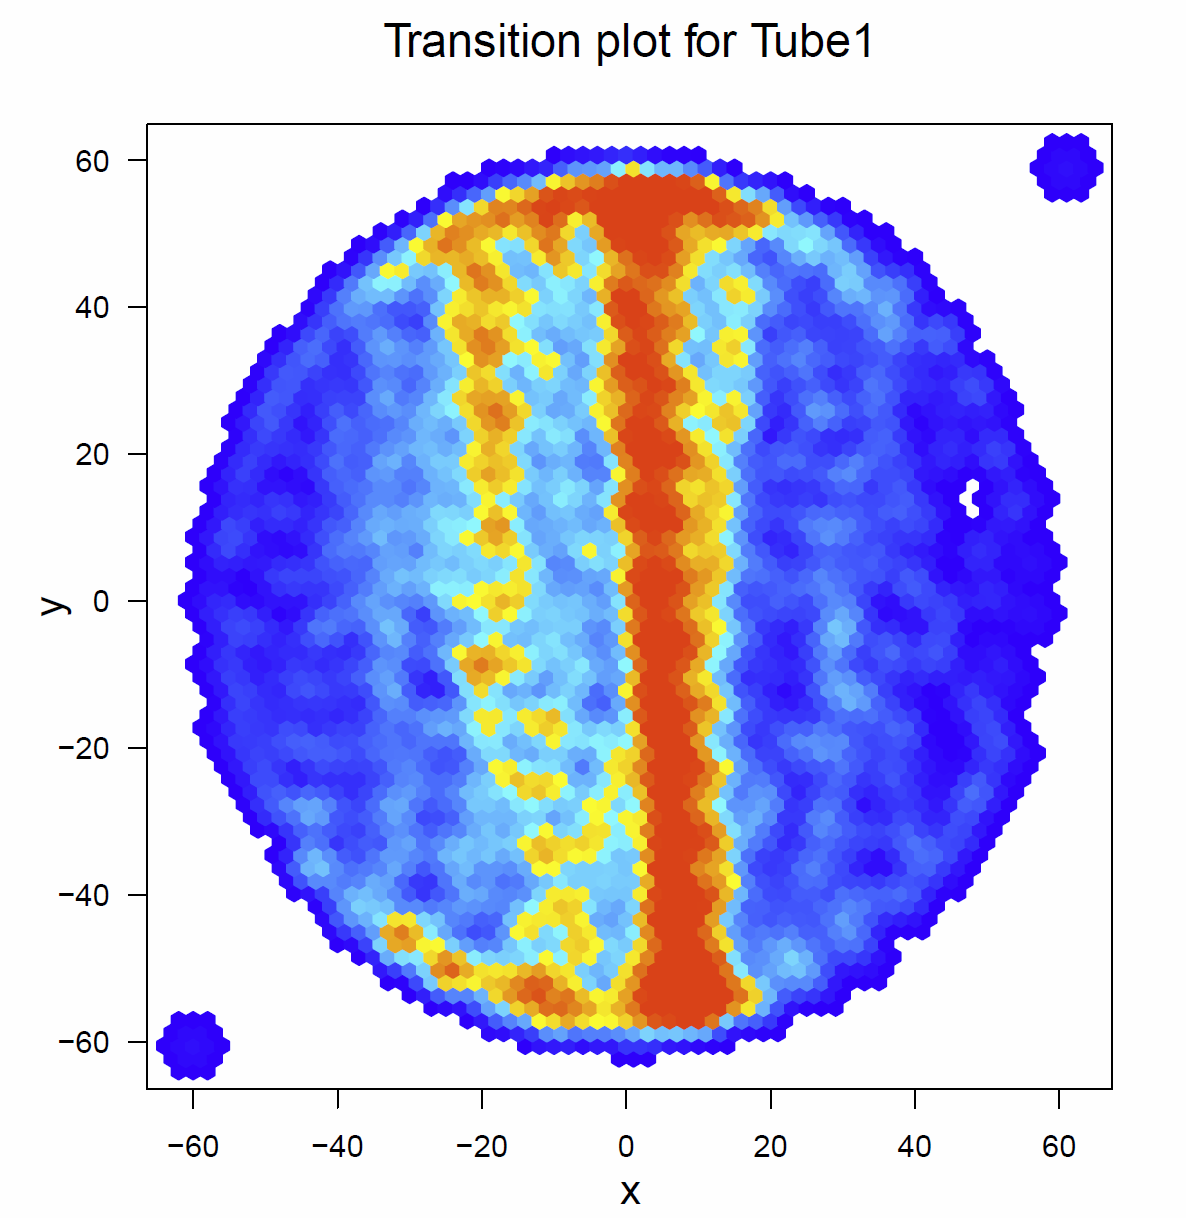
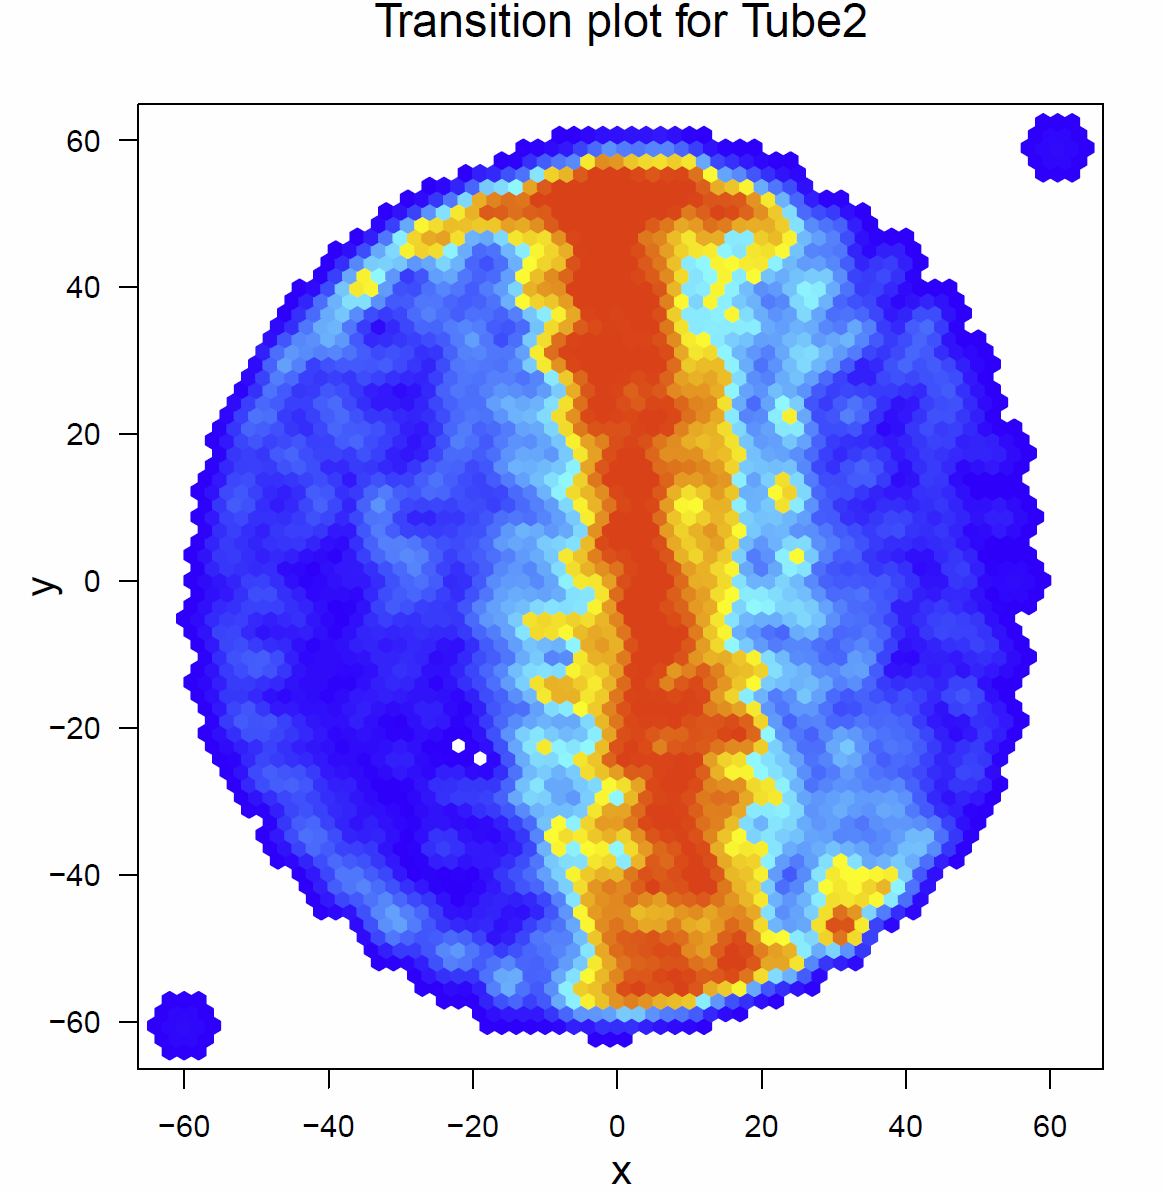
Fig. 1 Transitionplots Tube 0-2
This time I also had a look on the distance traveled per minute and the median speed (Fig. 2), the activitytime per minute (Fig. 3 & 4) , the pause duration and length, the number of pauses per minute (Fig. 5&6)
We see that the median speed, the pause duration and the number of pauses per minute are similar in all the groups. But there is a difference in the distance the flies traveled and the activitytime of these flies. Both are reduced in the flies of tube 0, whereas the flies of tube 1 and 2 are quite similar.
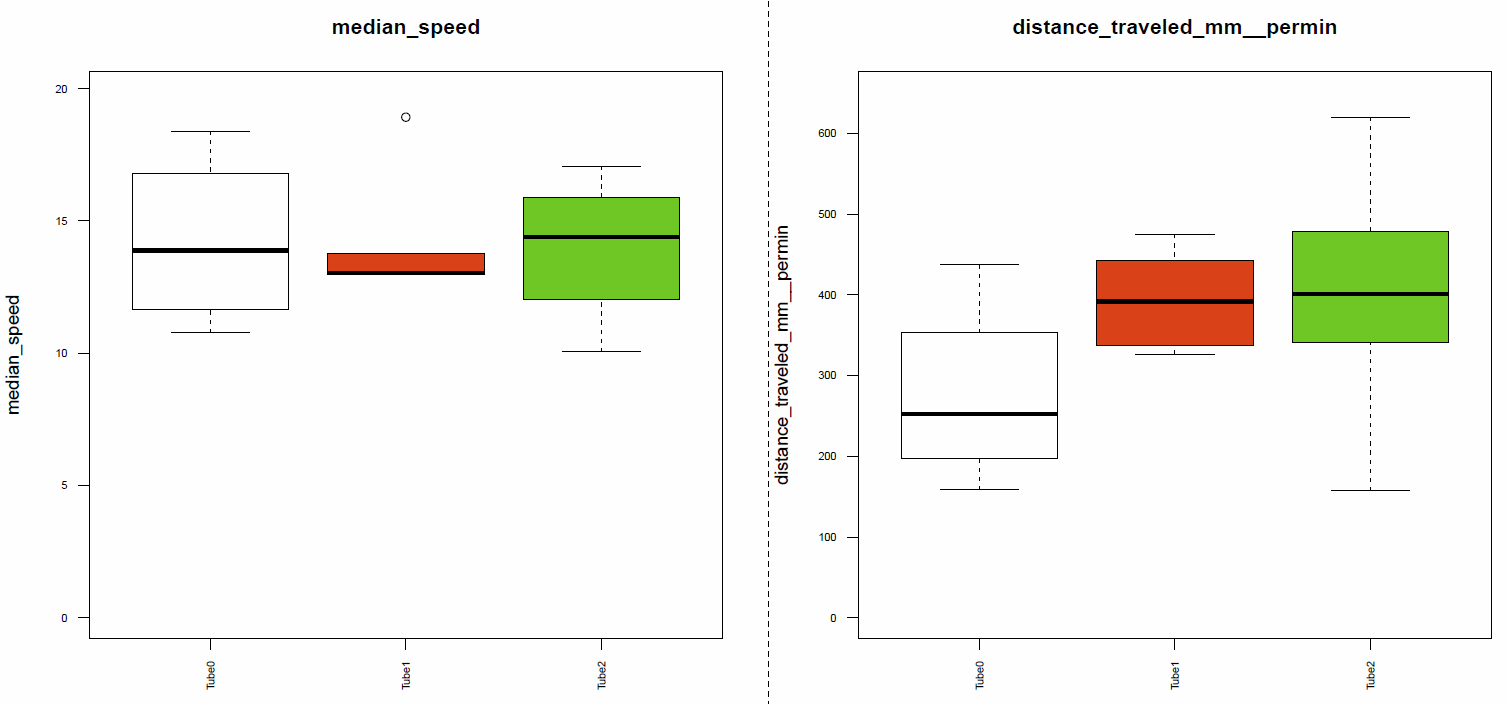
Fig. 2 median speed & distance traveled
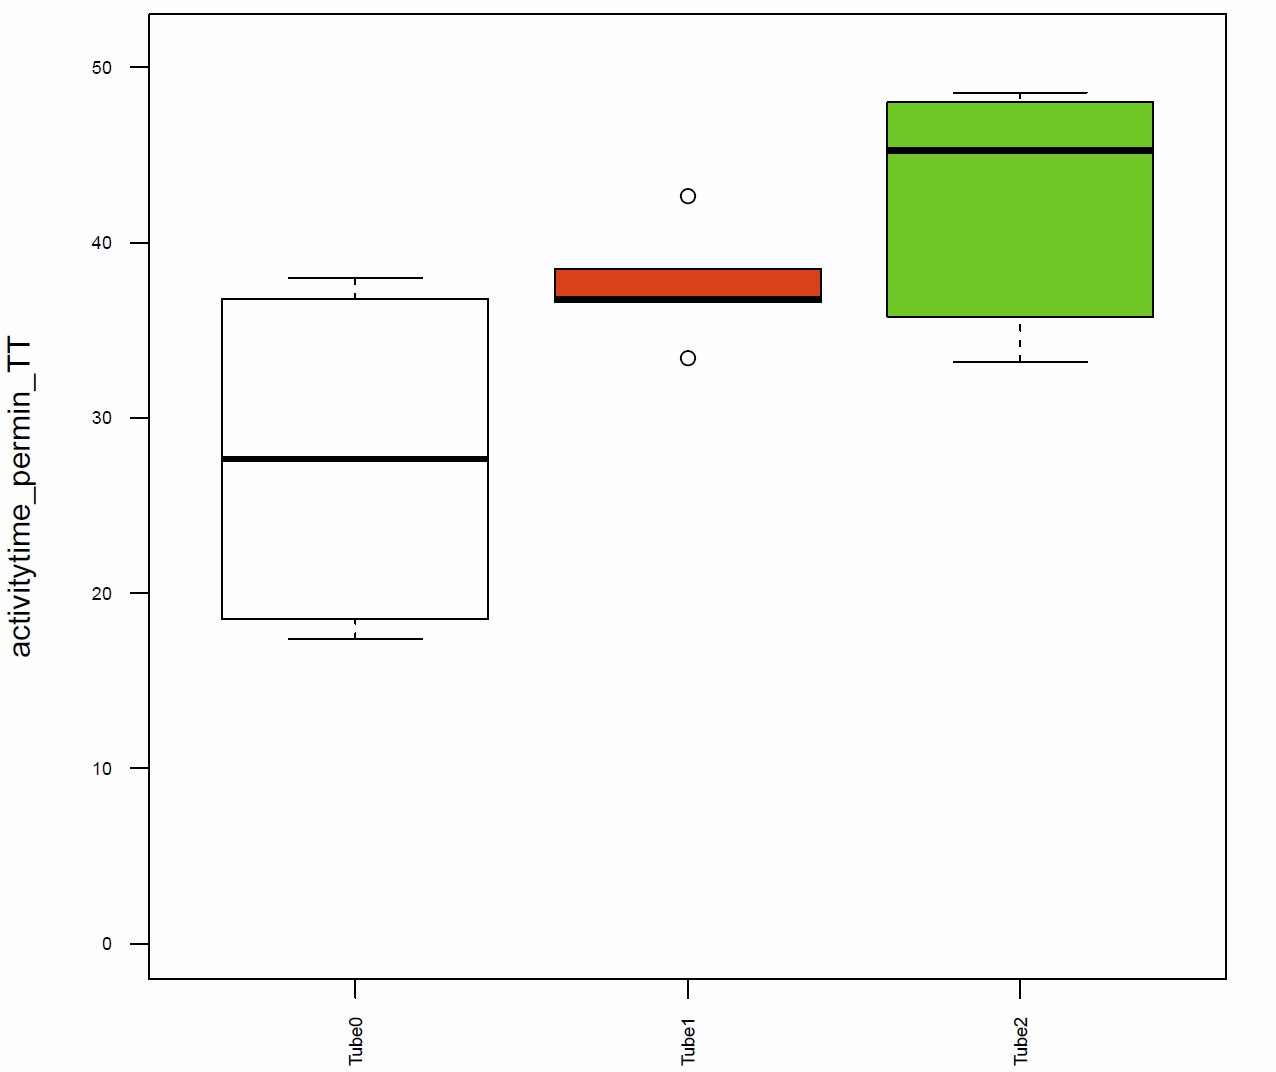
Fig. 3 Activitytime per minute (TT)
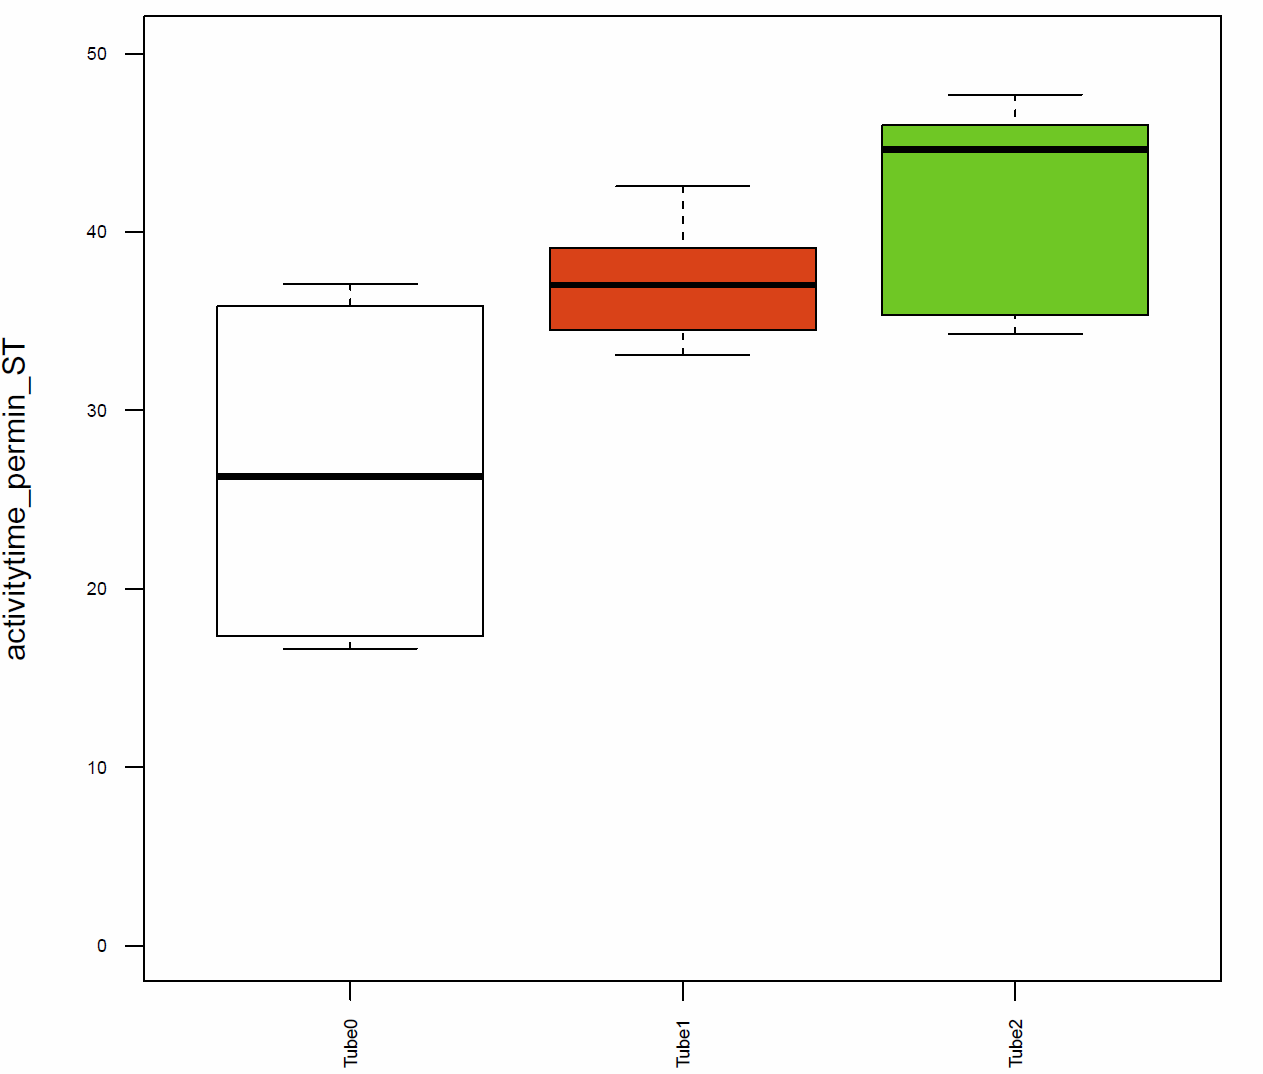
Fig. 4 Activitytime per minute (ST)
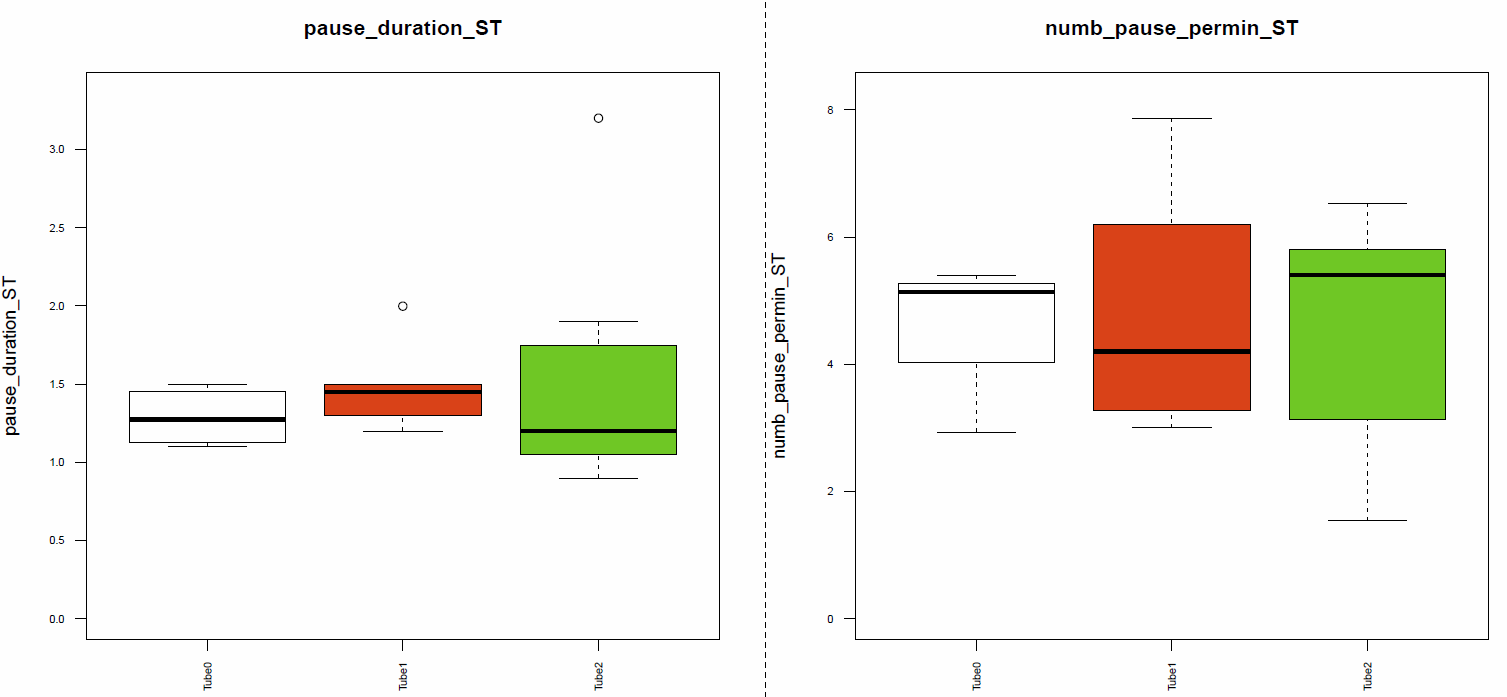
Fig. 5 Pause duration & number of pauses per minute (ST)
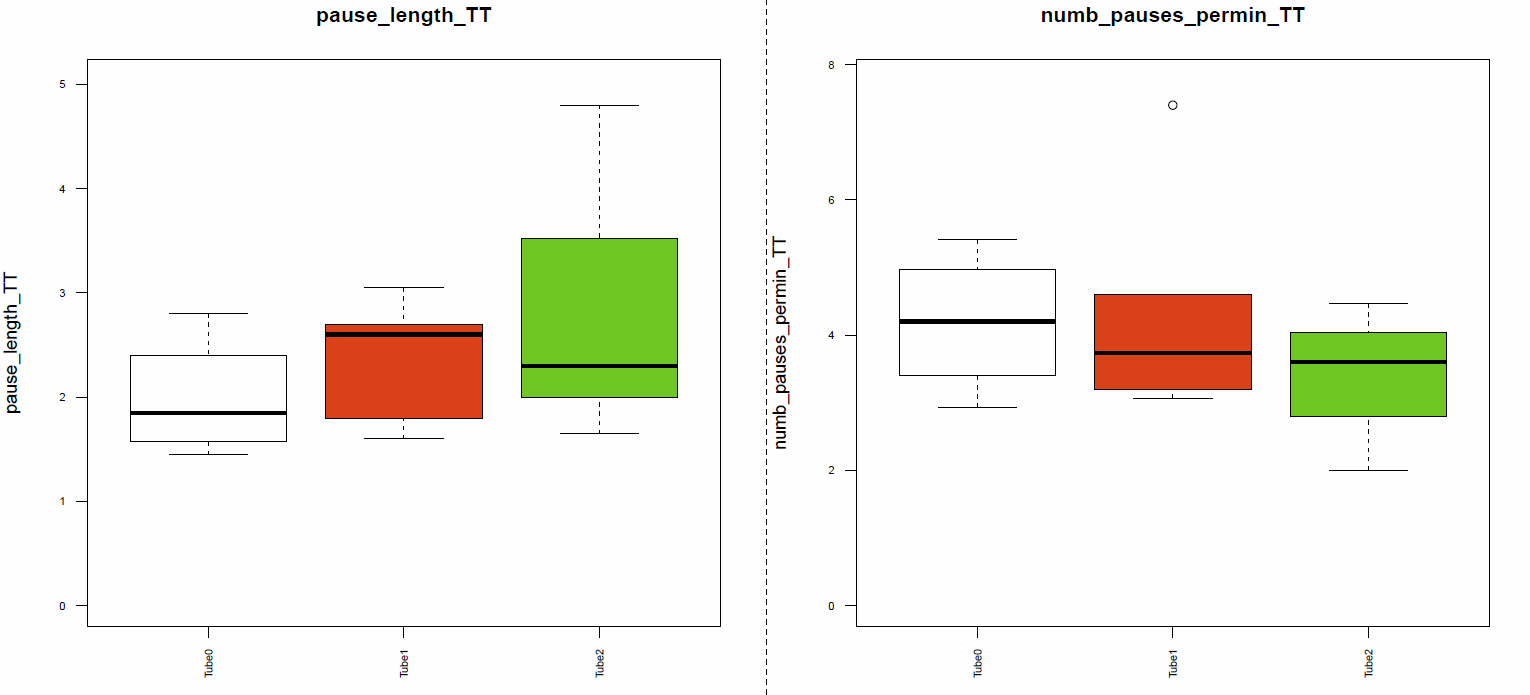
Fig. 6 pause length & number of pauses per minute (TT)
Temperature Impact on Phototacitc Behavior – Update
on Thursday, November 12th, 2015 9:31 | by Amelie Roedel
I did a few more trials for the different genotypes.
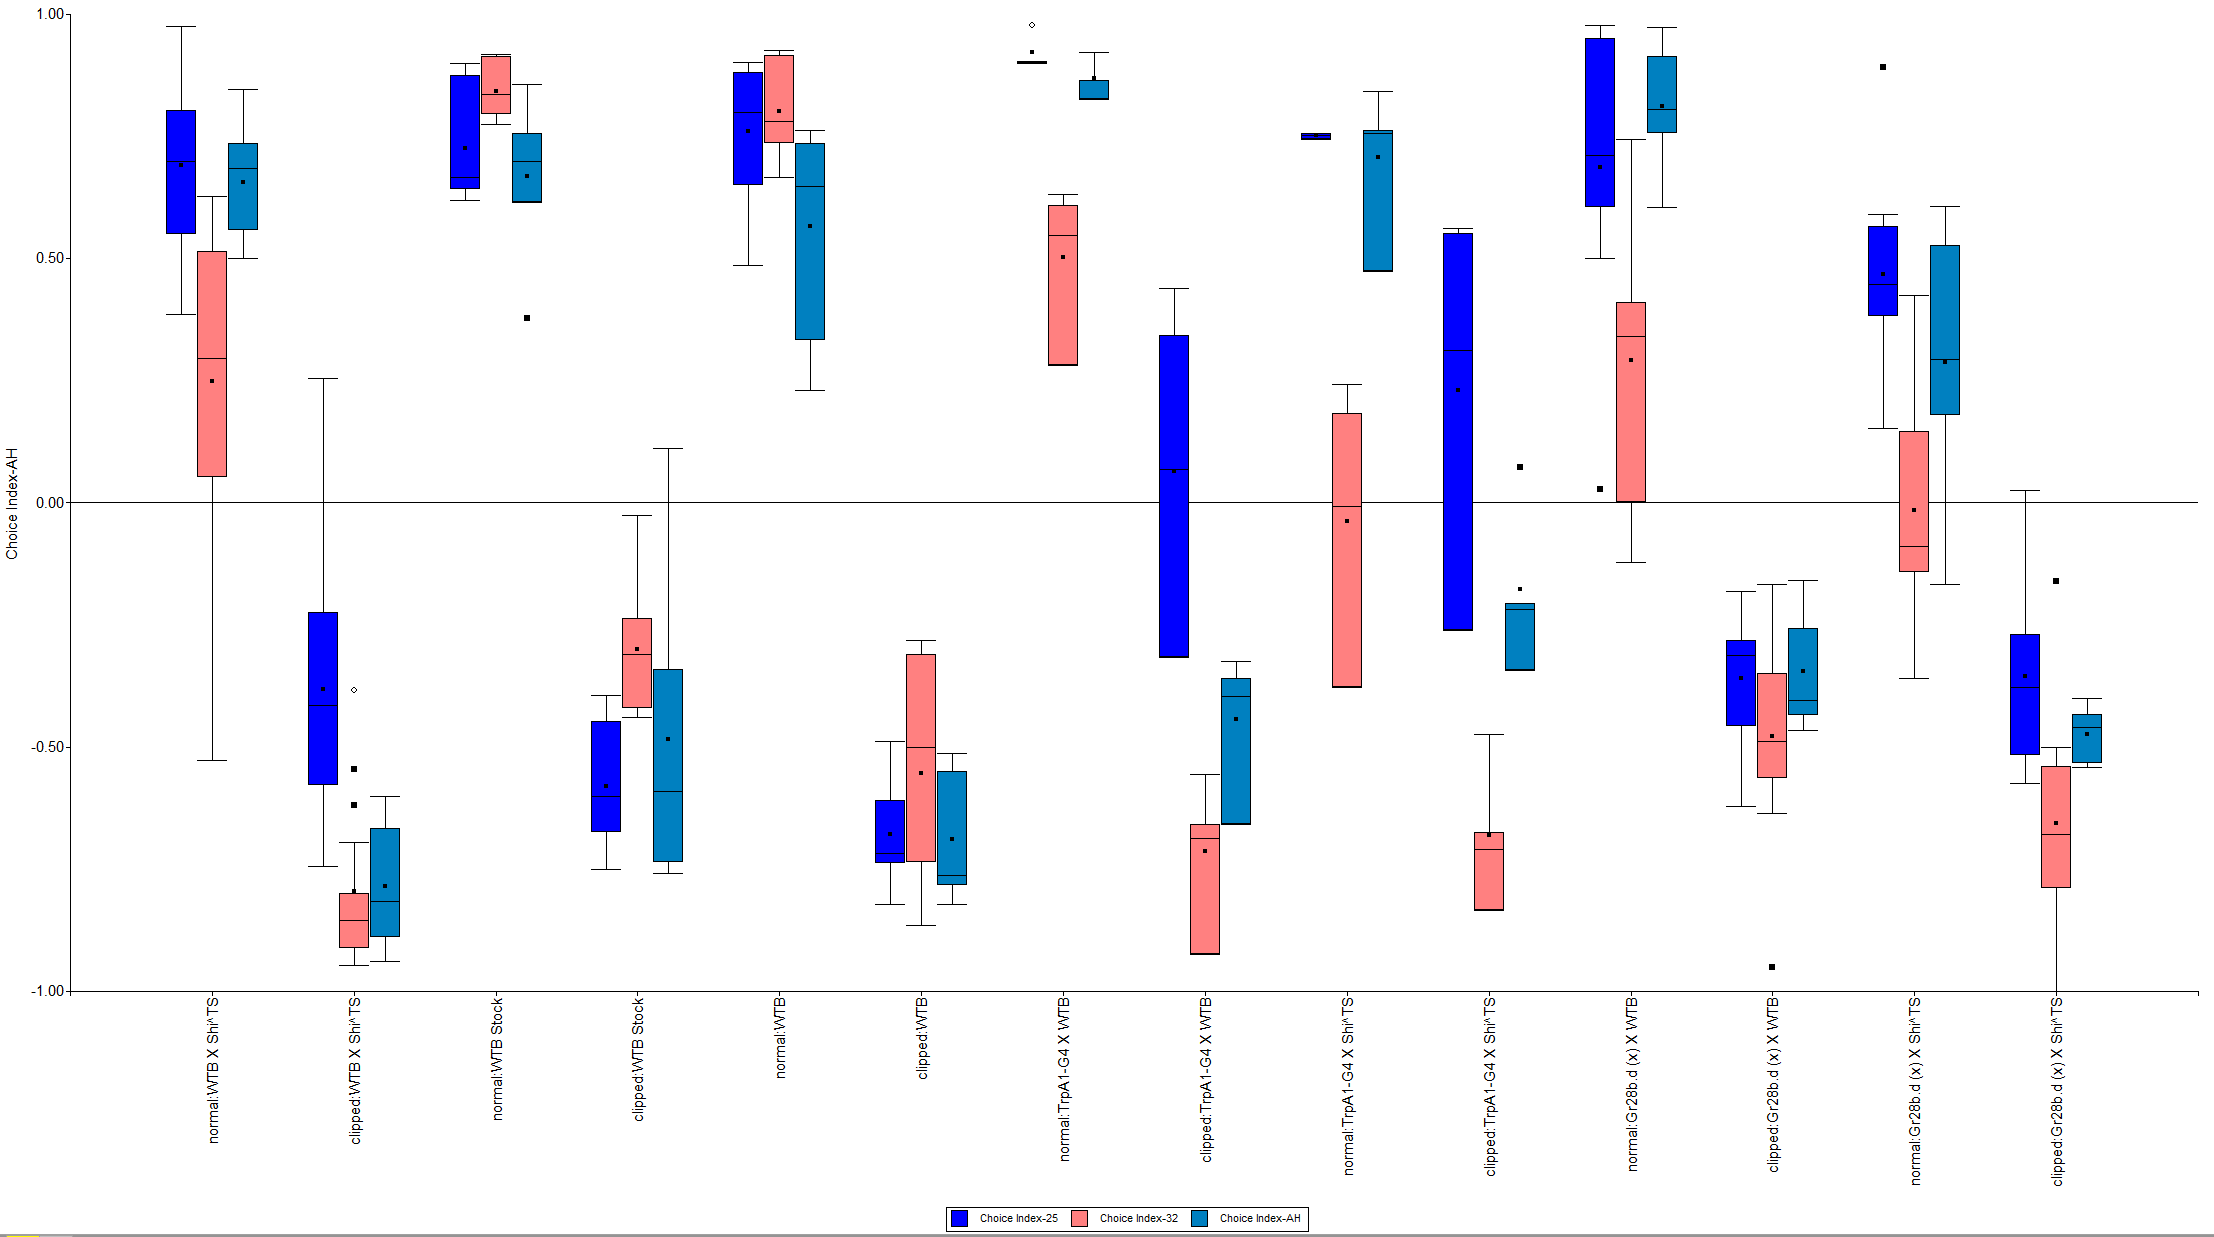
Figure 1: The different genotypes at 25°C, 32°C and back at 25°C
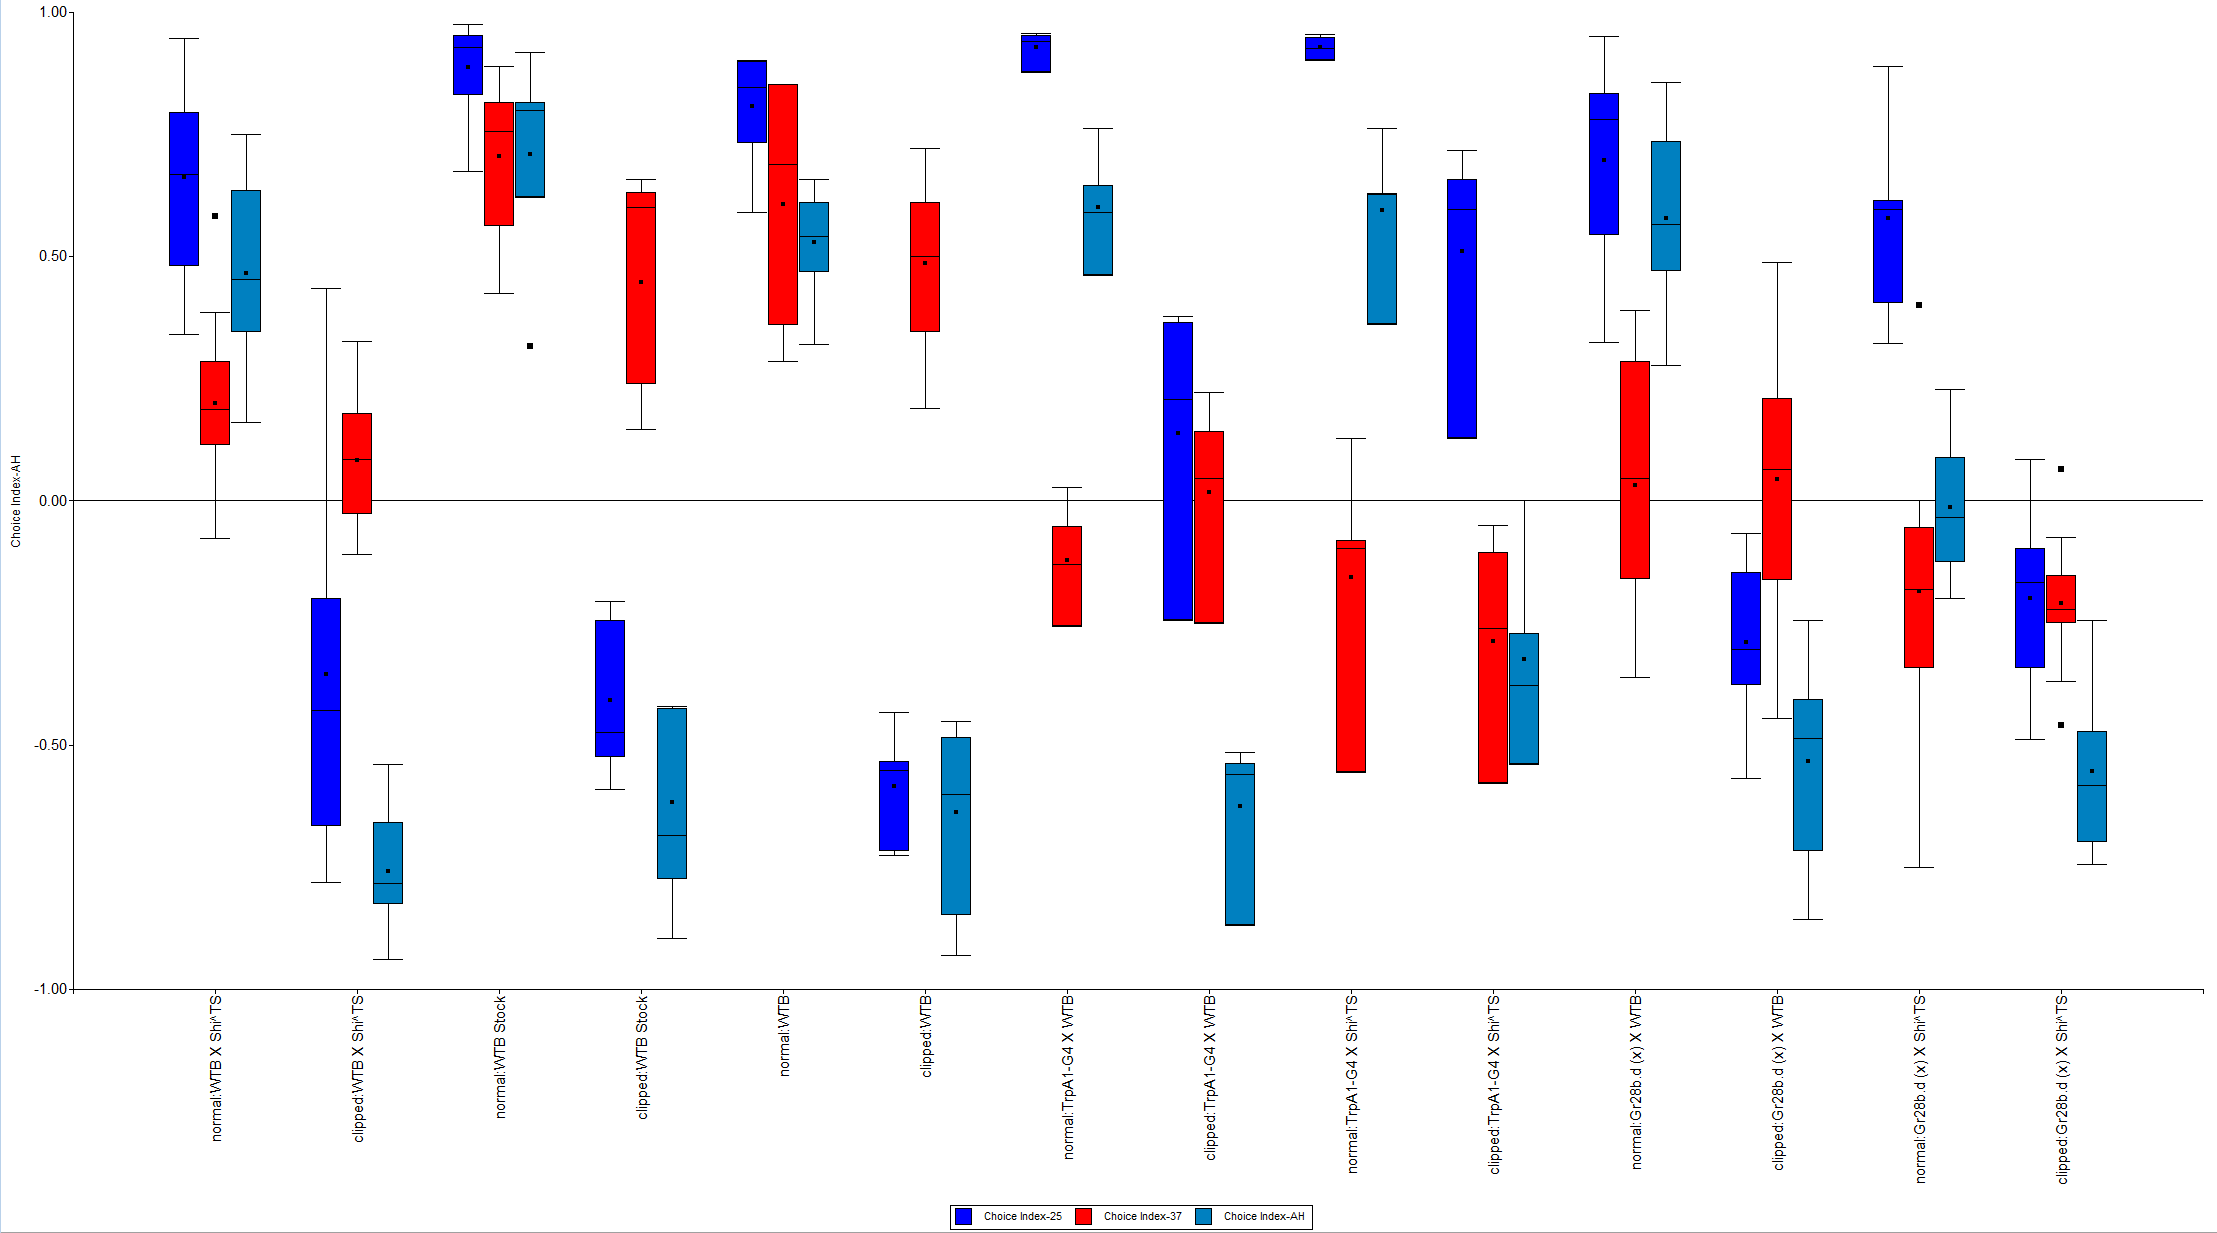
Figure 2: The different genotypes at 25°C, 37°C and back at 25°C
Category: temperature_phototaxis, wing clipping | No Comments
Phototactic flexibility (OA neurons)
on Sunday, November 8th, 2015 8:40 | by Bianca Birk
I tested some more tbh-GAL4 subgroups. Figure 1 shows the newest results of the screen.
Because of the weird results, we decided to make crossbreedings the other way around. For the last crossbreedings I took virgins of the UAS-Shi^TS and males from the tbh-GAL4 subgroups, now I take virgins of the tbh-GAL4s. So in two weeks the first crossbreedings will hatch and I will test them.
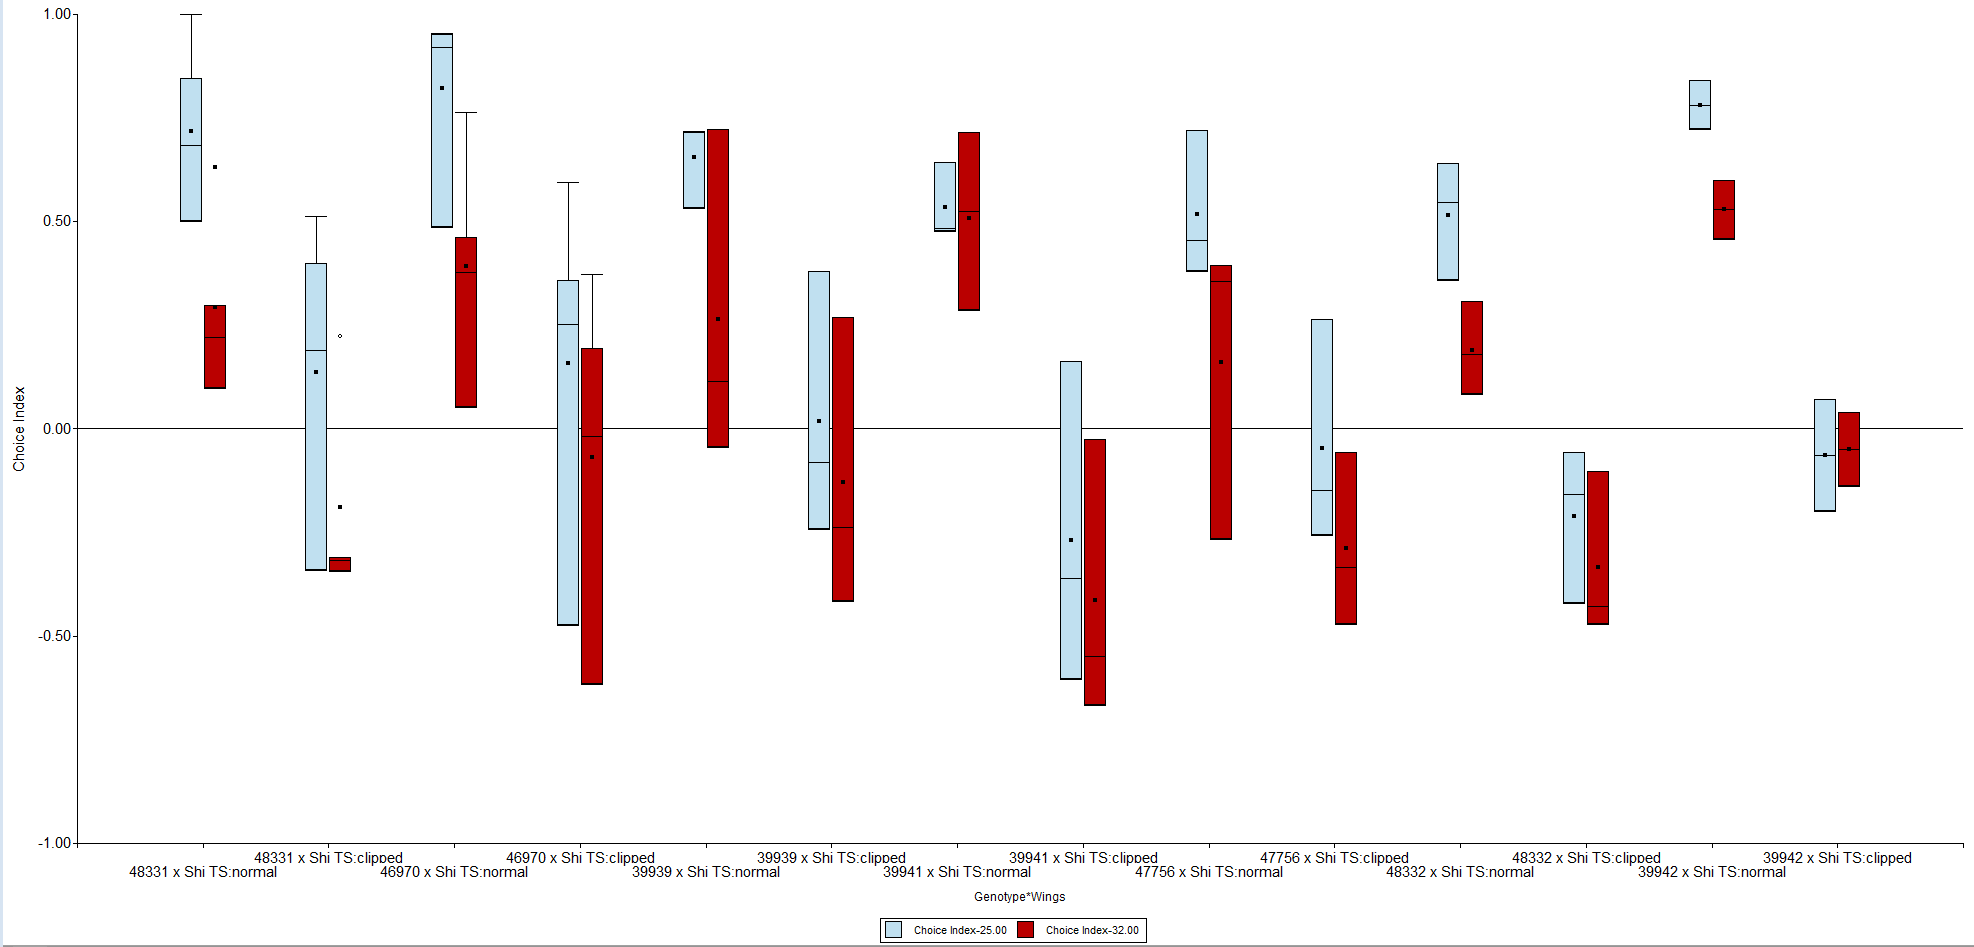
Fig. 1: tbh-subgroups tested at RT and 24 h later at 32°C. All tbh-GAL4 were crossed to Shi^TS virgins
Category: wing clipping | No Comments
Variability of Phototaxis 4: Buridan
on Friday, November 6th, 2015 1:56 | by Isabelle Steymans
In the previous experiment, where all the tubes were tested individually, we saw different distributions between this subgroups. Therefor I wanted to test the activity and in particular the speed of single flies of each of this subgroups, to see if this result could be explained by a difference of these parameters. For that I started doing first the Benzer-paradigm to split the flies. Then I took random flies of each of the 6 tubes, cut their wings under cold-anesthesia with 24 hours recovery and after that, tested them in the Buridan.
Below there are the transitionplots of all the different tubes tested (Fig.1-Fig.6). You can see that the flies of the different subgroups seem to have quite similar Transitionplots.
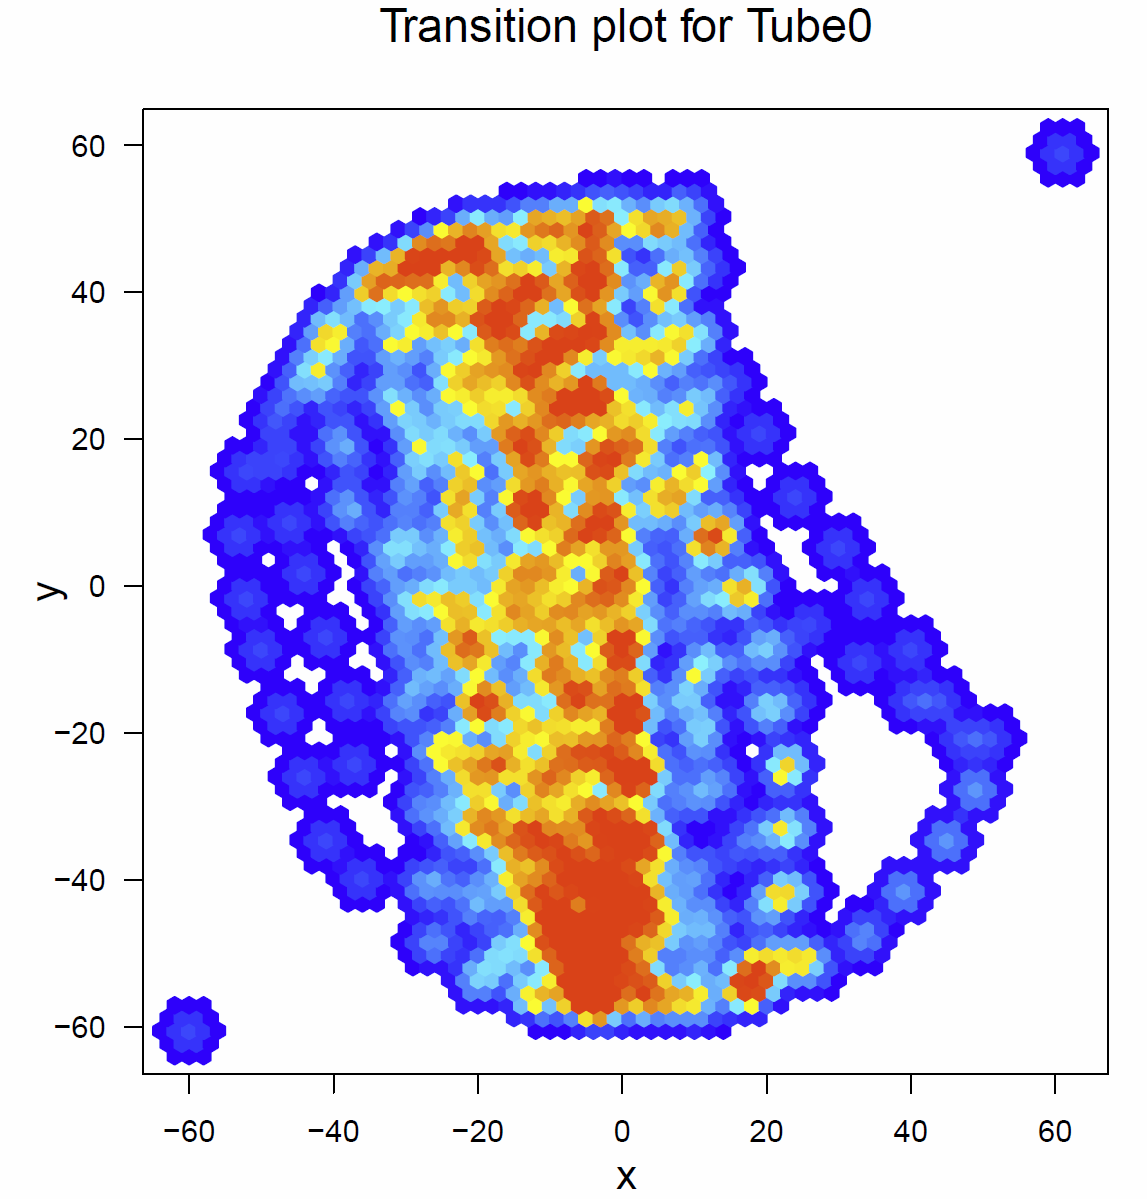
Fig.1 Transitionplot for tube 0
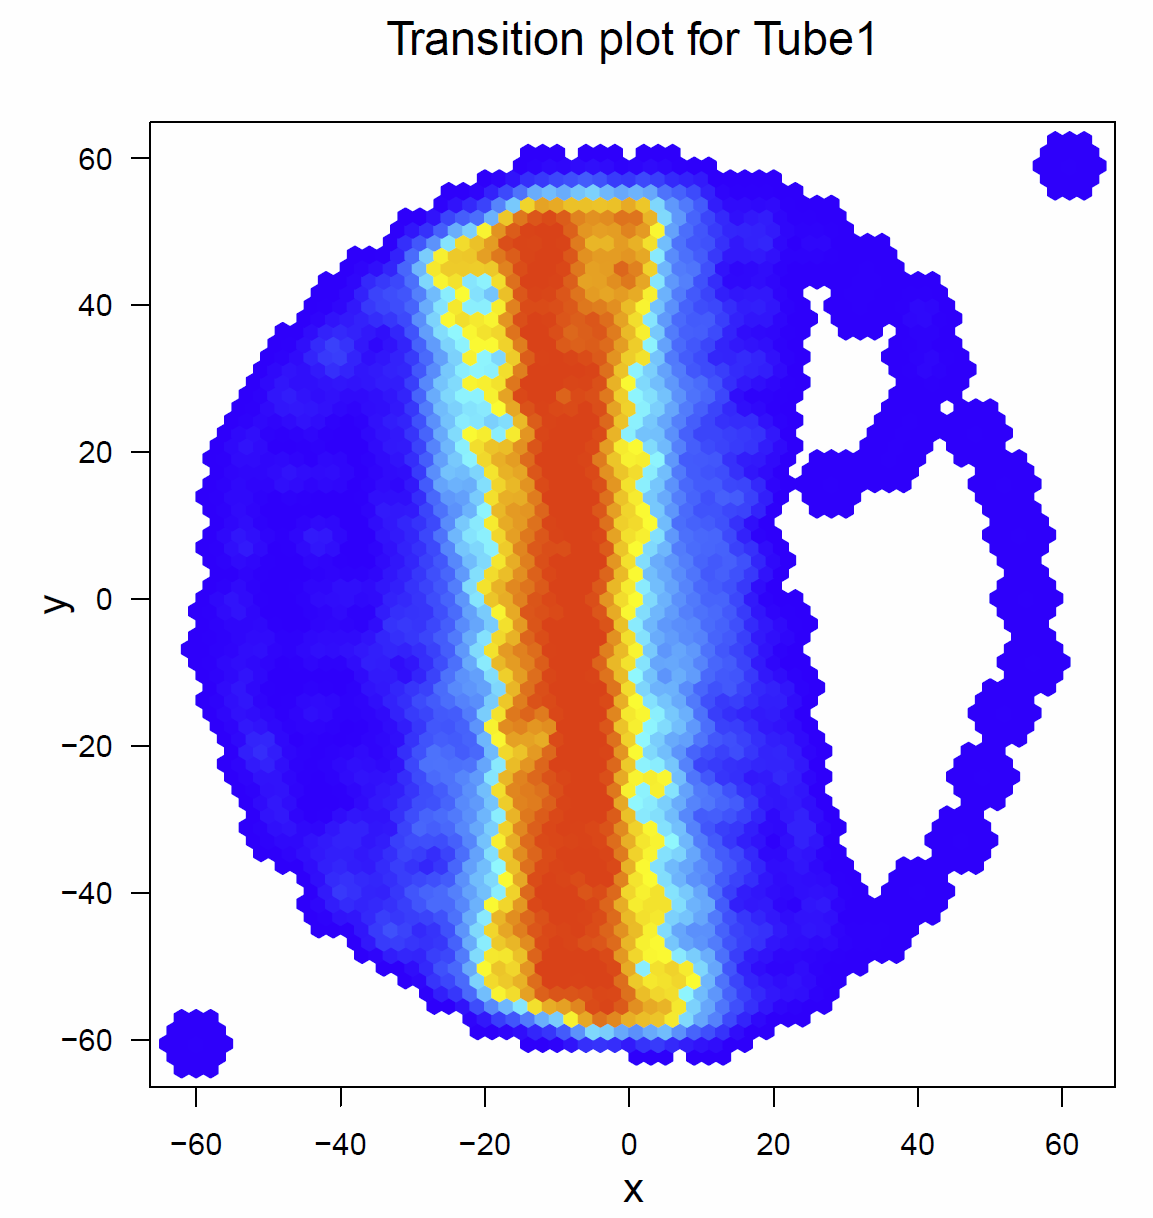
Fig. 2 Transitionplot for tube 1
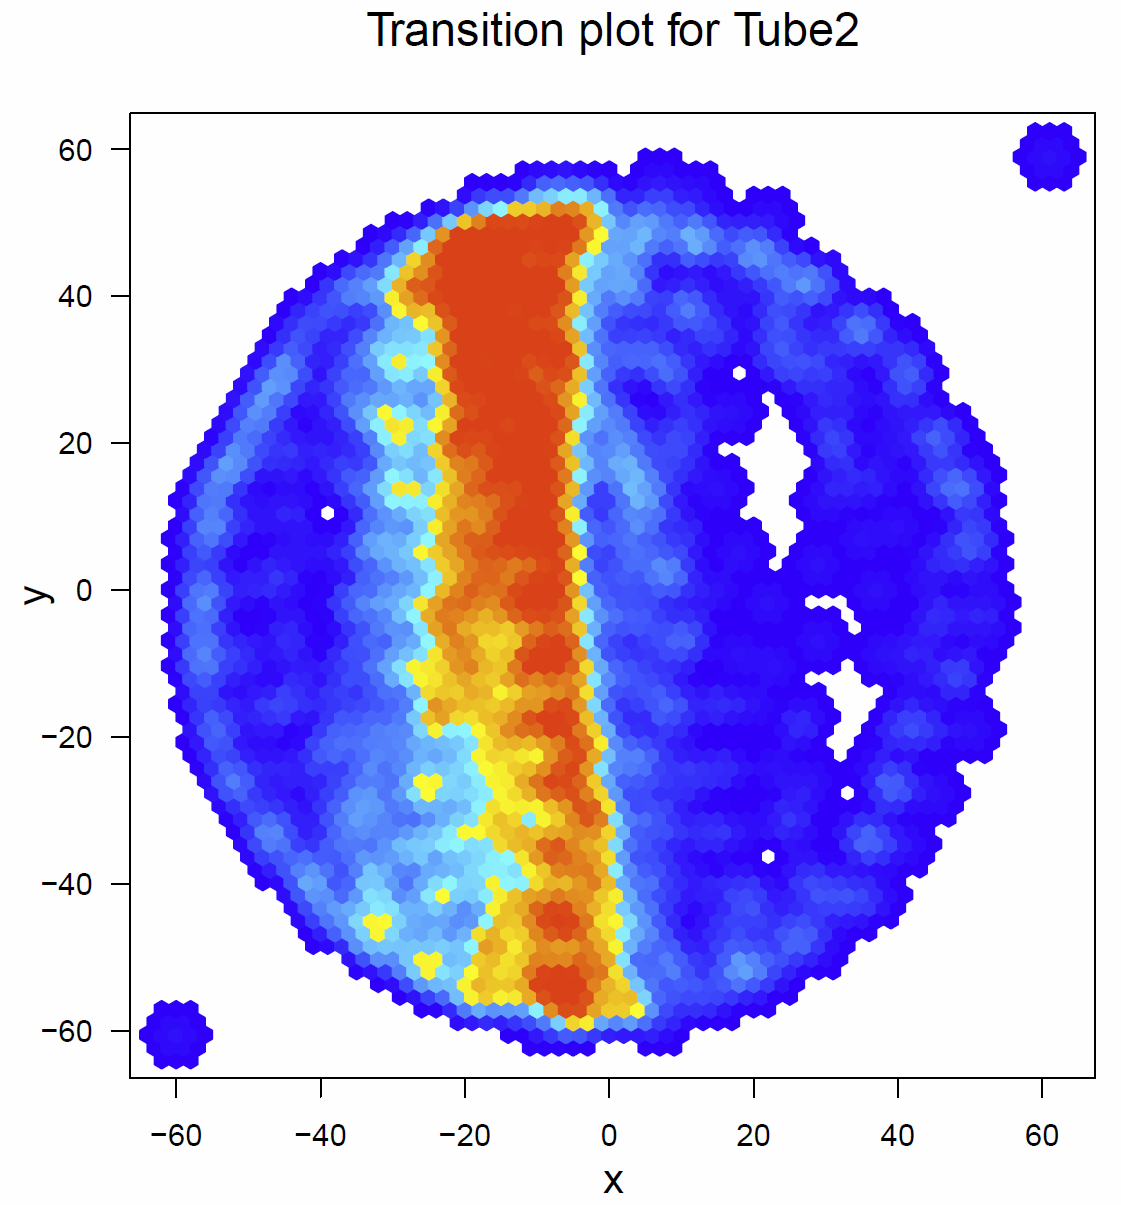
Fig. 3 Transitionplot for tube 2
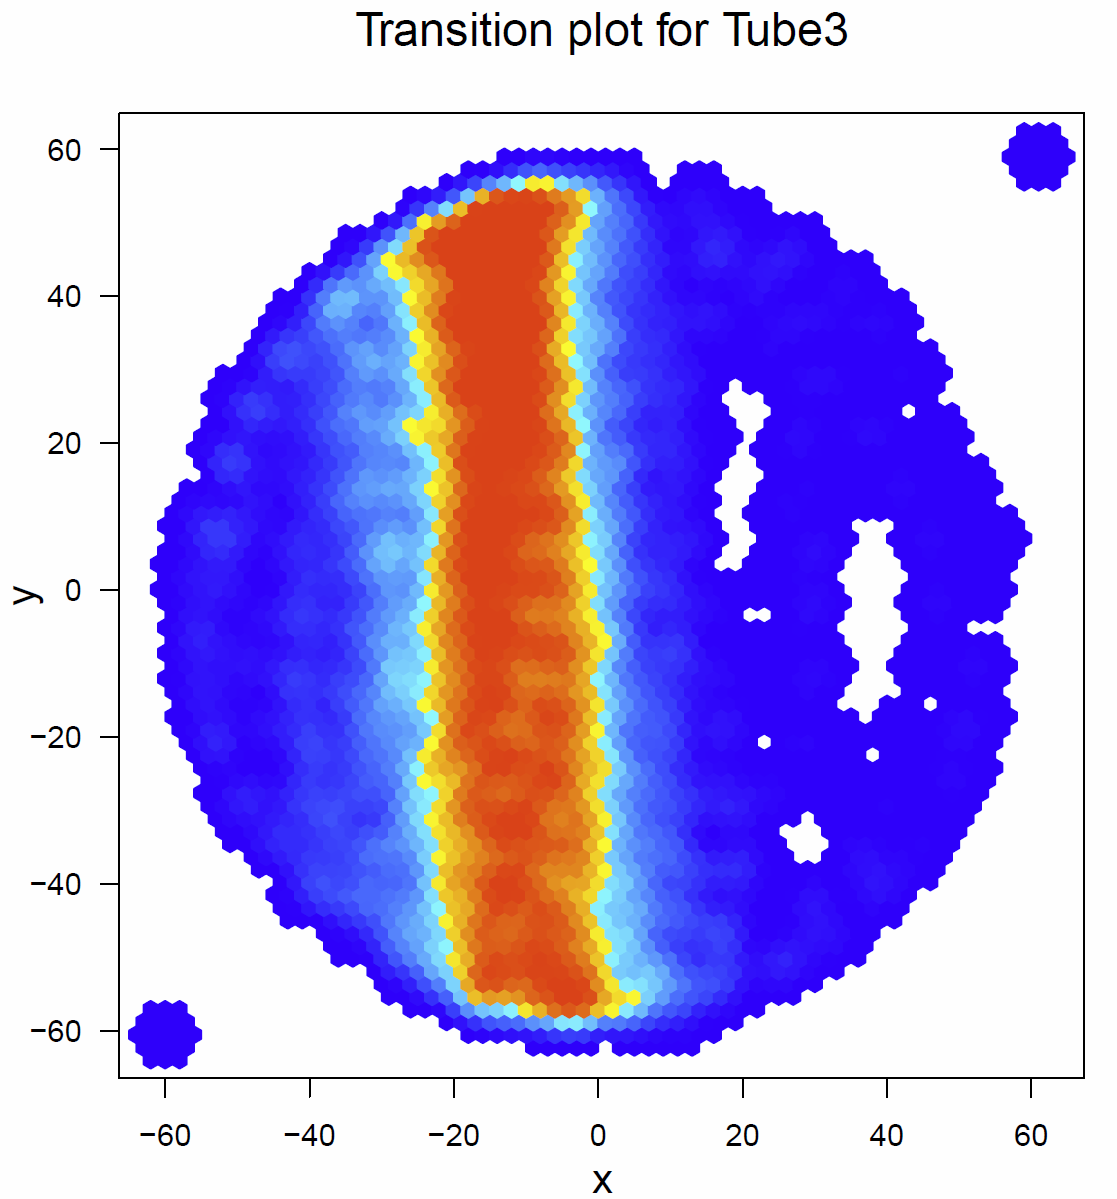
Fig. 4 Transitionplot for tube 3
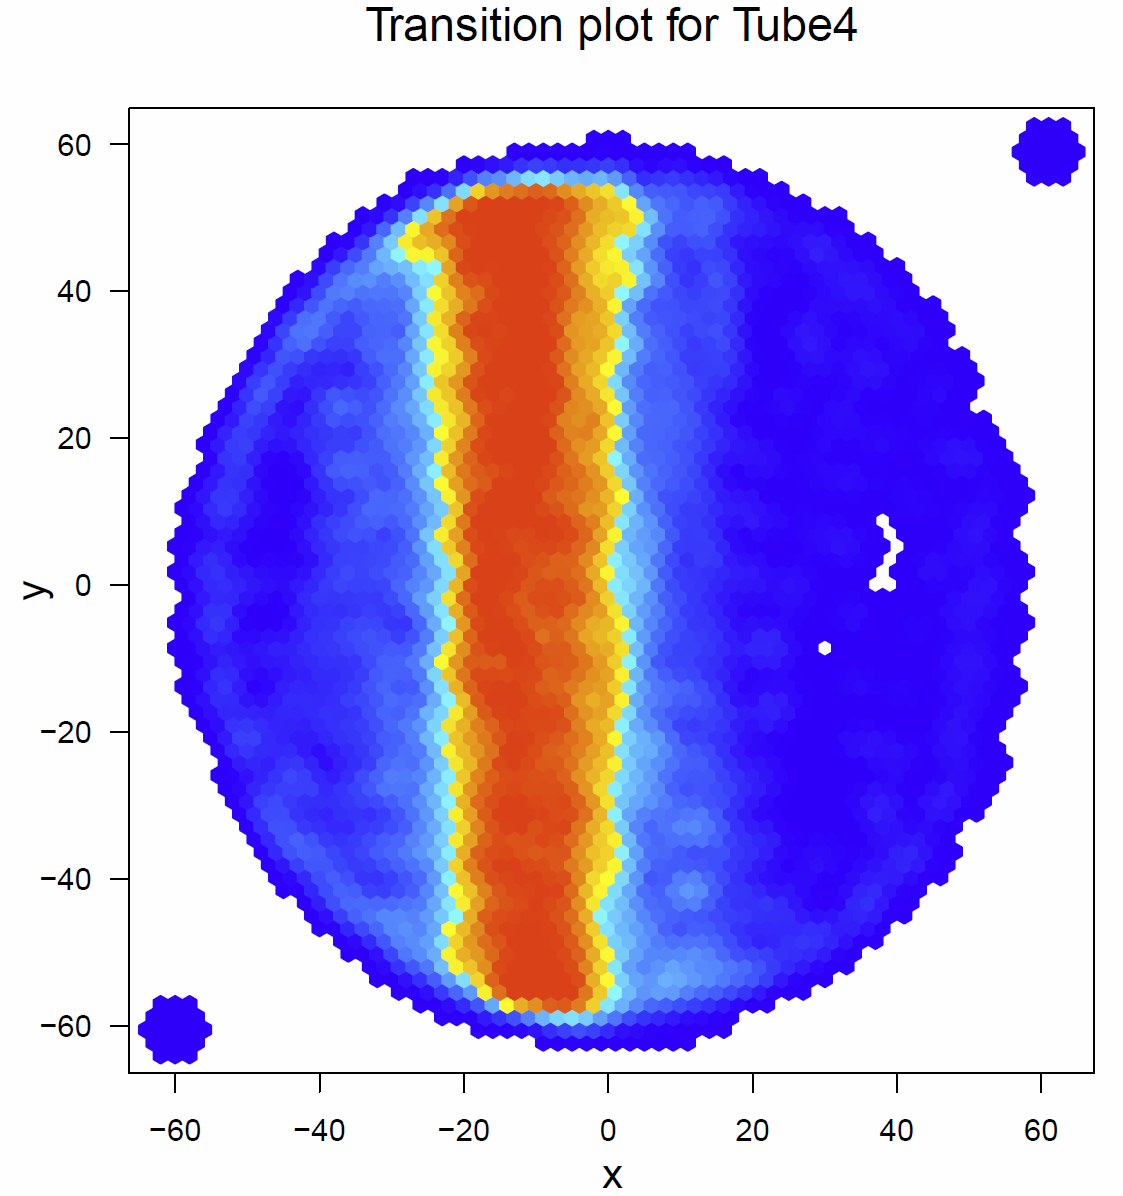
Fig. 5 Transitionplot for tube 4
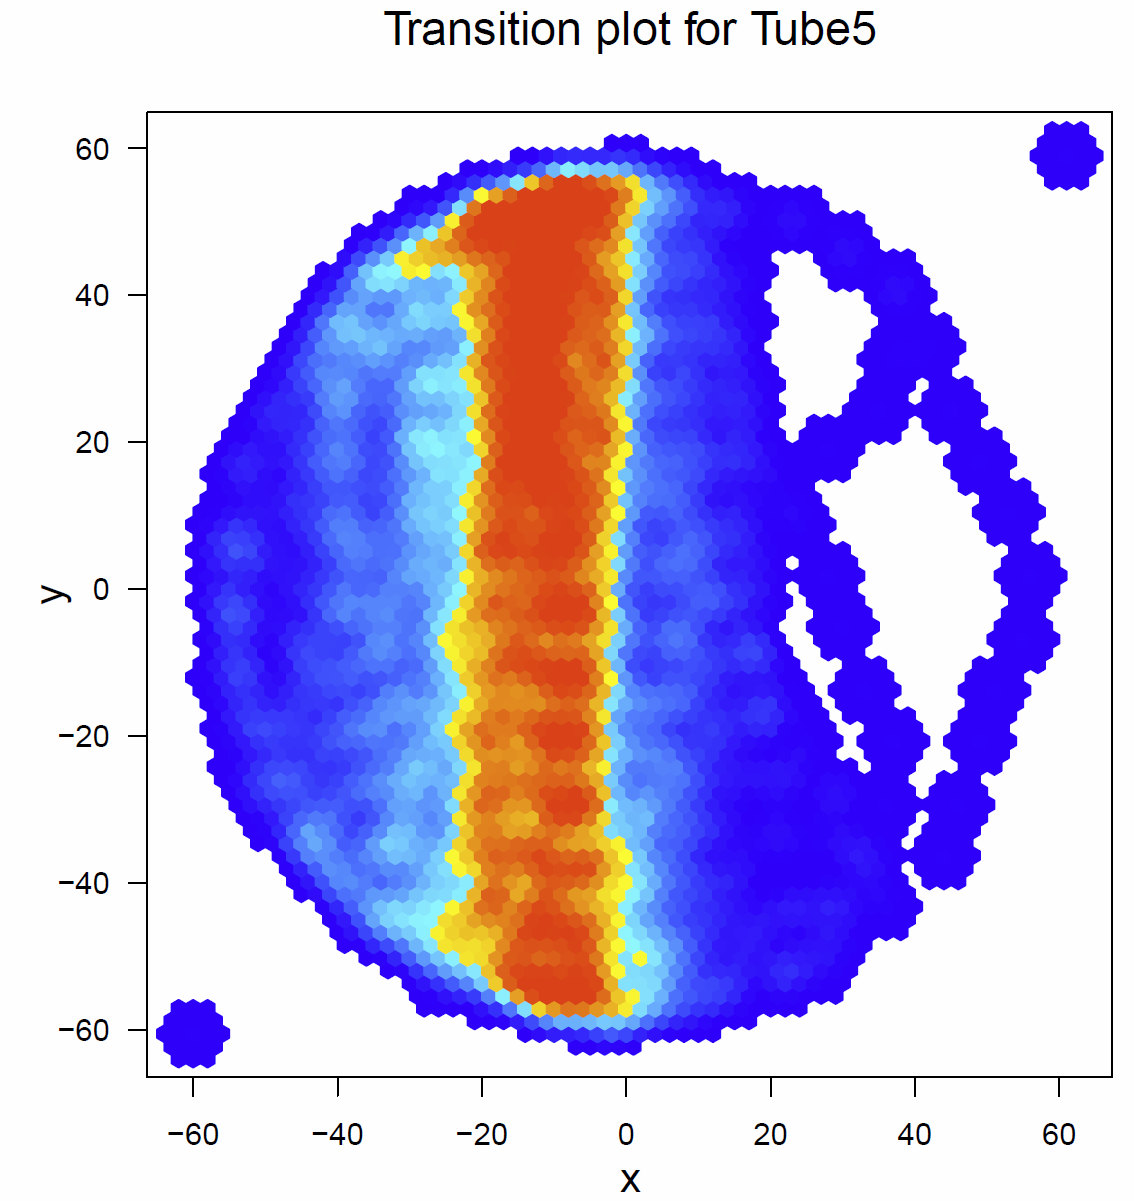
Fig. 6 Transitionplot for tube 5
In addition I had a look on the activitytime per minute (Fig.7+8), the distance traveled per minute (Fig.9), the pause duration and lengh (Fig.10+11), the number of pauses (Fig.12+13) and the median speed (Fig.14). All activity metrics were calculated in two different ways, the first computation (time-threshold: TT) considers every movement as activity and every absence of movement lasting longer than 1 s as a pause. The second approach (speed threshold: ST) uses the distance traveled by the fly in a sliding window of 1 second duration, measuring its mean velocity during that second.
The activitytime of the flies of the tubes 1, 2,3 and 5 is very similar, however in the tubes 0 and 4 it seems to be more elevated. (Fig. 7+8) If we compare these results to the traveled distance (Fig. 9) we see that tubes 4 shows a higher distance as well, tube 0, in this case, is more similar to the tubes 1, 2,3 and 5. For the flies of tube 4 this can be explained by the pause duration and the number of pauses per minute (Fig. 10+12+12) because they show less pauses per minute and a slightly reduced duration of this pauses. In addition we see that the median speed (Fig.14) is lower in the flies of the tube 0, the rest of the tubes are quite similar.
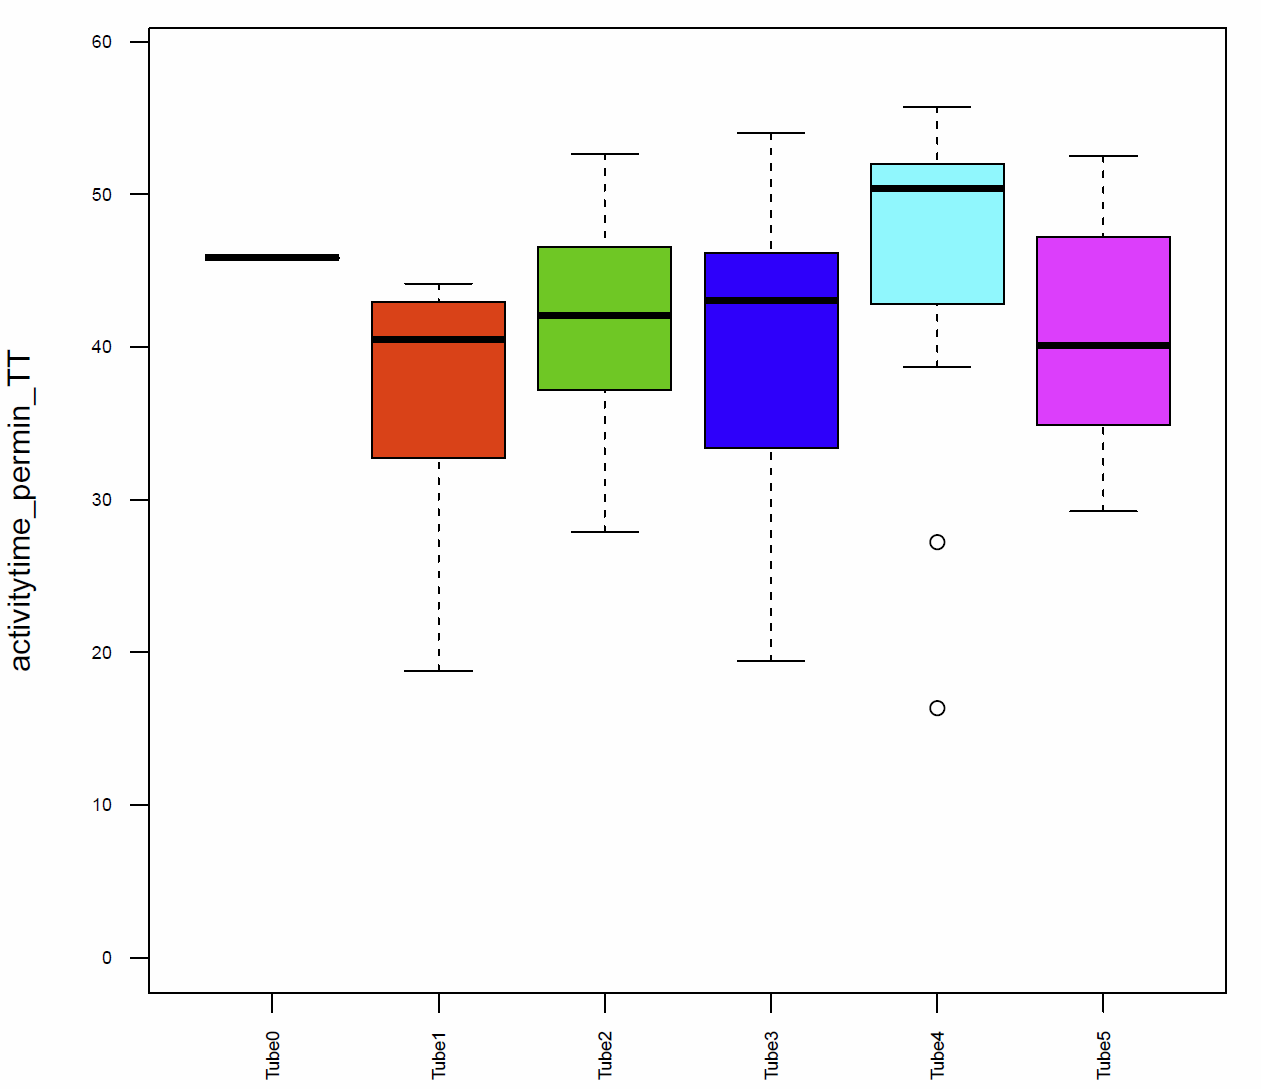
Fig. 7 Activitytime per min TT
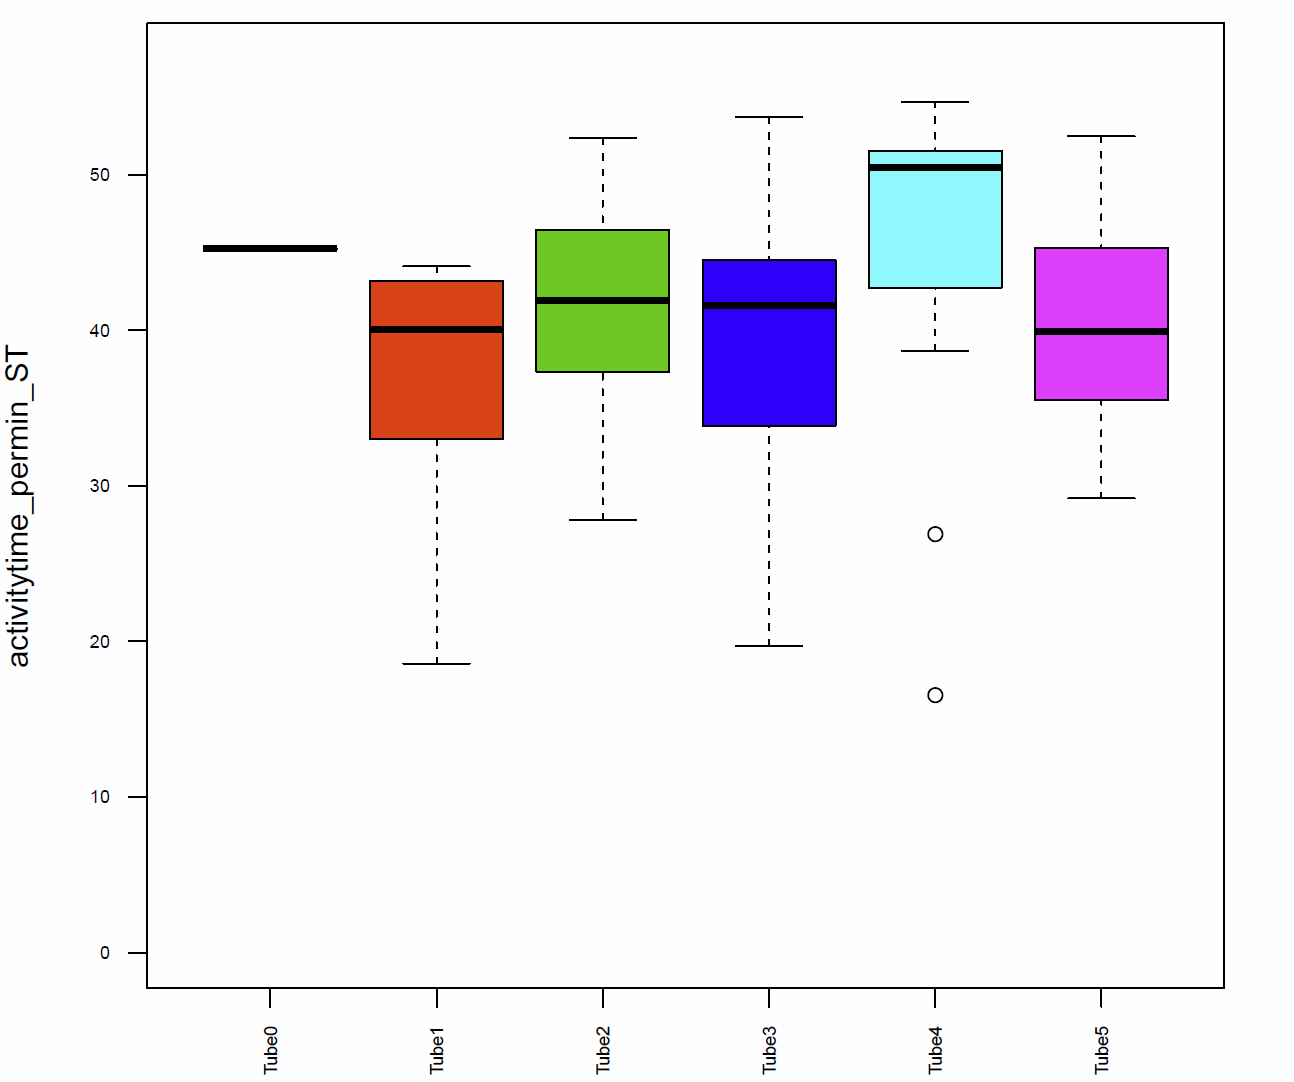
Fig. 8 Activitytime per min ST
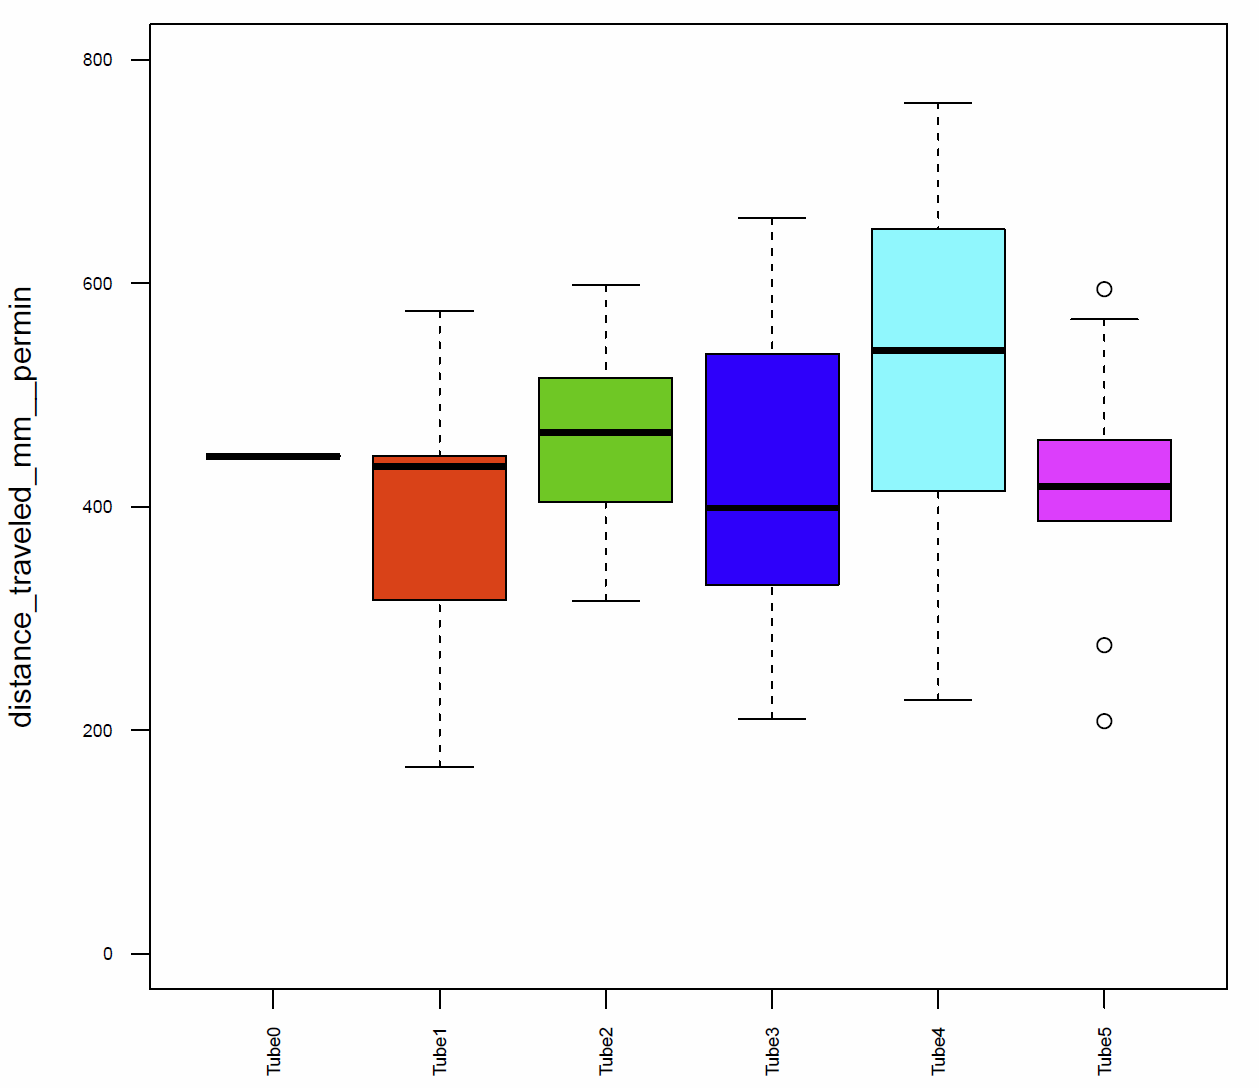
Fig. 9 distance traveled per min
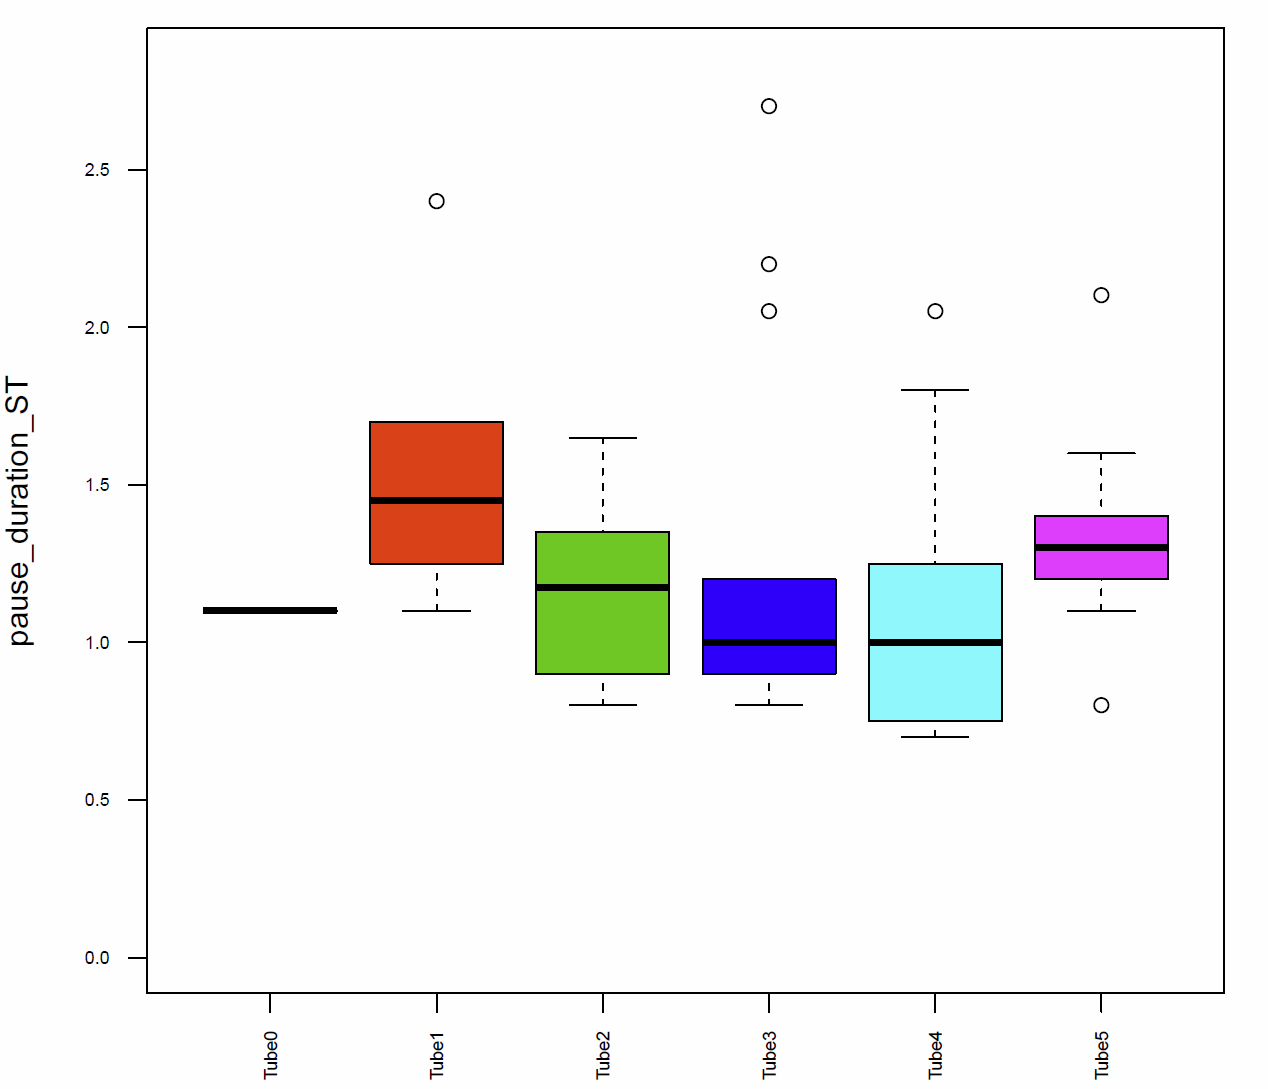
Fig. 10 pause duration ST
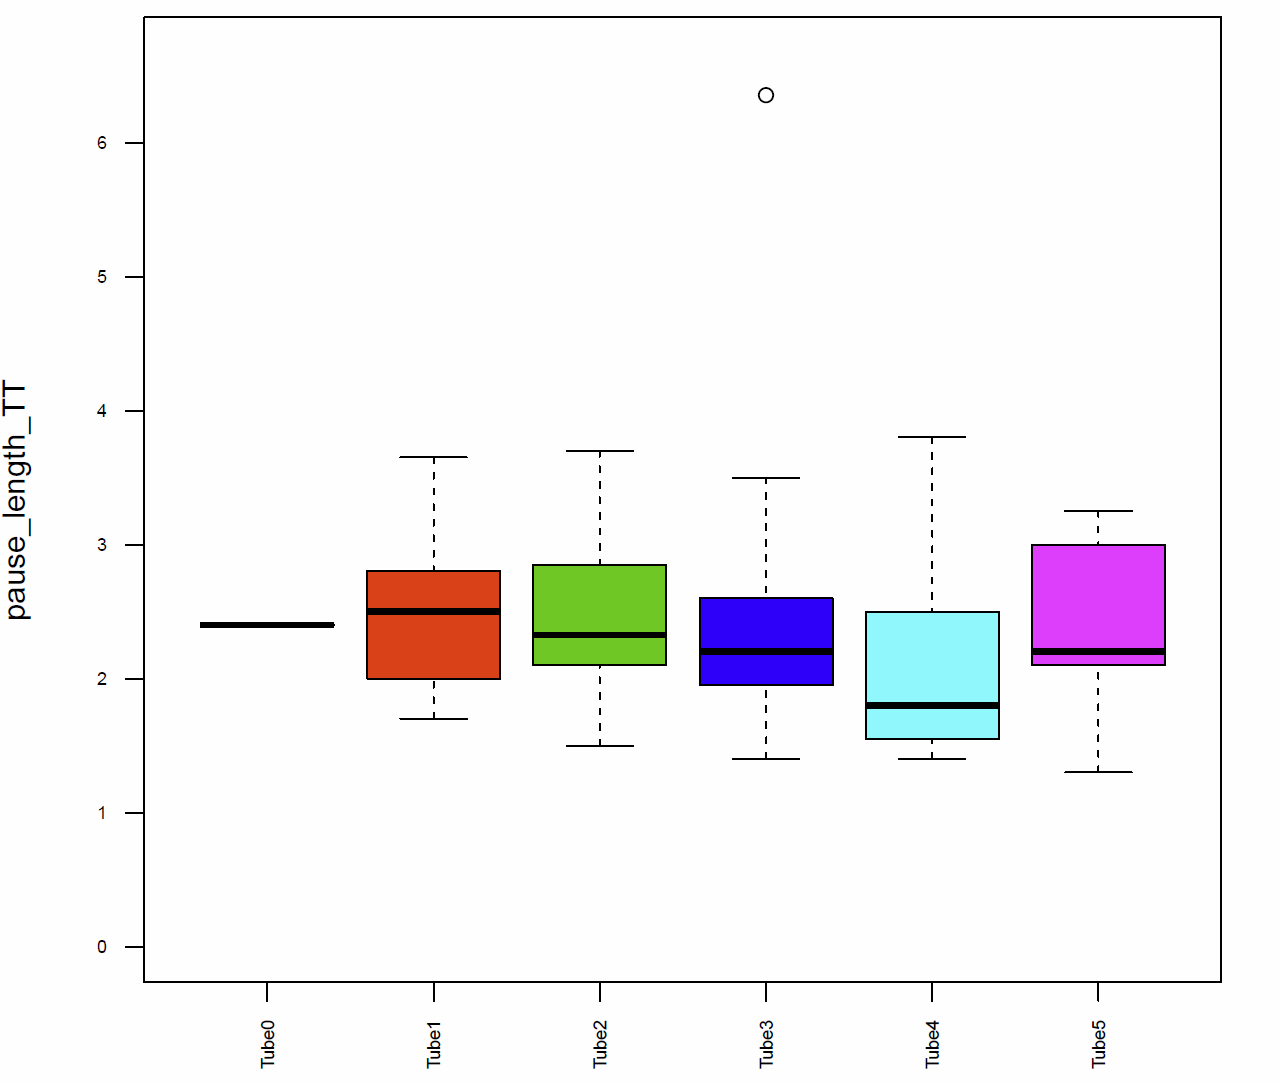
Fig. 11 Pause lengh TT
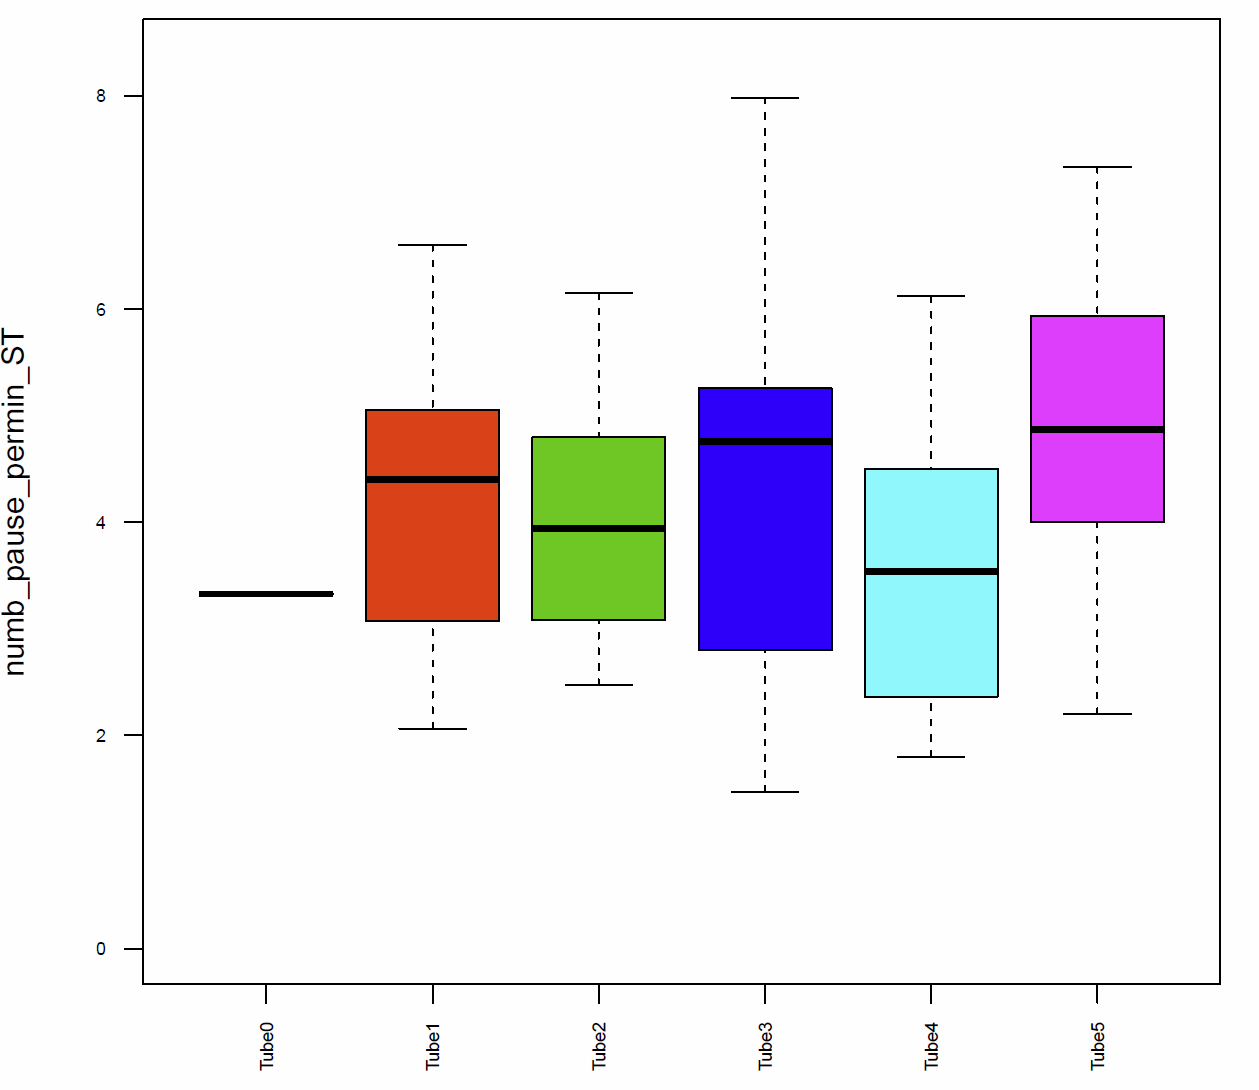
Fig. 12 number of pauses per min ST
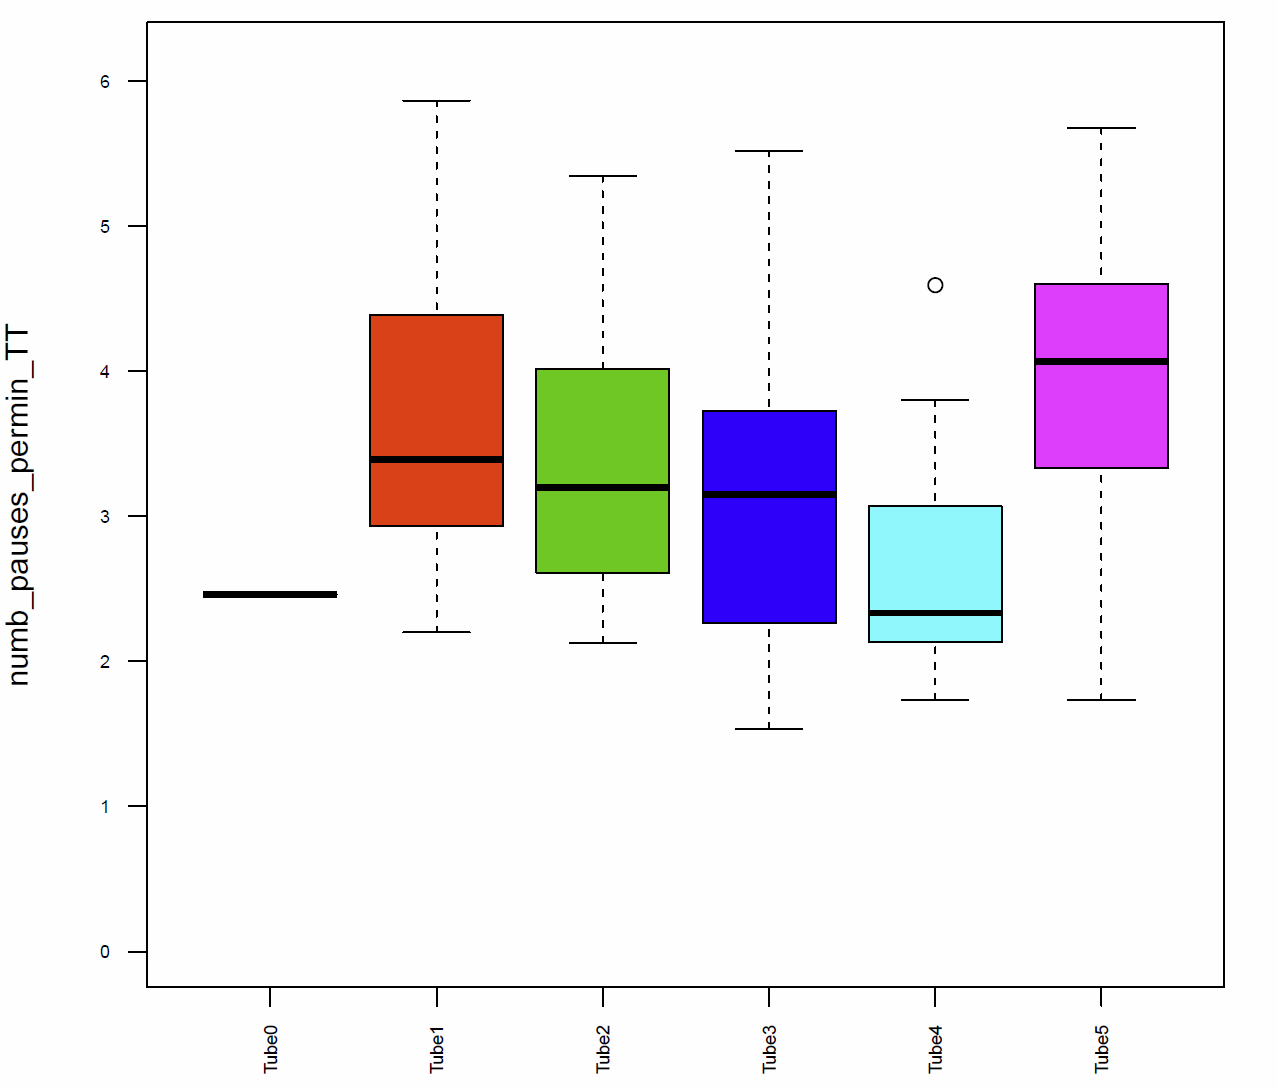
Fig. 13 number of pauses per min TT
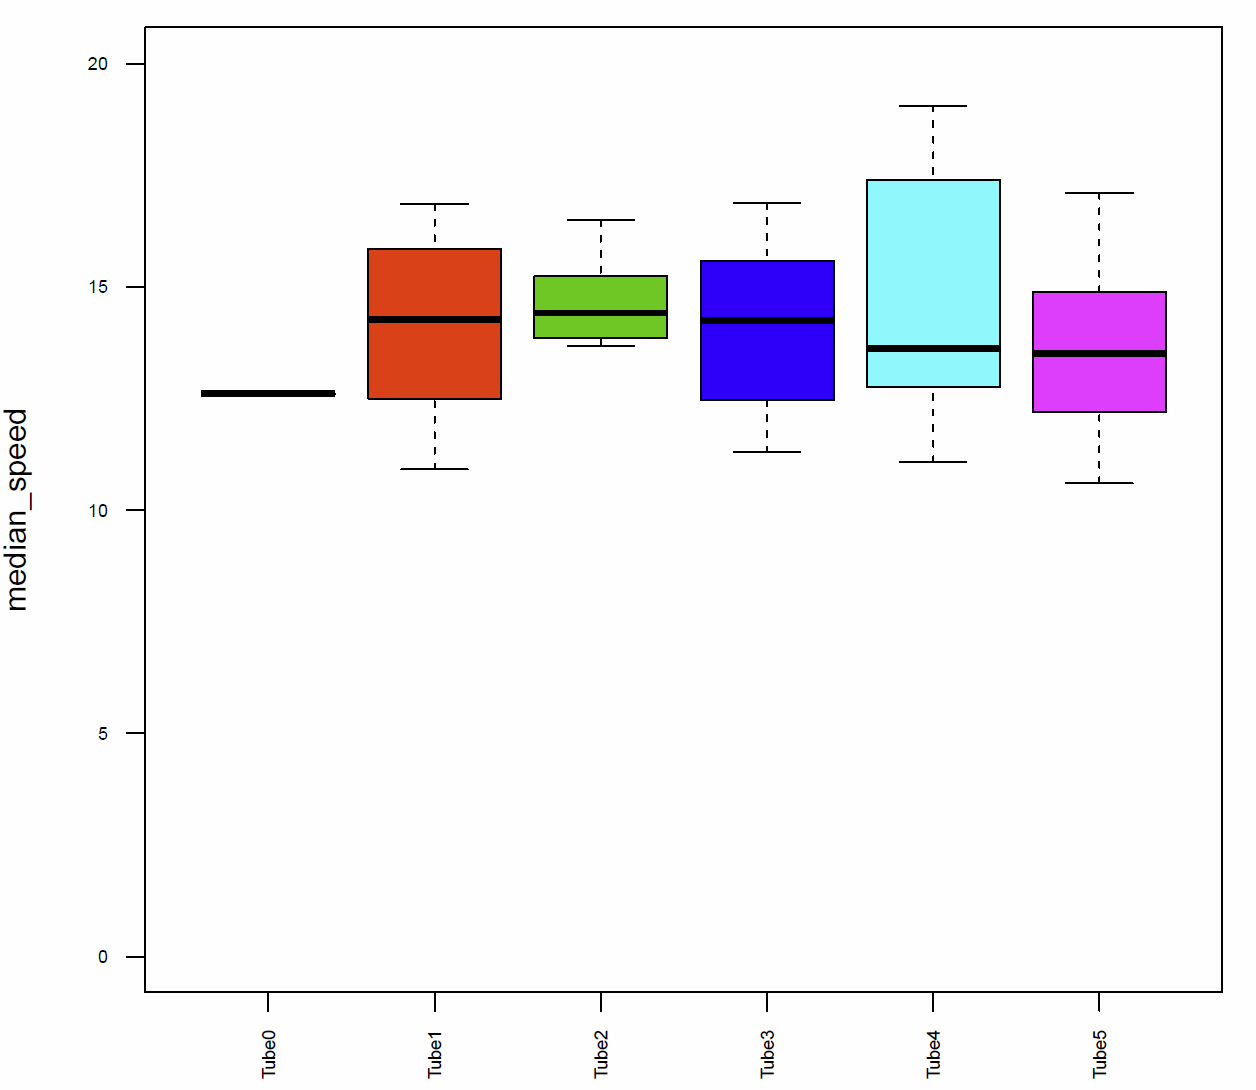
Fig. 14 median speed
Temperature Impact on Phototactic Behavior – Gr28b.d(X) and TrpA1
on Friday, November 6th, 2015 11:33 | by Amelie Roedel
I tested the crossbreedings I did to test how flies behave according to light at different temperatures. The controls I use for this project are WTB x ShiTS, Gr28b.d(X) x WTB and WTB. For the TrpA1 flies I use WTB x ShiTS and TrpA1 x WTB. The genotypes that are supposed to show the change in the behavior are Gr28b.d(X) x ShiTS and TrpA1 x ShiTS.
As the flies do not behave as they are supposed to (see figure 1 & 2), I’ll start testing the genetic background of different wildtypes to see if that has something to do with the wrong change in the behavior.
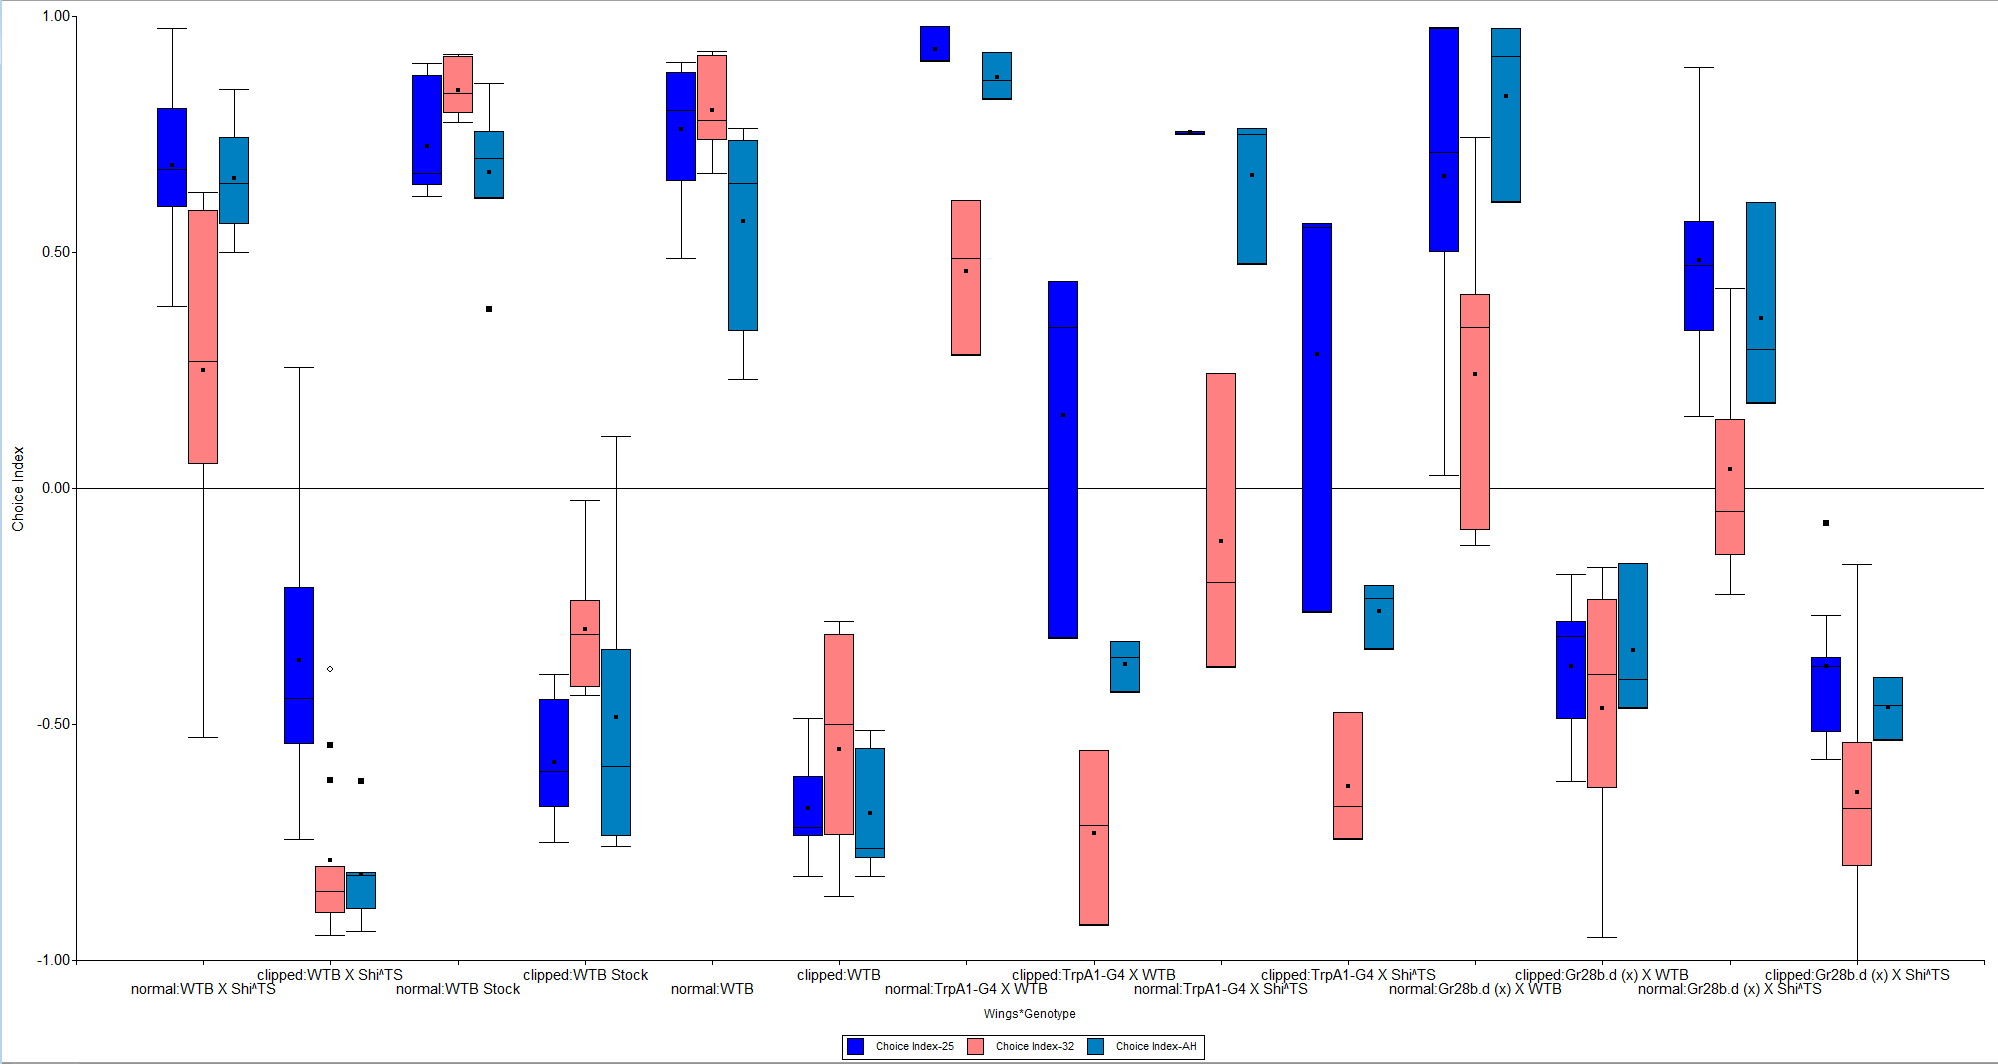
Figure 1: different genotypes testet at 25°C, 32°C and back at 25°C
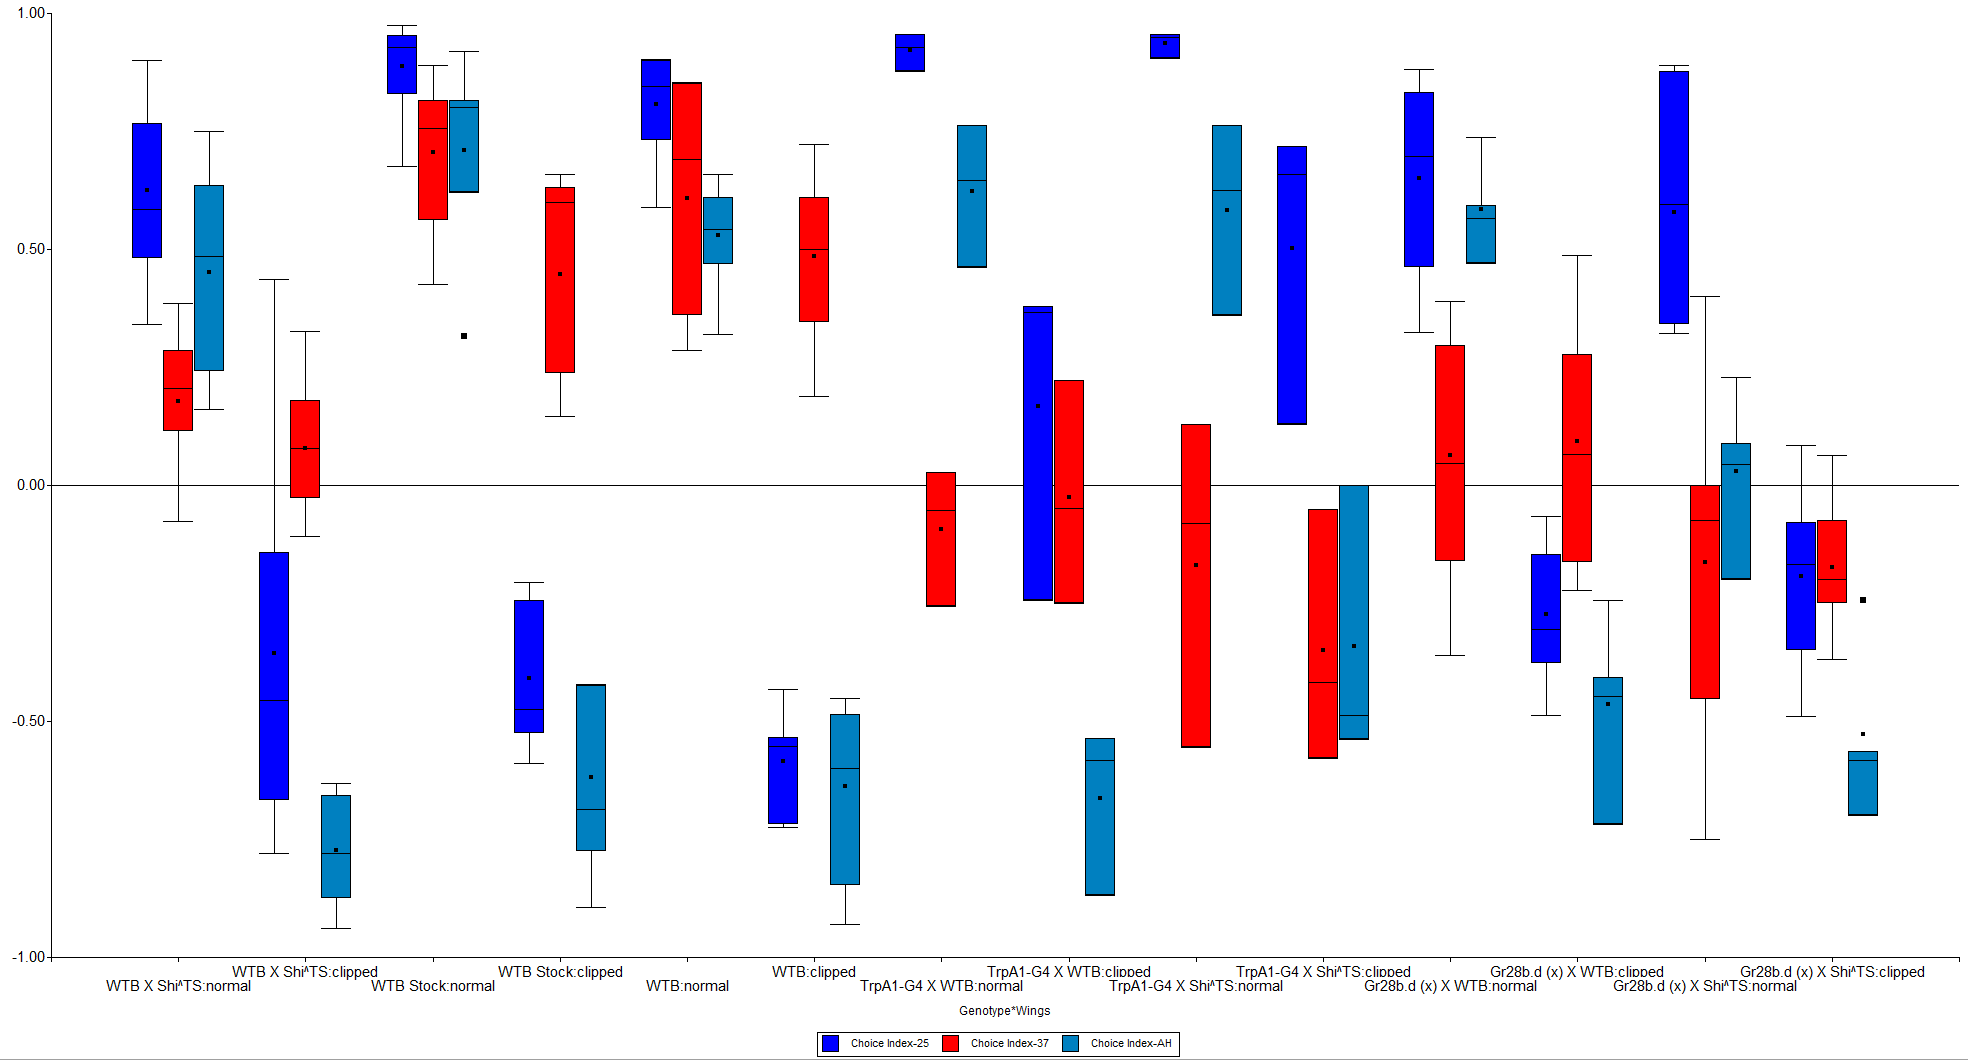
Figure 2: different genotypes tested at 25°C, 37°C and back at 37°C
Category: temperature_phototaxis, wing clipping | No Comments
Phototactic flexibility (OA neurons)
on Monday, November 2nd, 2015 12:17 | by Bianca Birk
I tested some more tbh-GAL4 crossed to shibire^TS. These are the newest results of the screen.
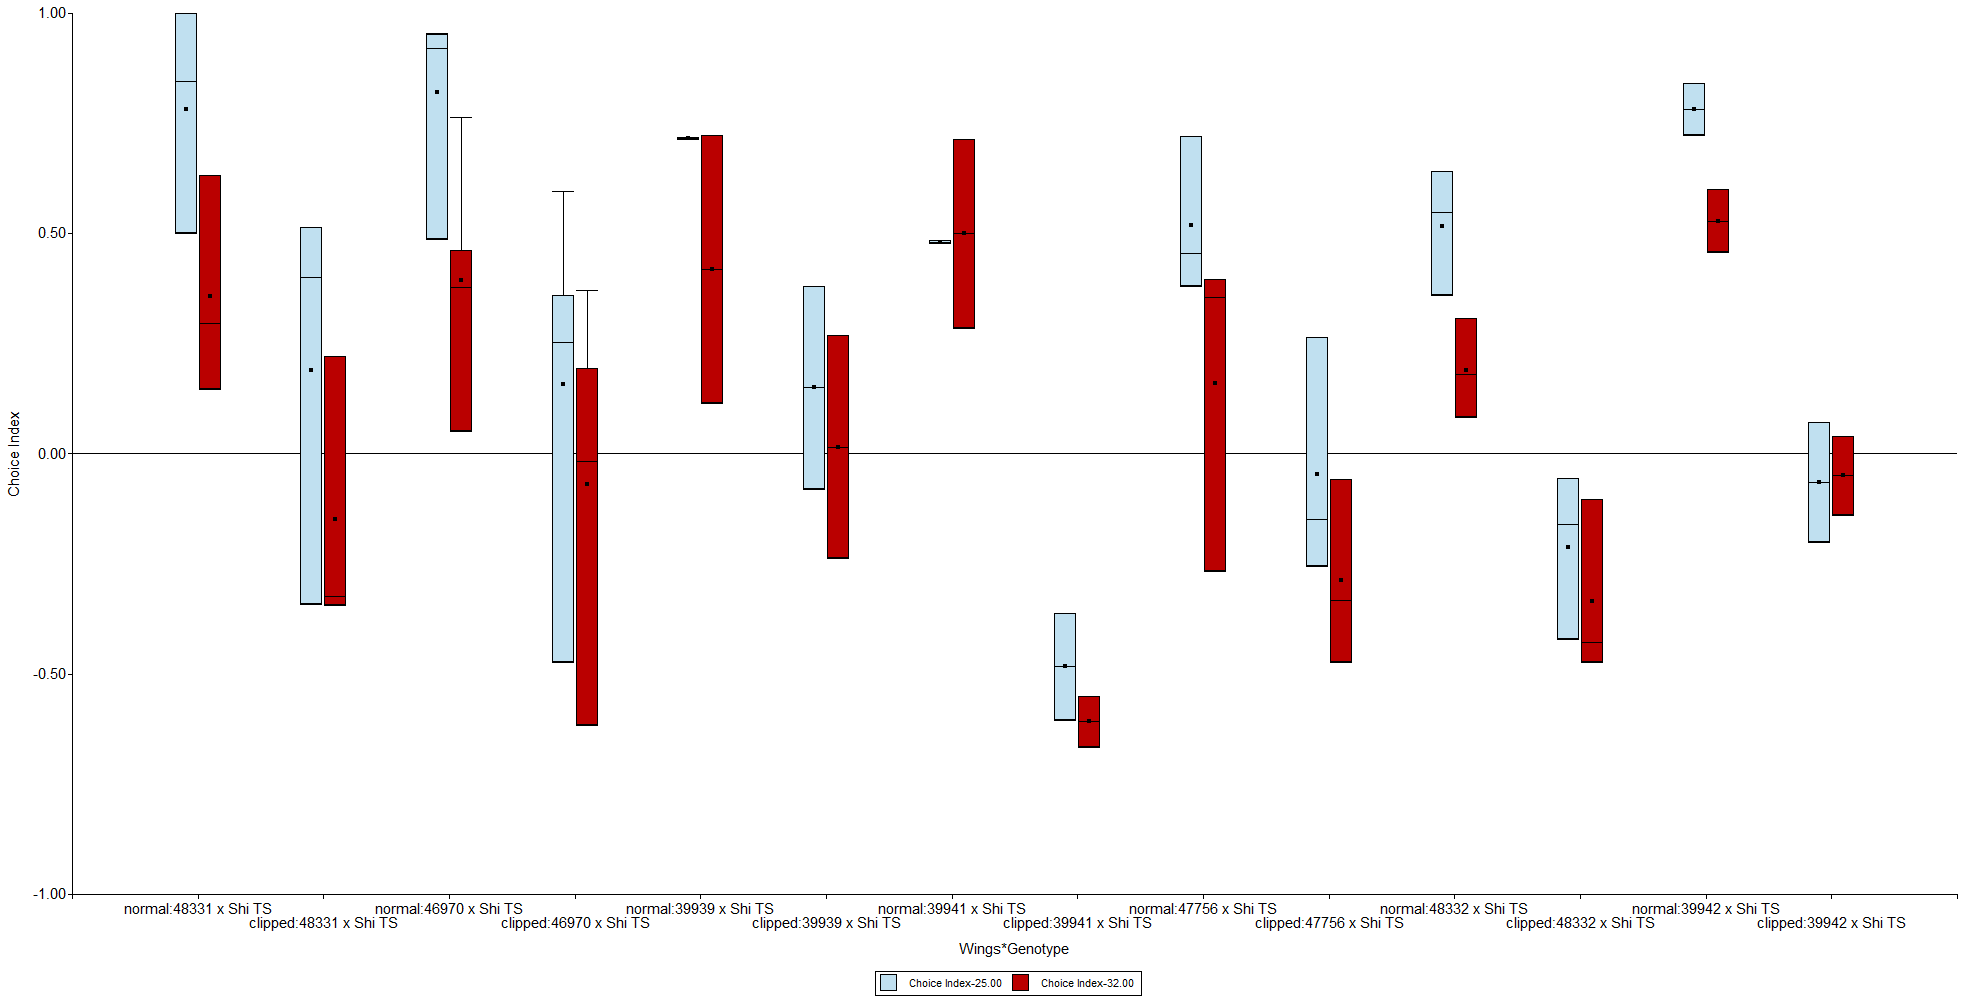
Figure 1: tbh-GAL4 subgroups tested at RT and at 32°C (n(39939, 46970) = 4; n(47756,48331) = 3; n(39941,39942) = 2)
Category: wing clipping | No Comments
Phototactic flexibility (OA neurons) & Staining of ChaG80;ThG4
on Monday, October 26th, 2015 2:49 | by Bianca Birk
Phototactic flexibility
I continue testing the tbh-Gal4 subgroups and tbh-lexA.
Figure 1 shows the newest results of tbh-lexA (n=6)
Figure 2 shows the newest results of tbh-Gal4 (tbh48331, tbh46970 n=3, tbh39942 n=1, rest with a n of 2)
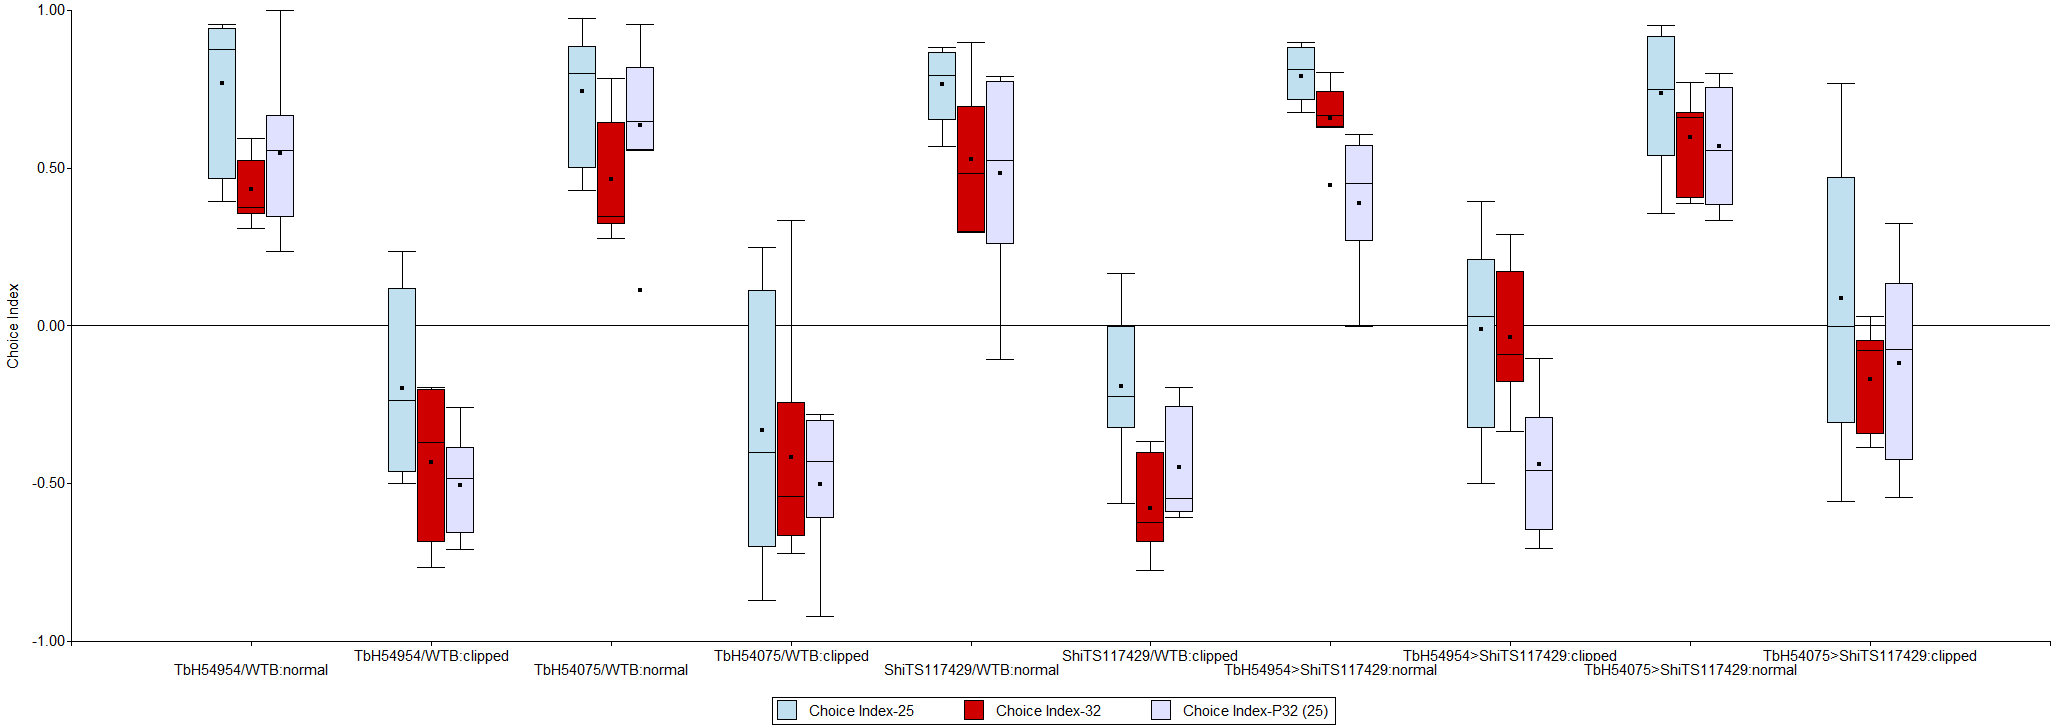
Figure1: tbh-lex A tested at RT -> 32°C -> RT

Figure 2: tbh subgroups tested at RT and 32°C
Stainings
I practiced the dissections of brains for stainings. So I fixed the flies for one hour in PFA 4% , then I dissected the brains, washed them a few times with PBST and after it I mount them with vectashield.
Figure 3 shows a picture of a brain of a Cha-Gal80;TH-Gal4 x GFP (nucl.) flie.

Figure 3: Staining: Cha-Gal80;TH-Gal4 x GFP (nucl.)
Category: wing clipping | No Comments
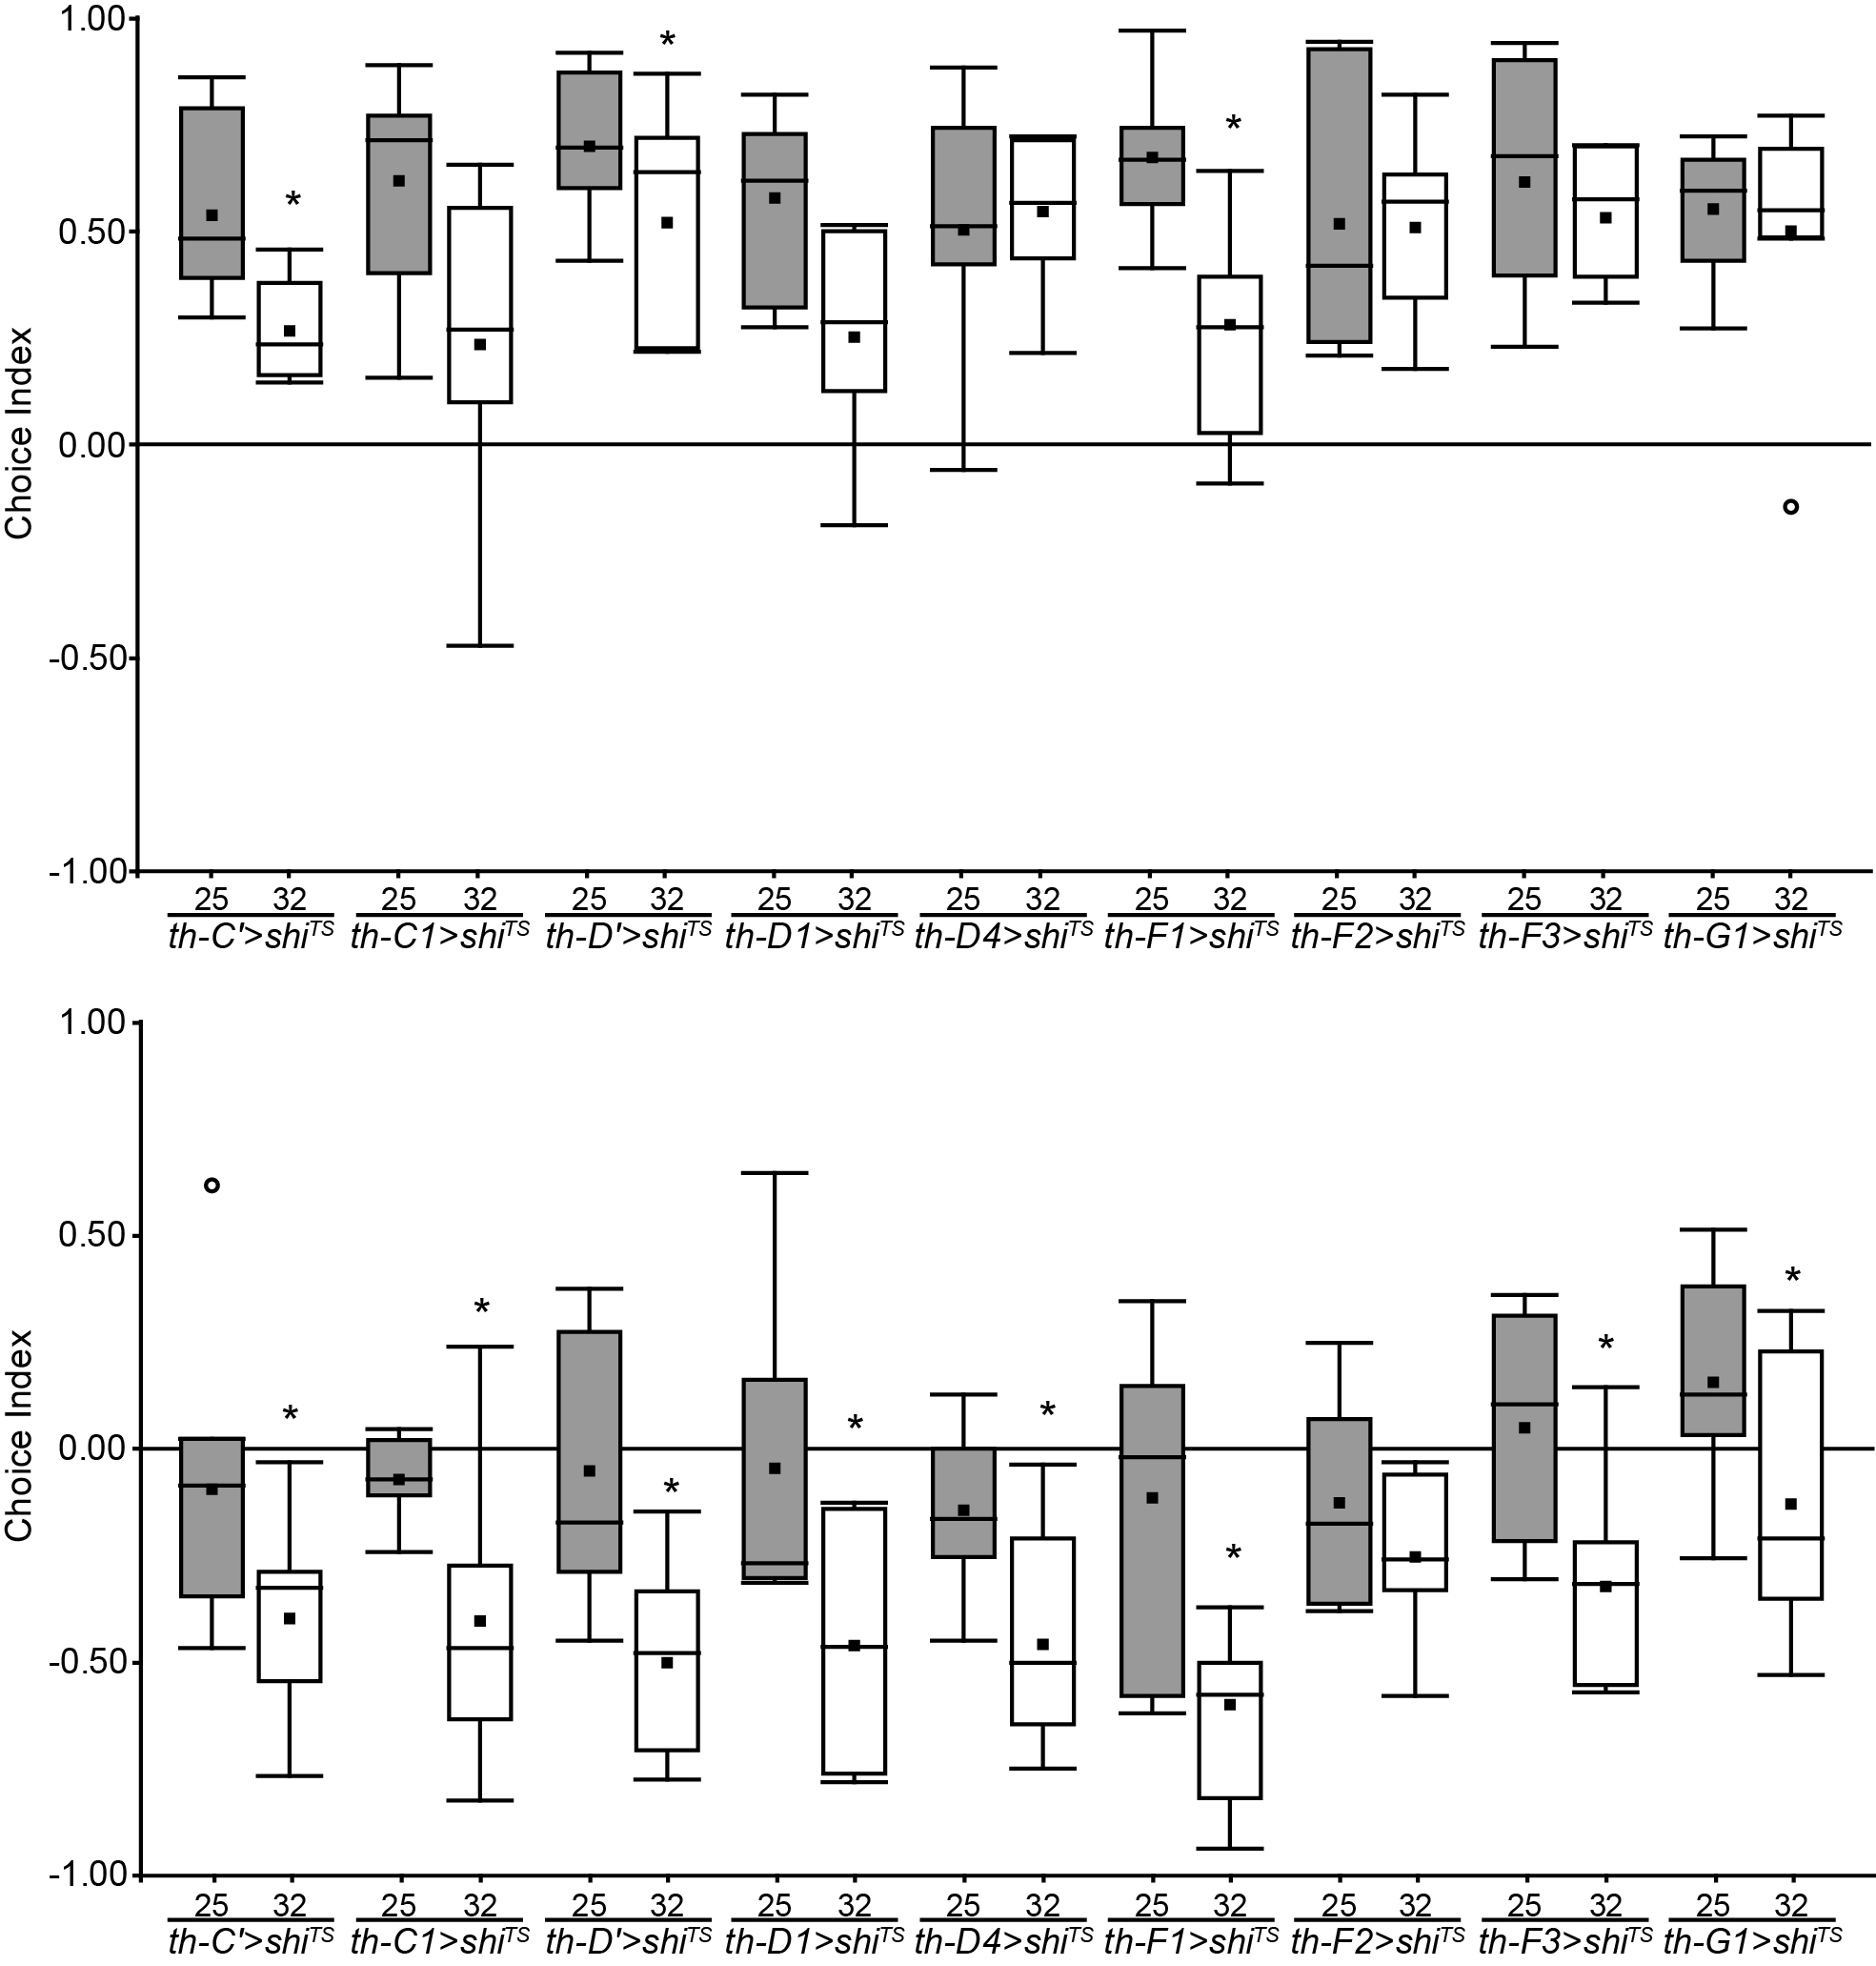
Update: Looking for the DA & OA neurons involved in phototactic flexibility
on Wednesday, October 7th, 2015 11:35 | by Axel Gorostiza
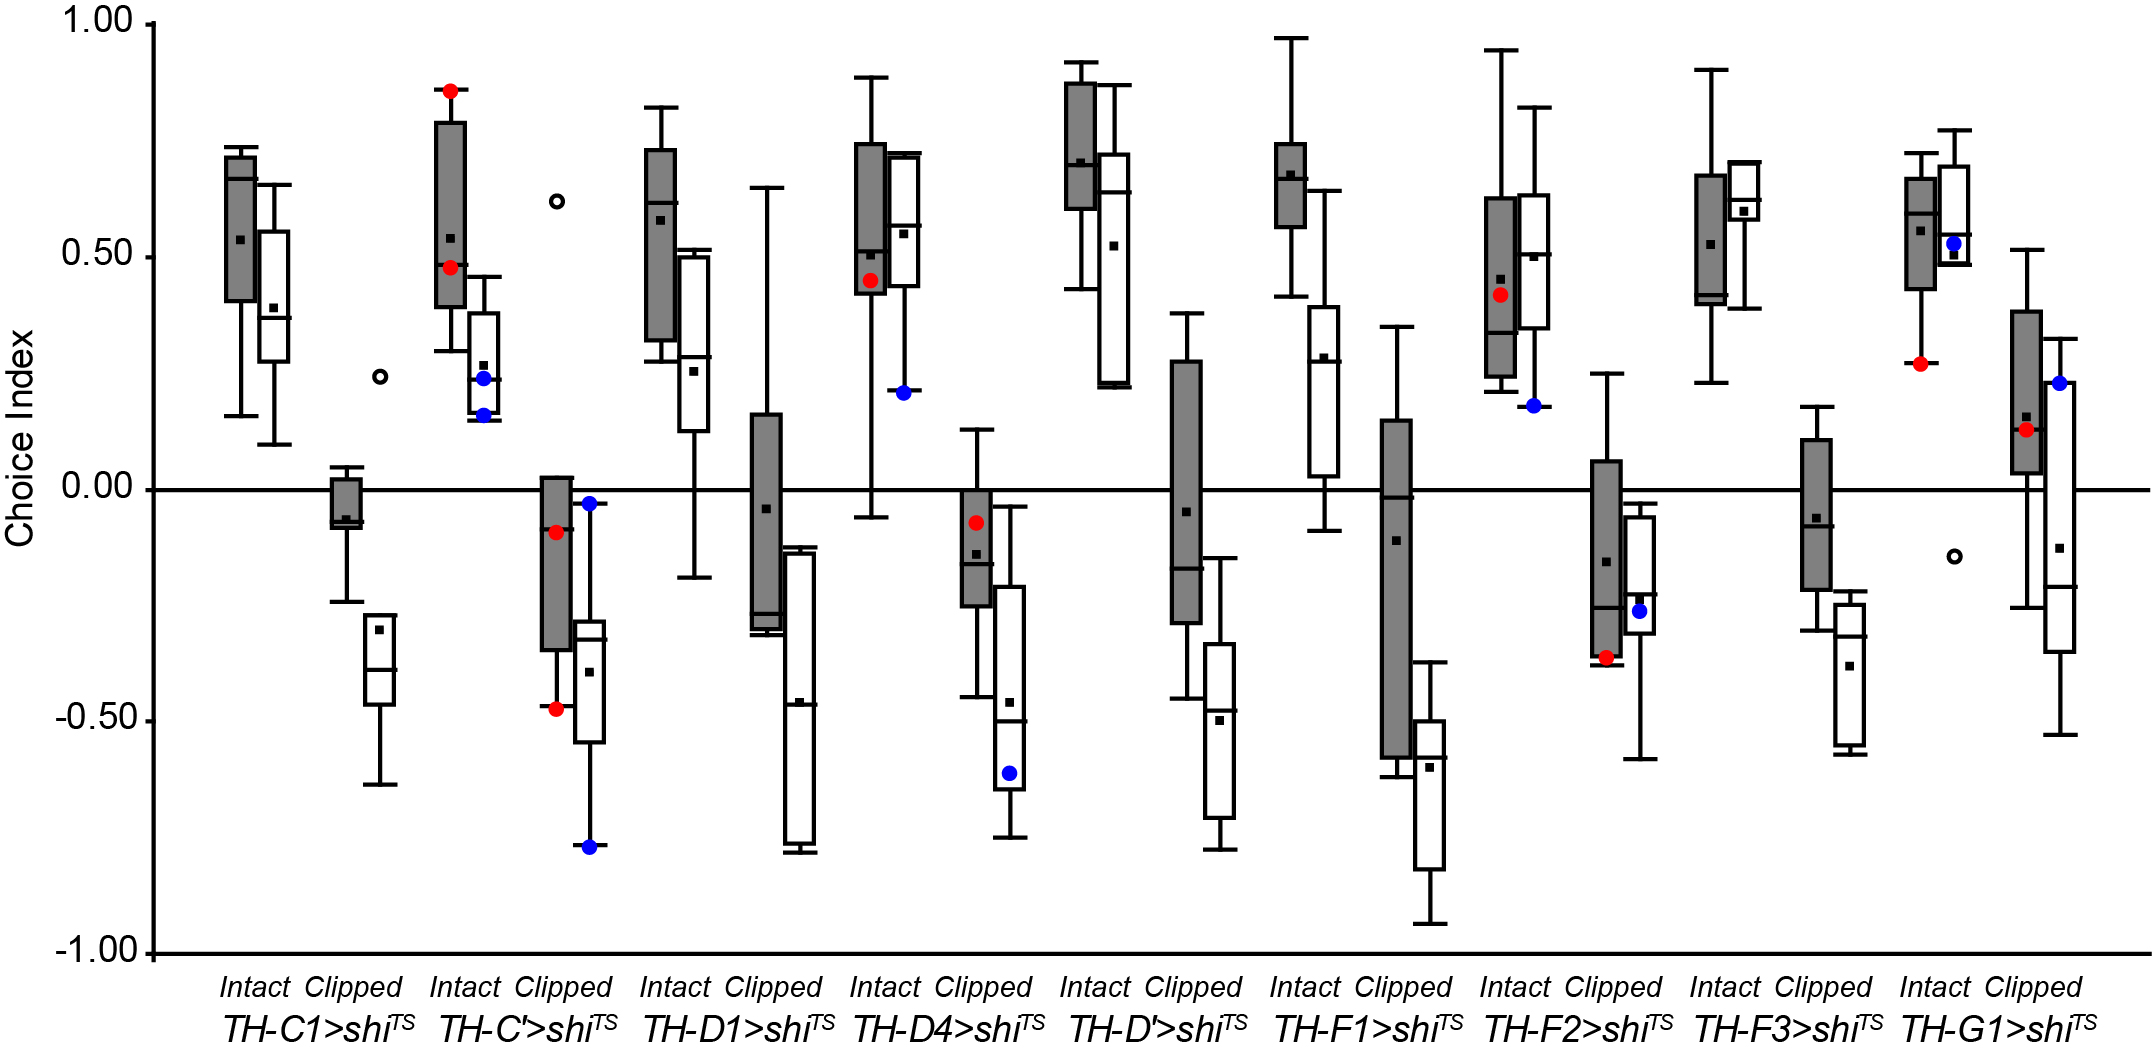
These are the newst results of my screen. There are some interesting candidates, but it’s still too soon to conclued something.
Update of the DA screening. New experiments are in red (25°C) and blue (32°C).
Experiment finished.
Category: wing clipping | No Comments