Making new ratios for Y-maze
on Monday, June 18th, 2018 1:55 | by Christian Rohrsen
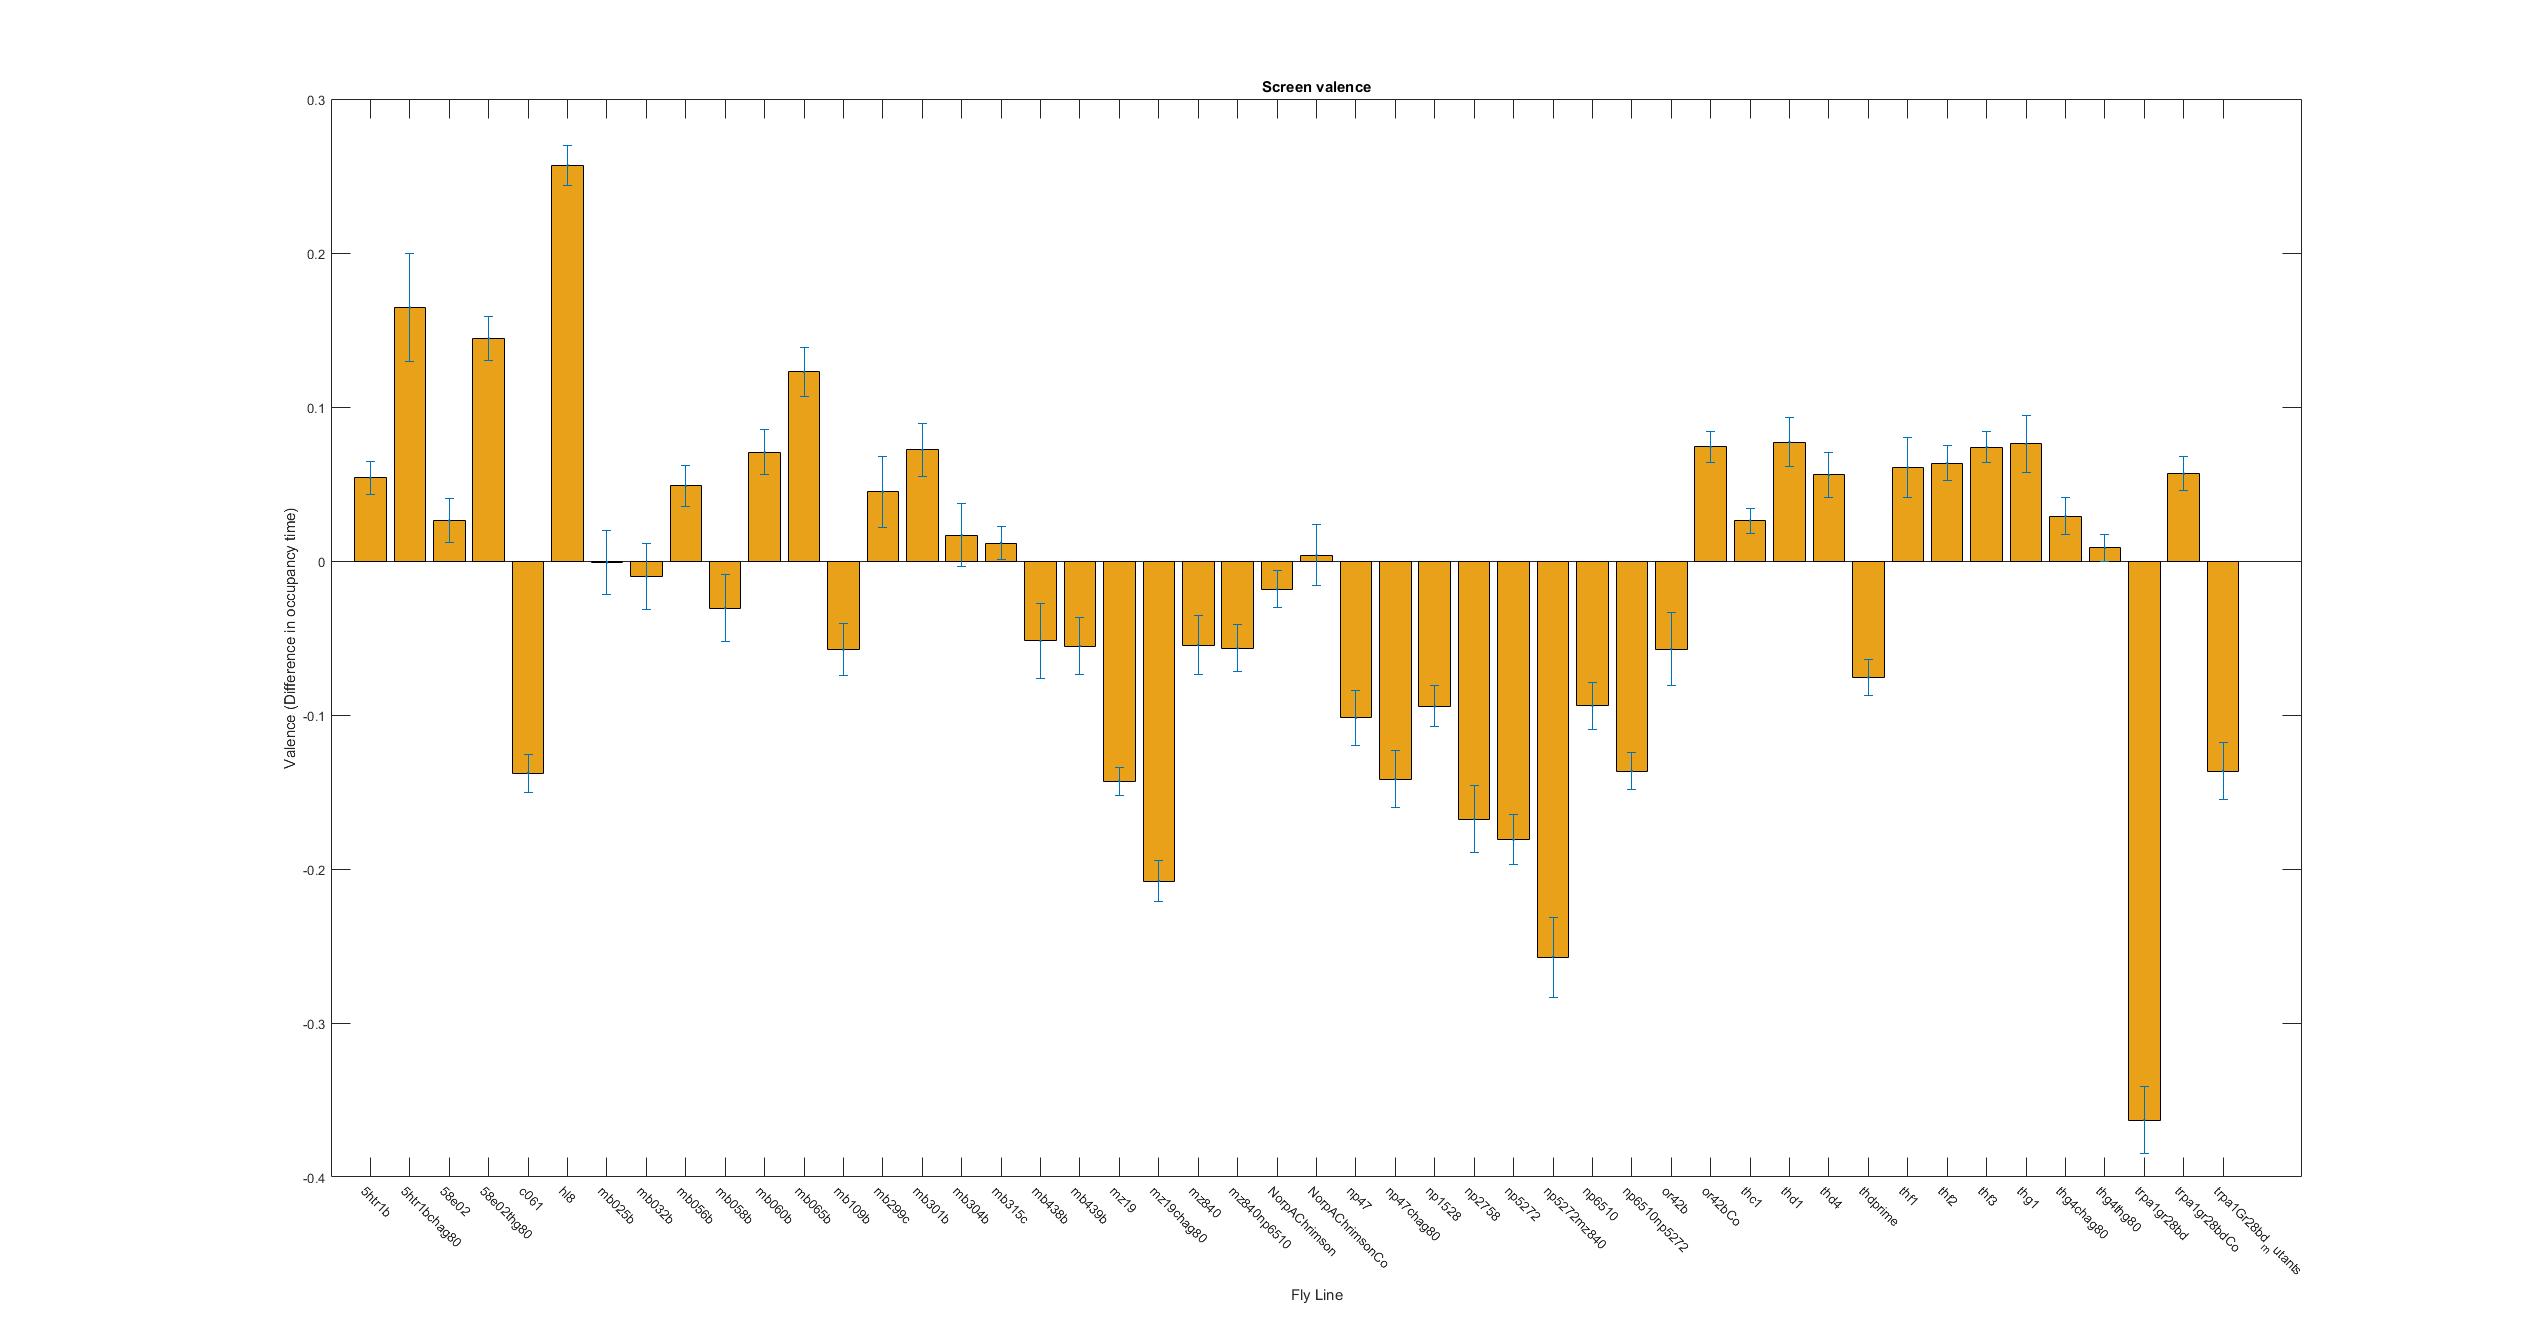
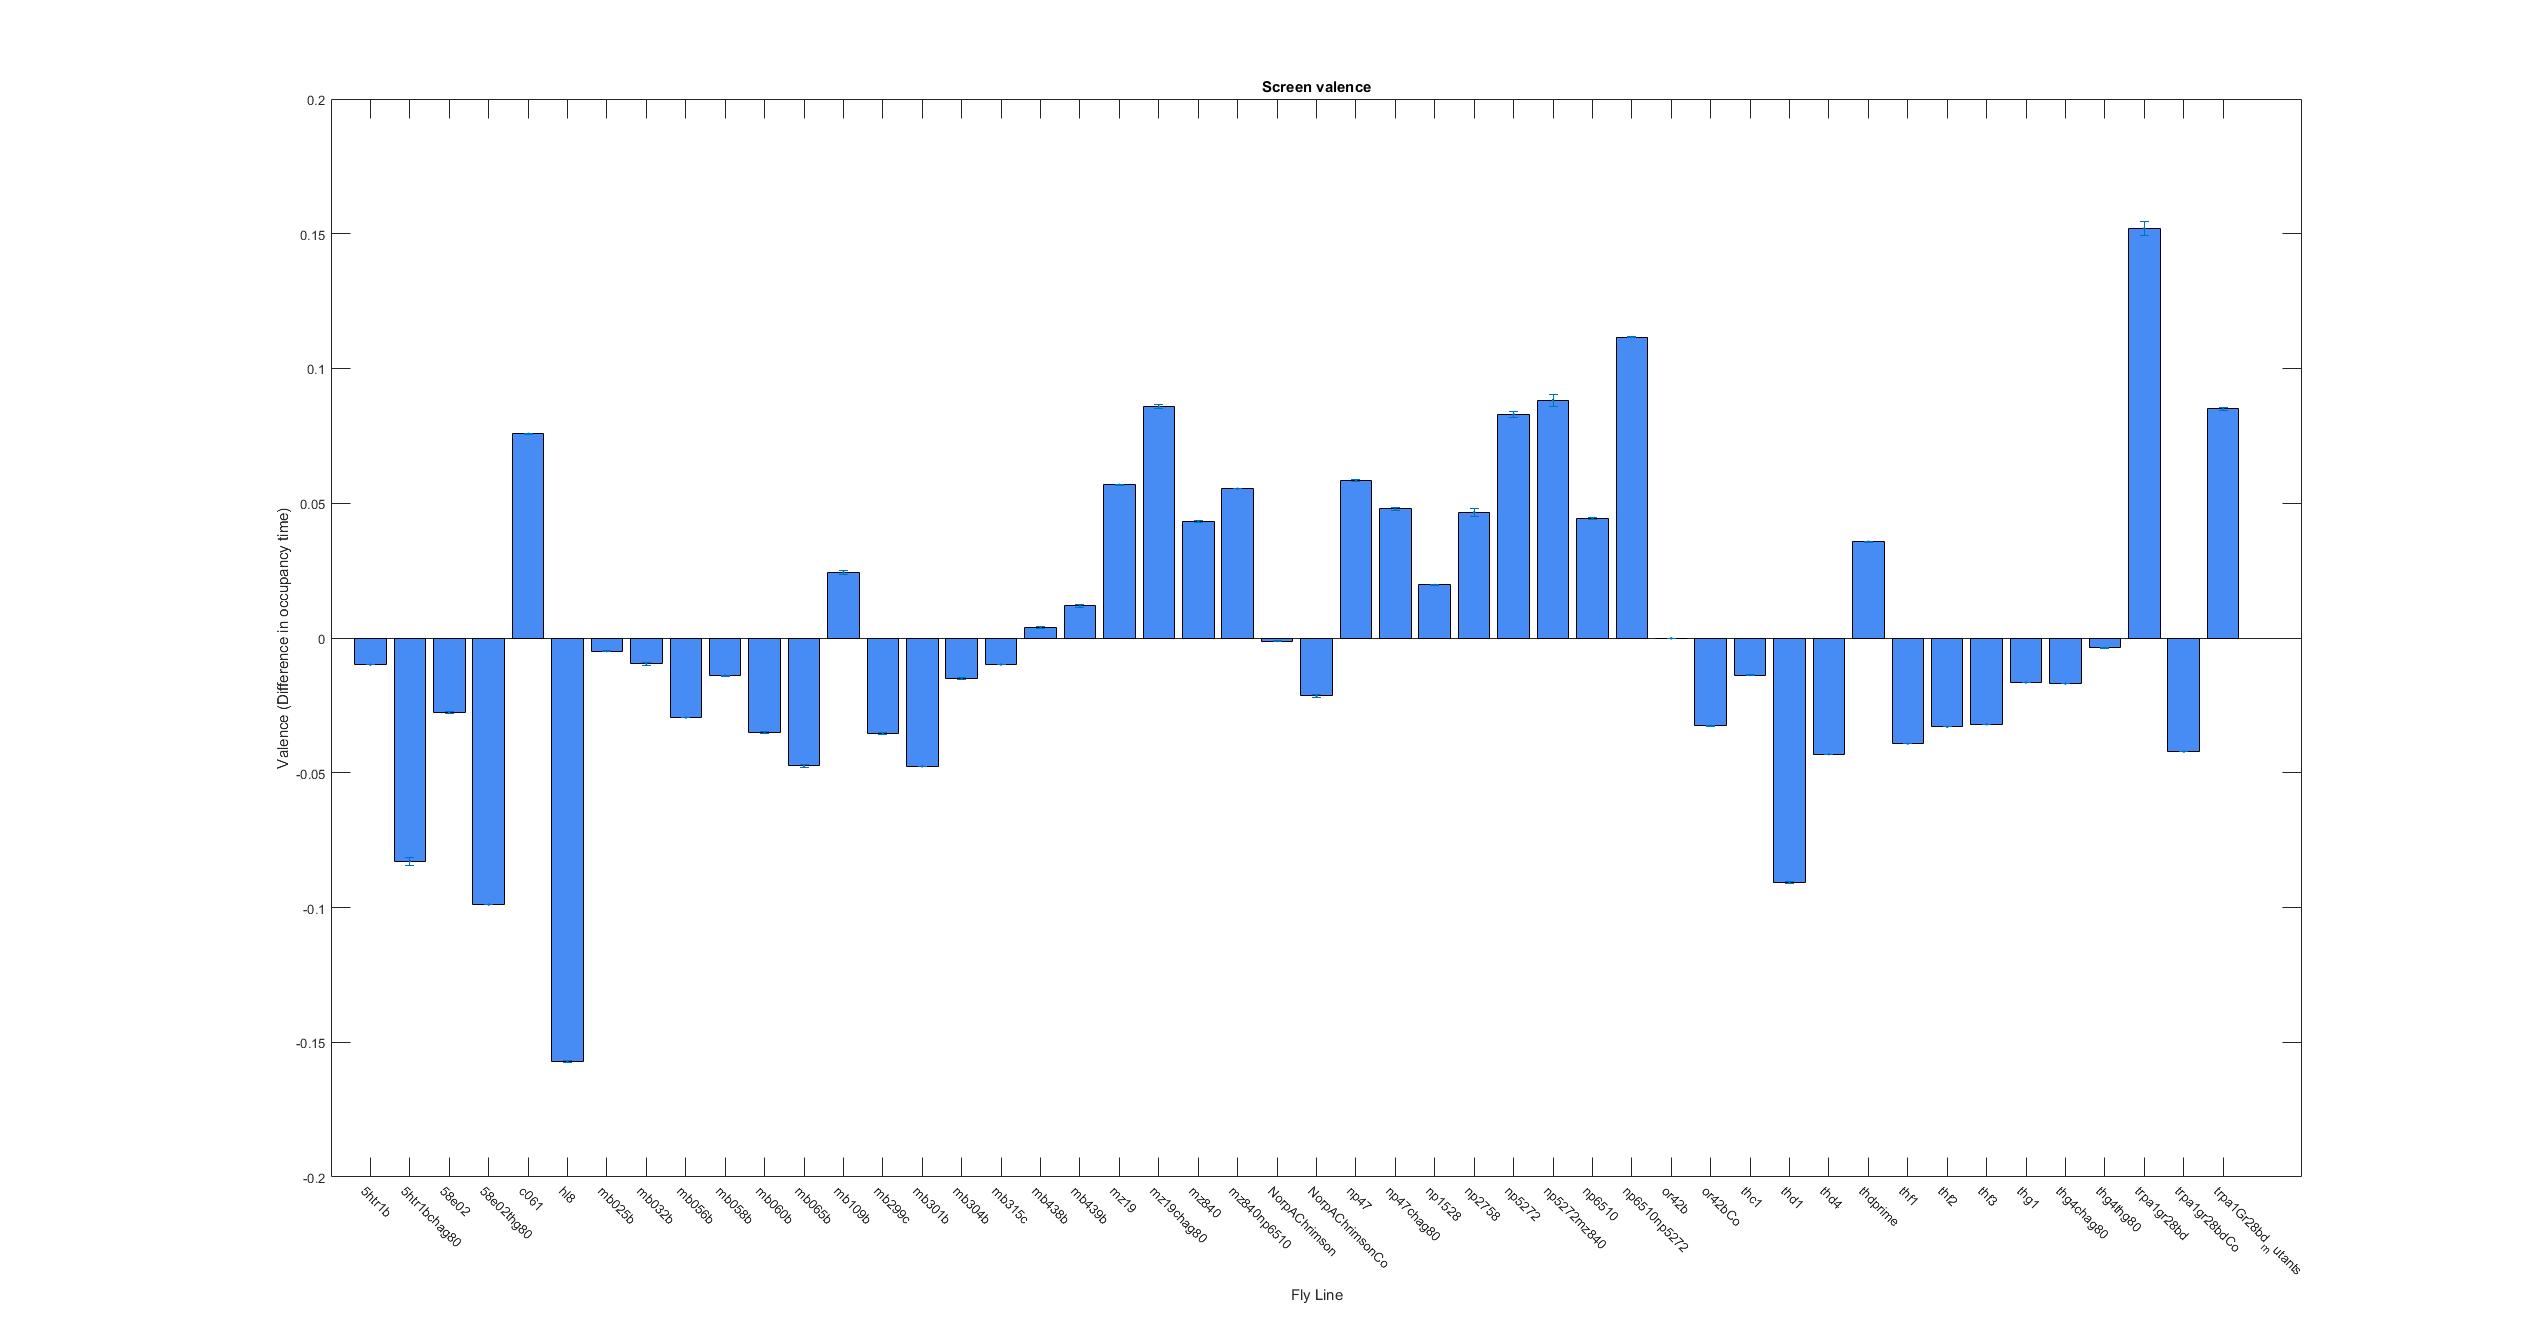
This is just to show that I am trying to find a new ratio so that all graphs have from -1 to +1 ranges. That is why now the difference in occupancy time is divided by the total time. The same with the speed. Because speed differences are so subtle, the Y axis scale has to be lower

Tmaze experiments initial results
on Monday, June 4th, 2018 2:16 | by Naman Agrawal
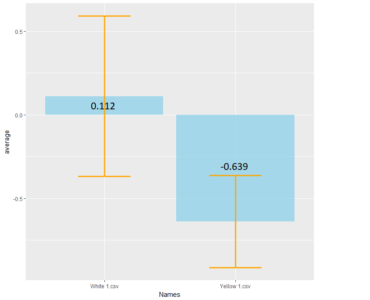
 the first graph shows Bar plot of Mean and standard deviation of PIs for Genetic control (n=9) and Positive control (n=5).
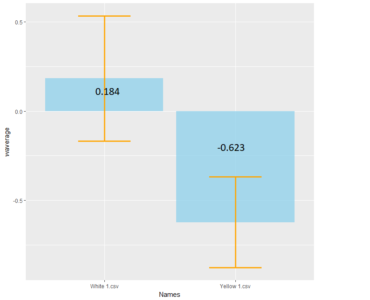
The second graph shows weighted mean and weighted standard deviation of the same.
Weighted mean is calculated by multiplying the weights (total number of flies in that experiment/total number of flies in all the experiments) with the PI for that experiment, and taking the sum thereafter for all the experiments.
Category: neuronal activation, operant self-learning, Optogenetics, TrpA | No Comments
Summary of results of master thesis
on Monday, December 11th, 2017 12:35 | by Weitian Sun
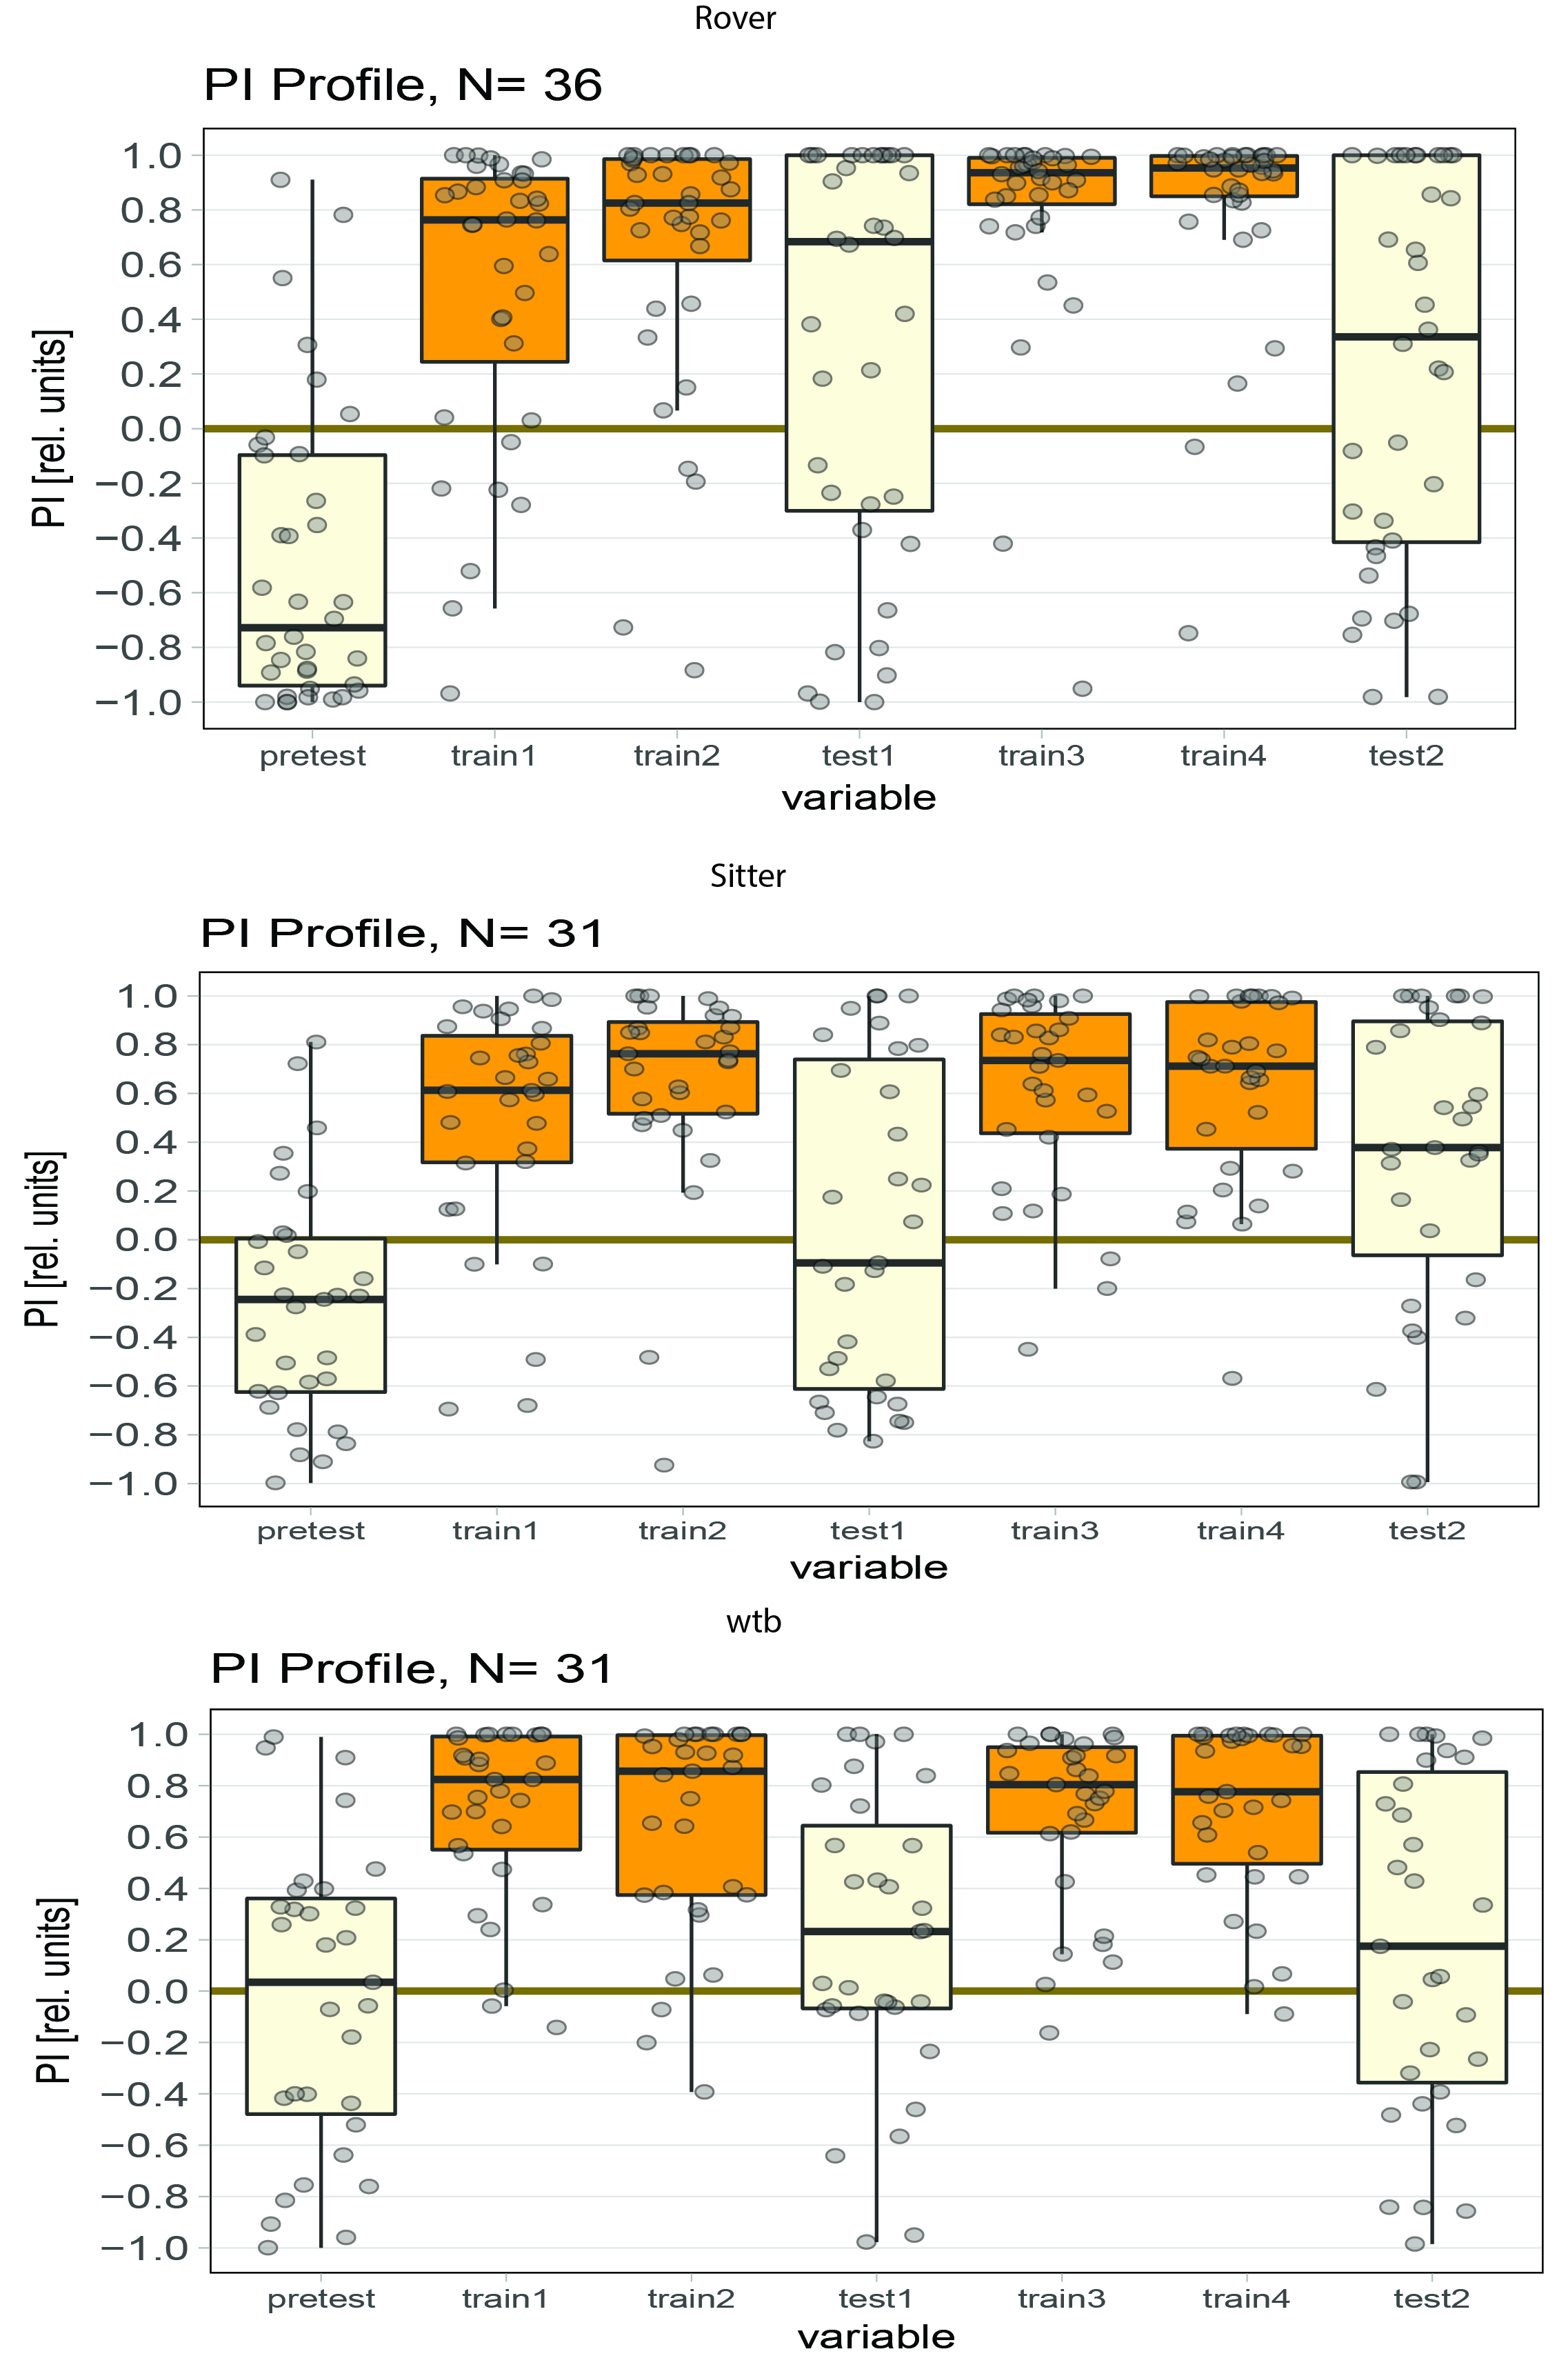
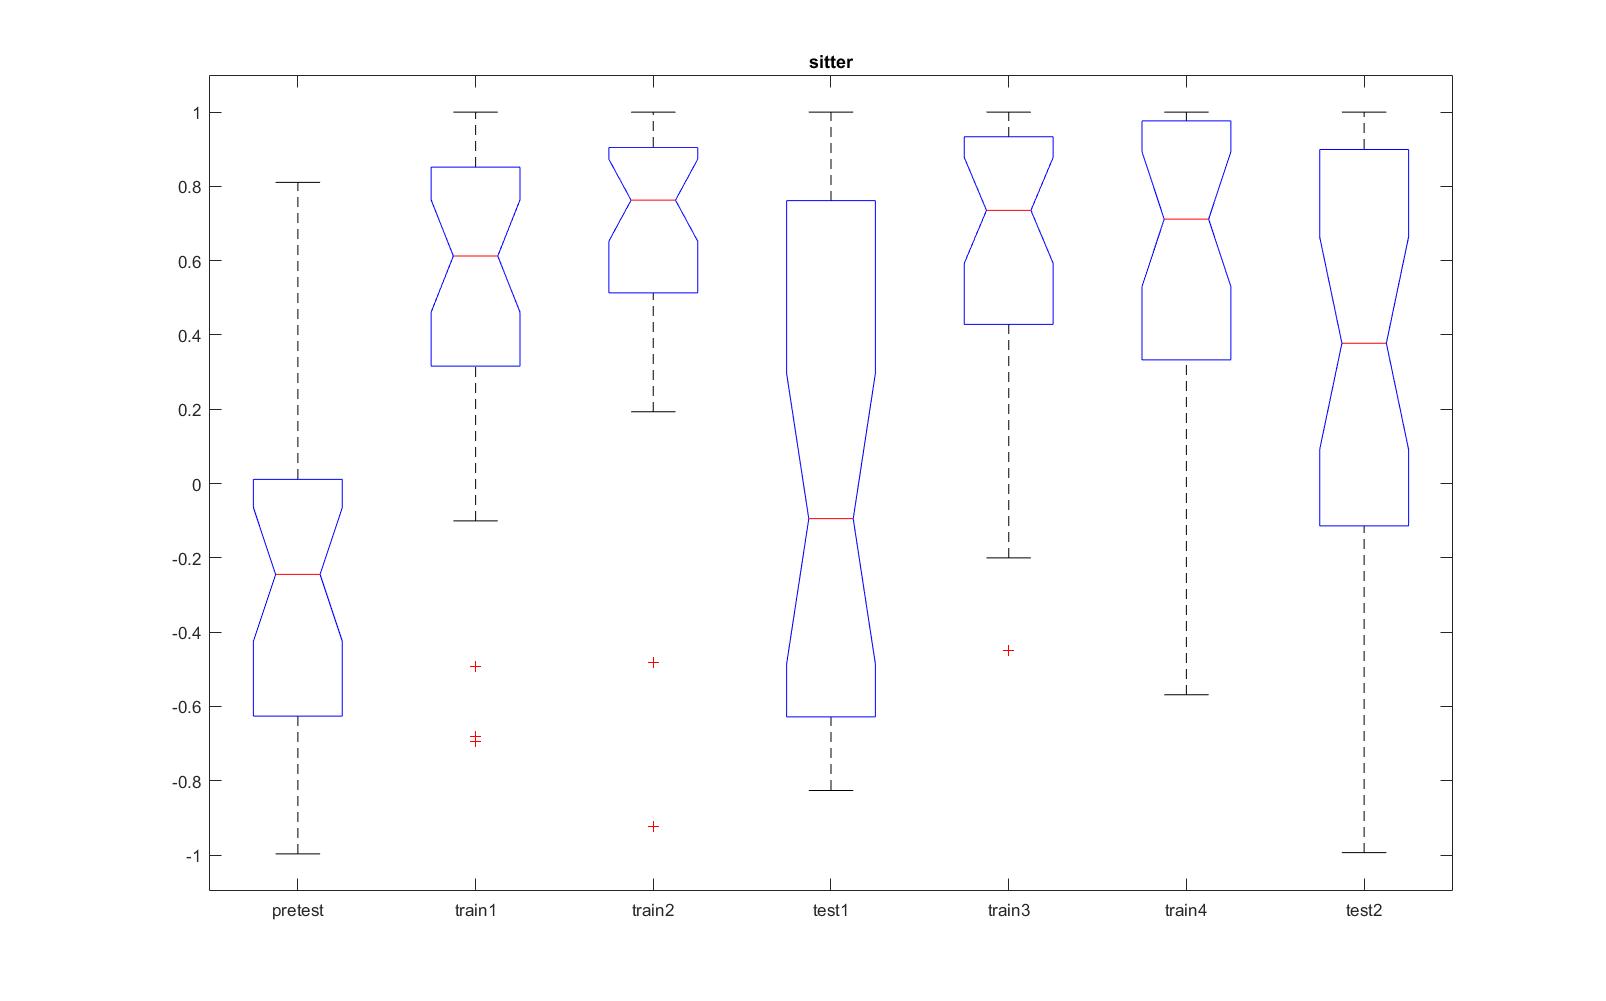
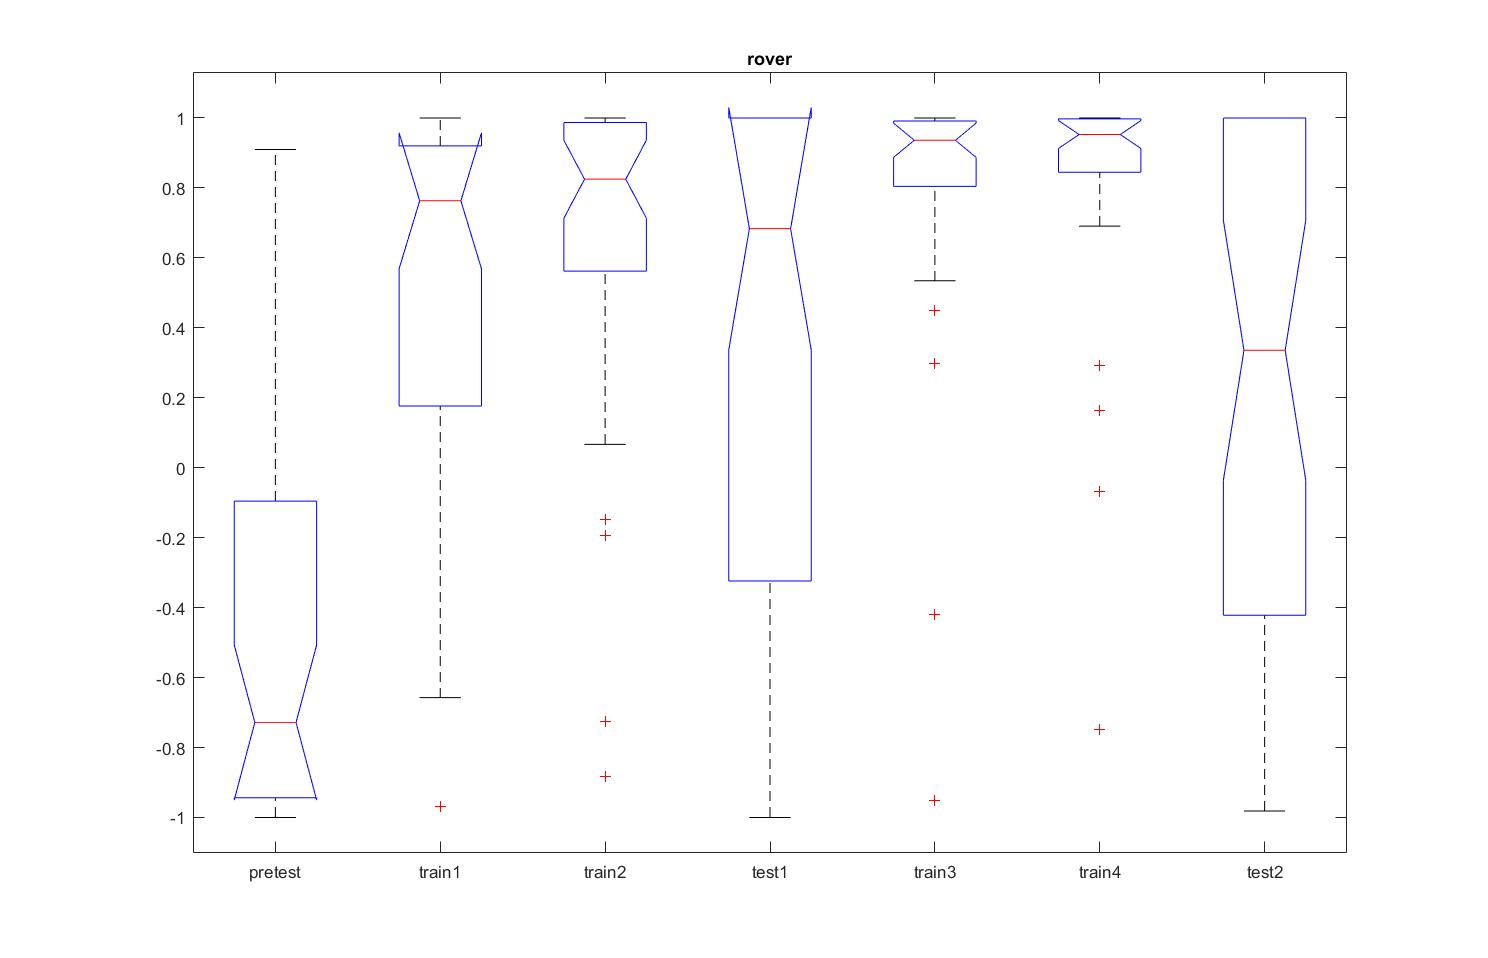
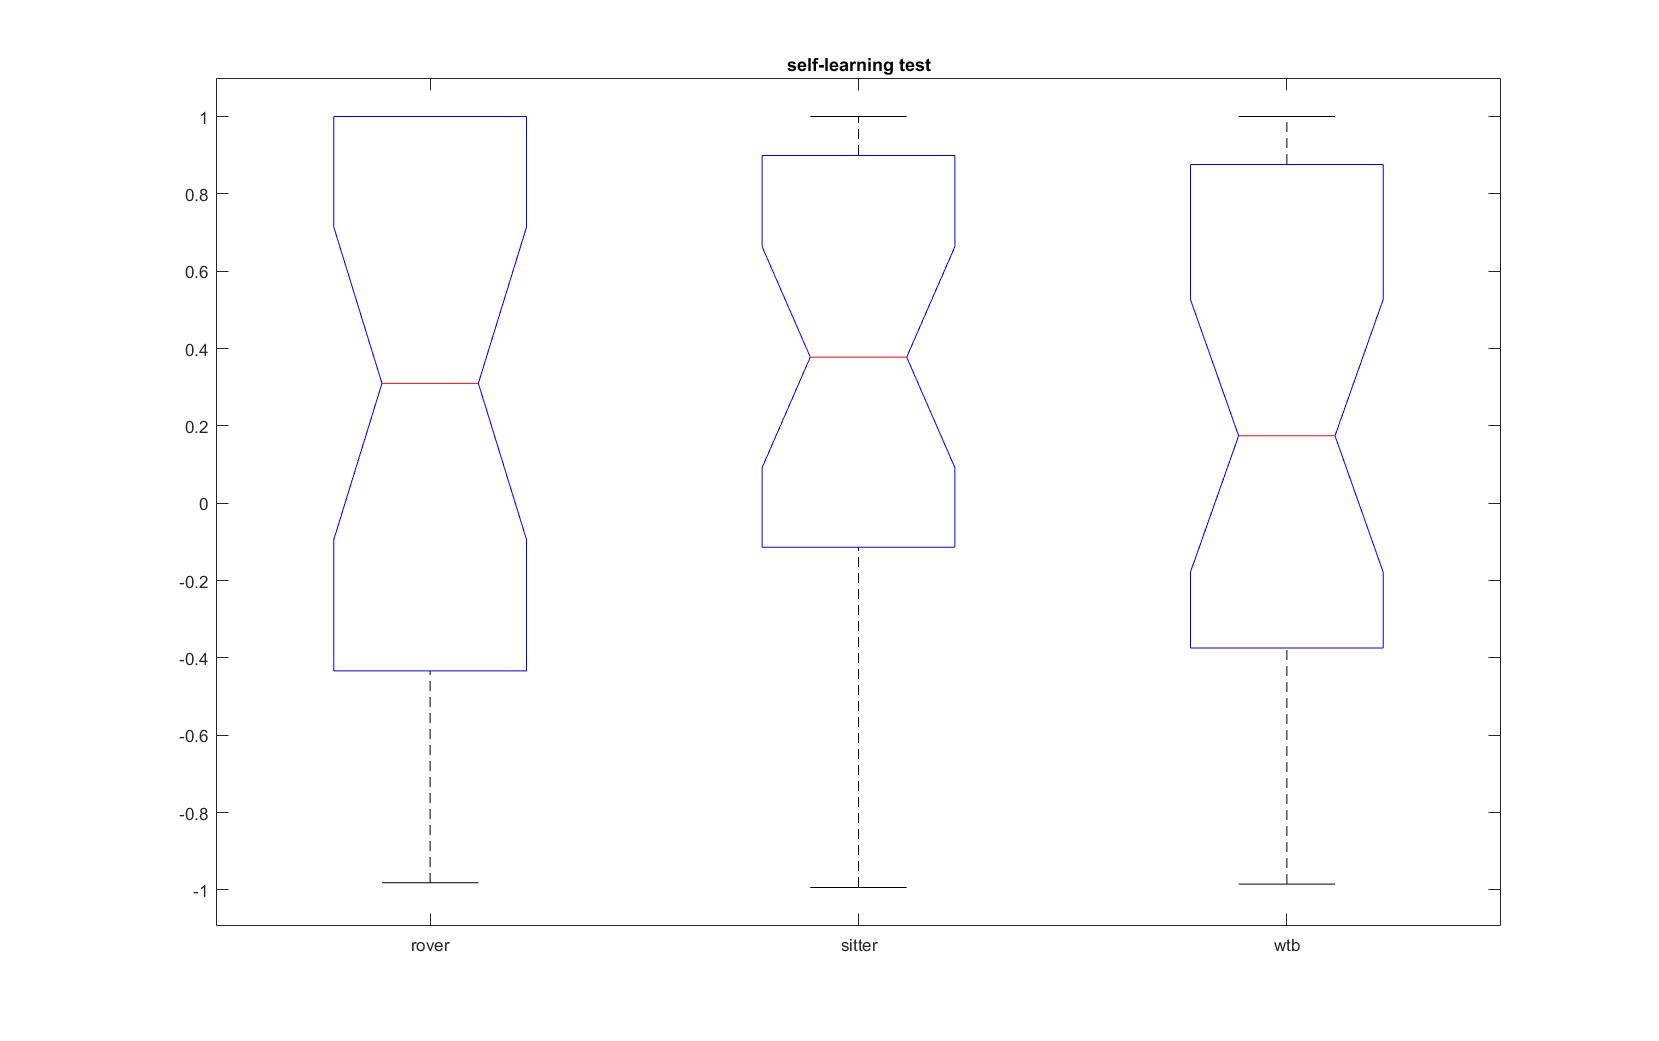
Self-learning of Rover/sitter from flight simulator
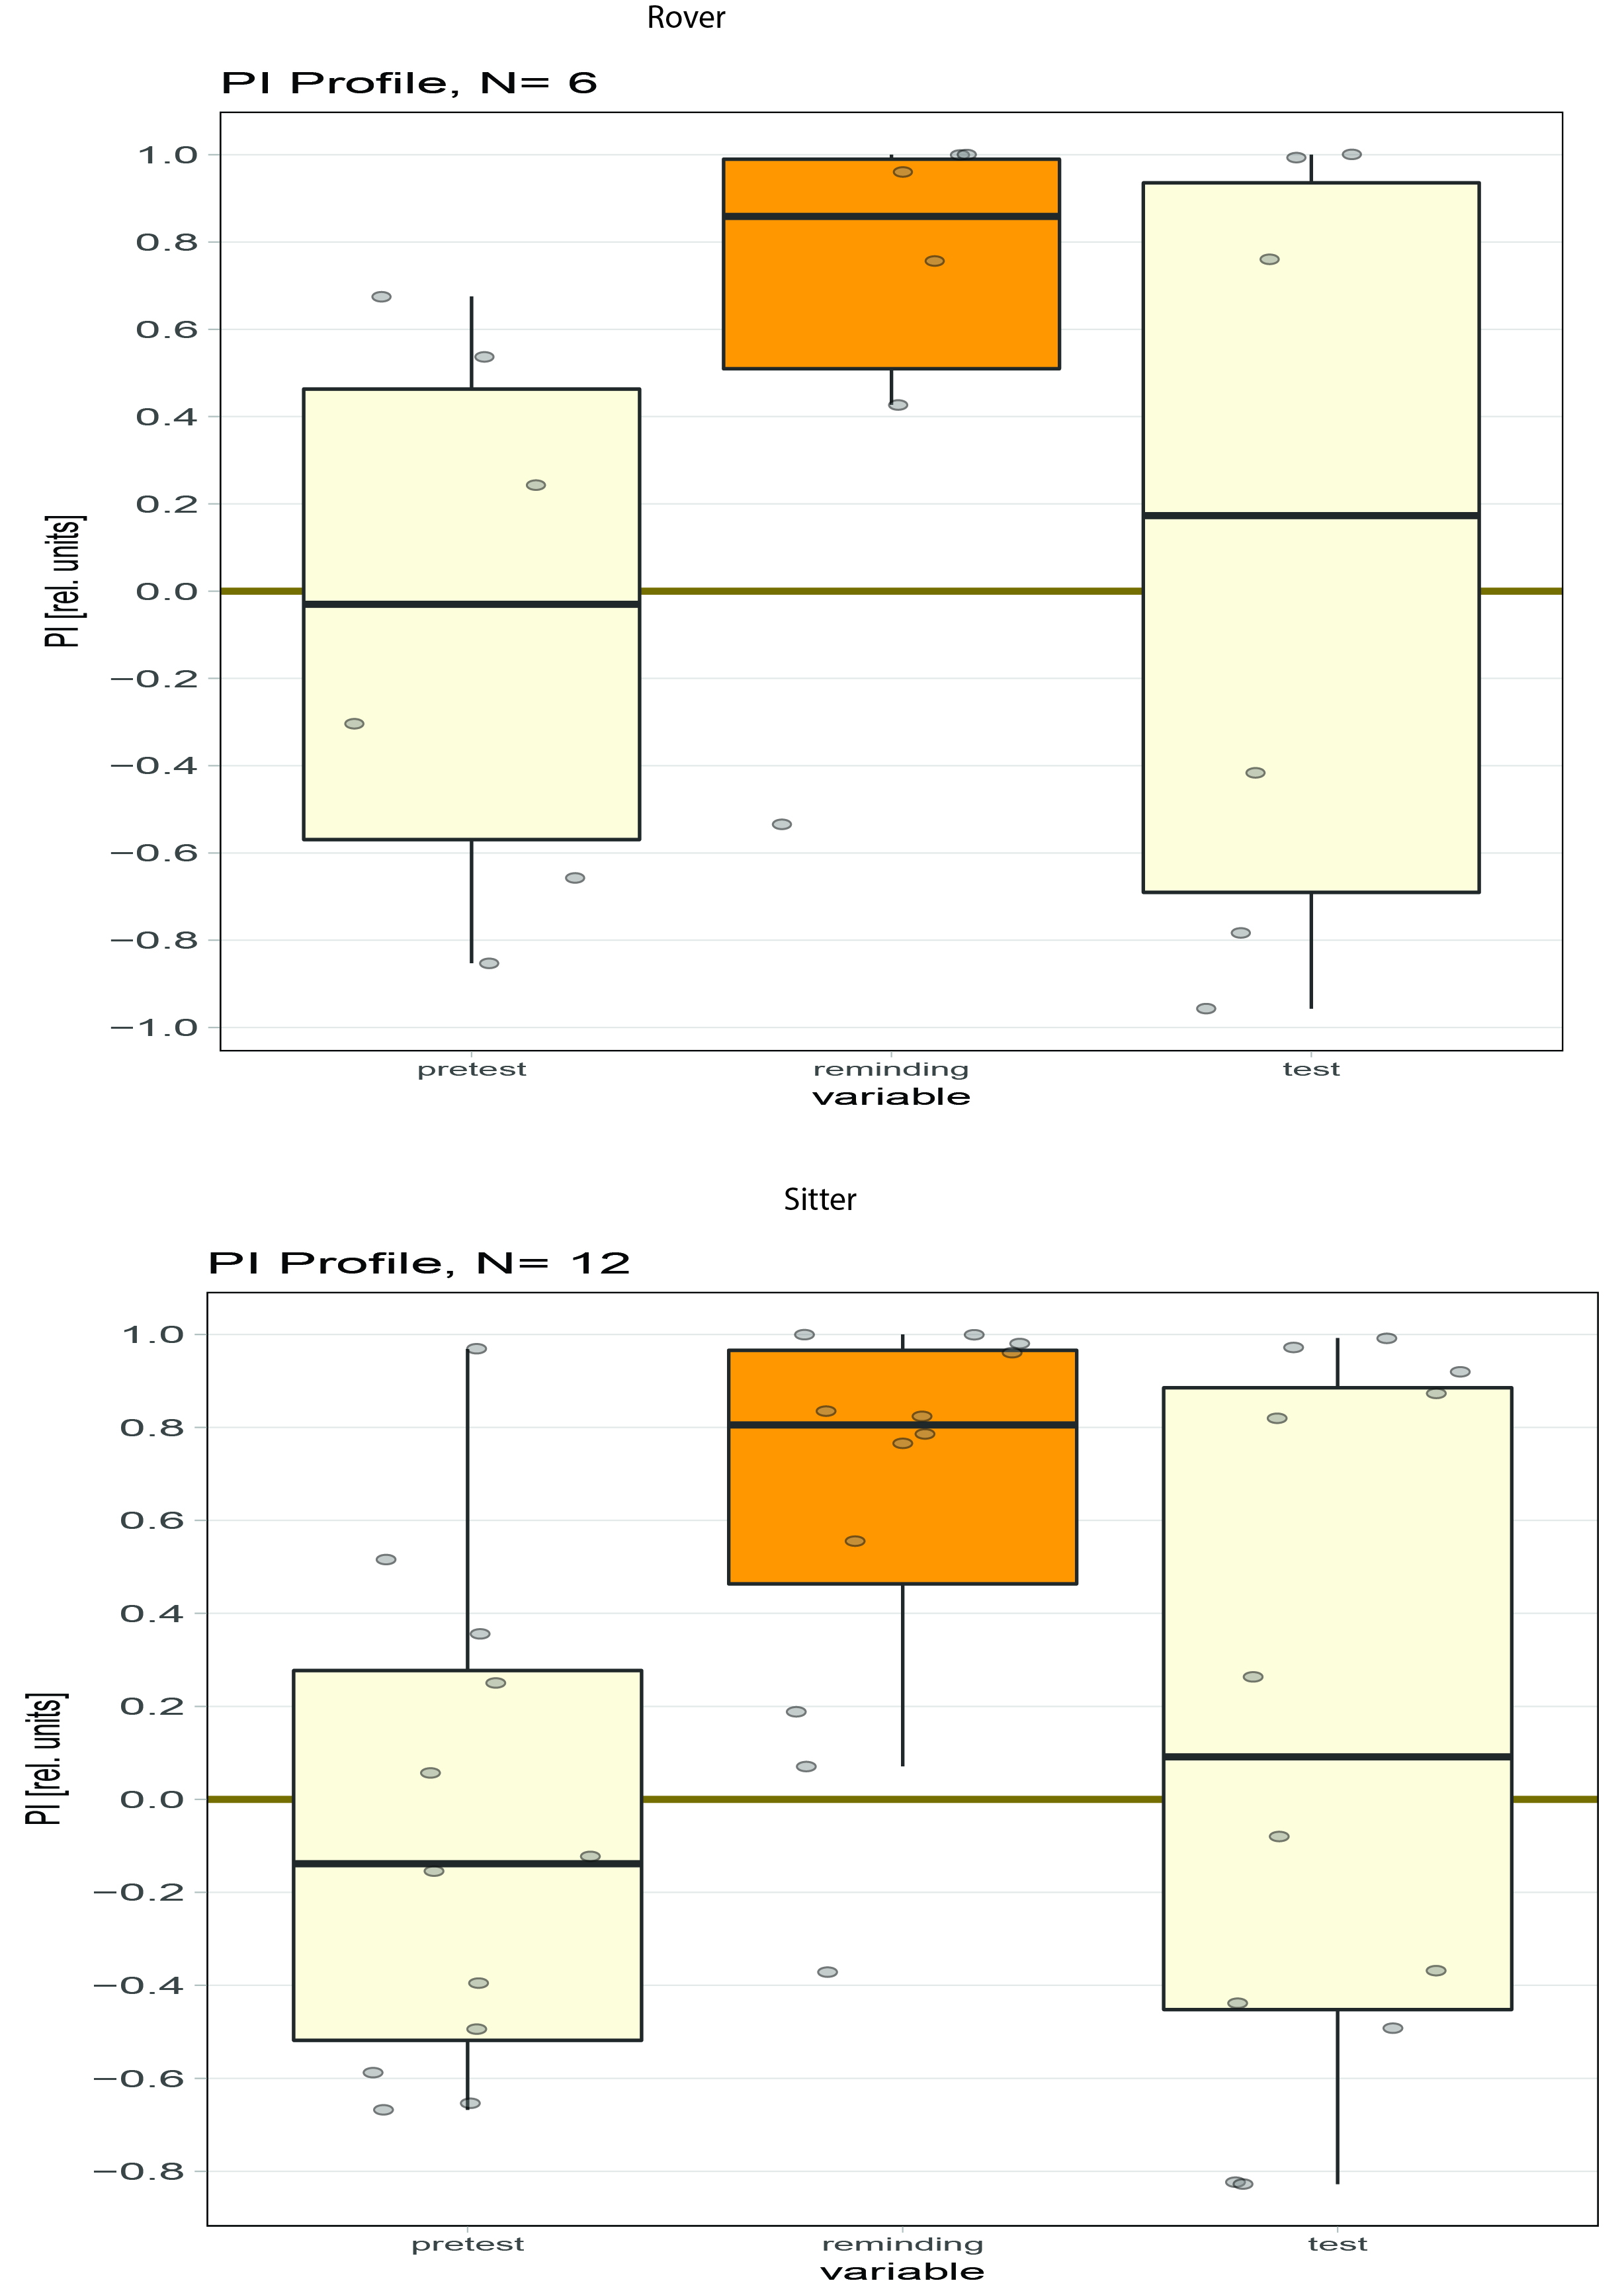
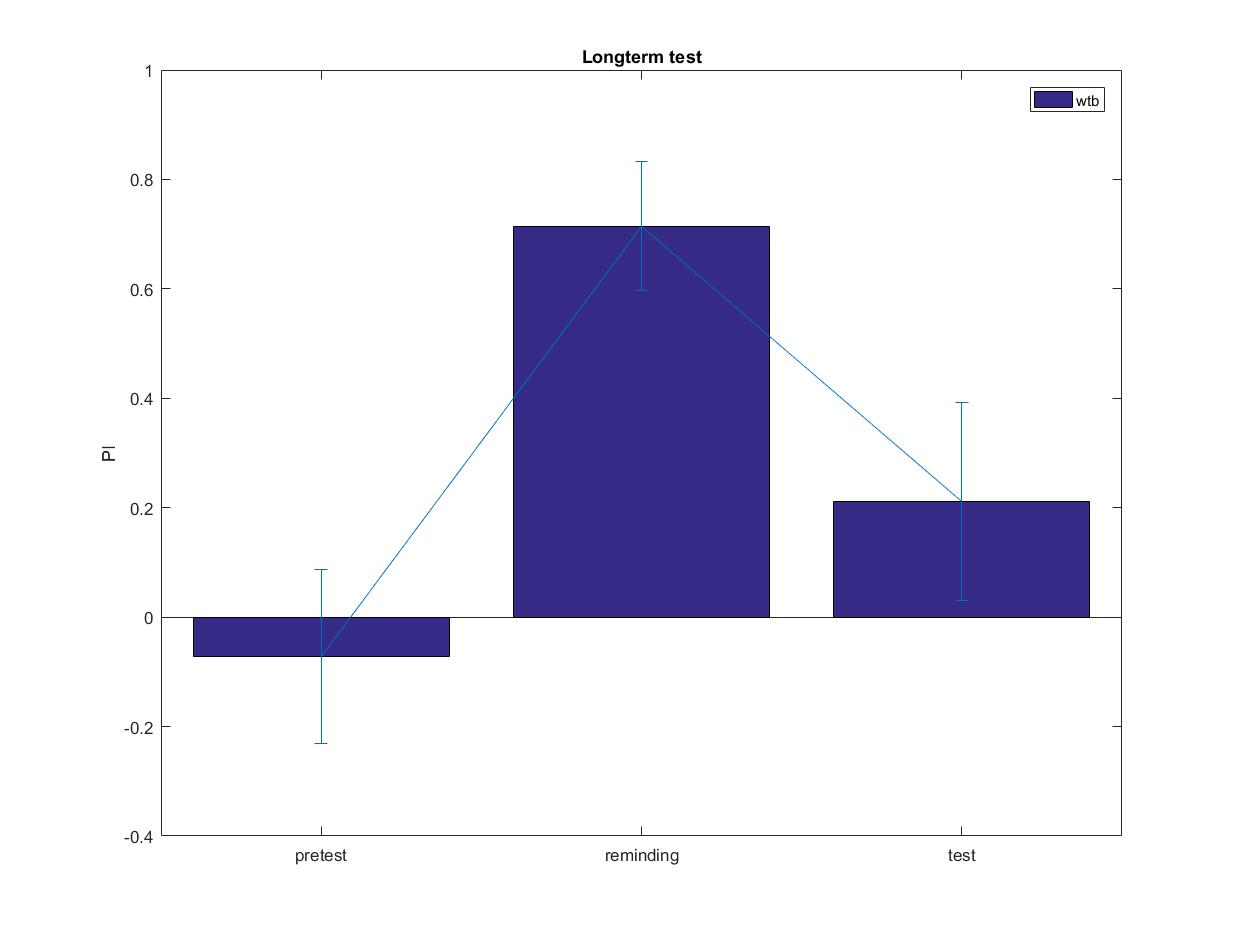
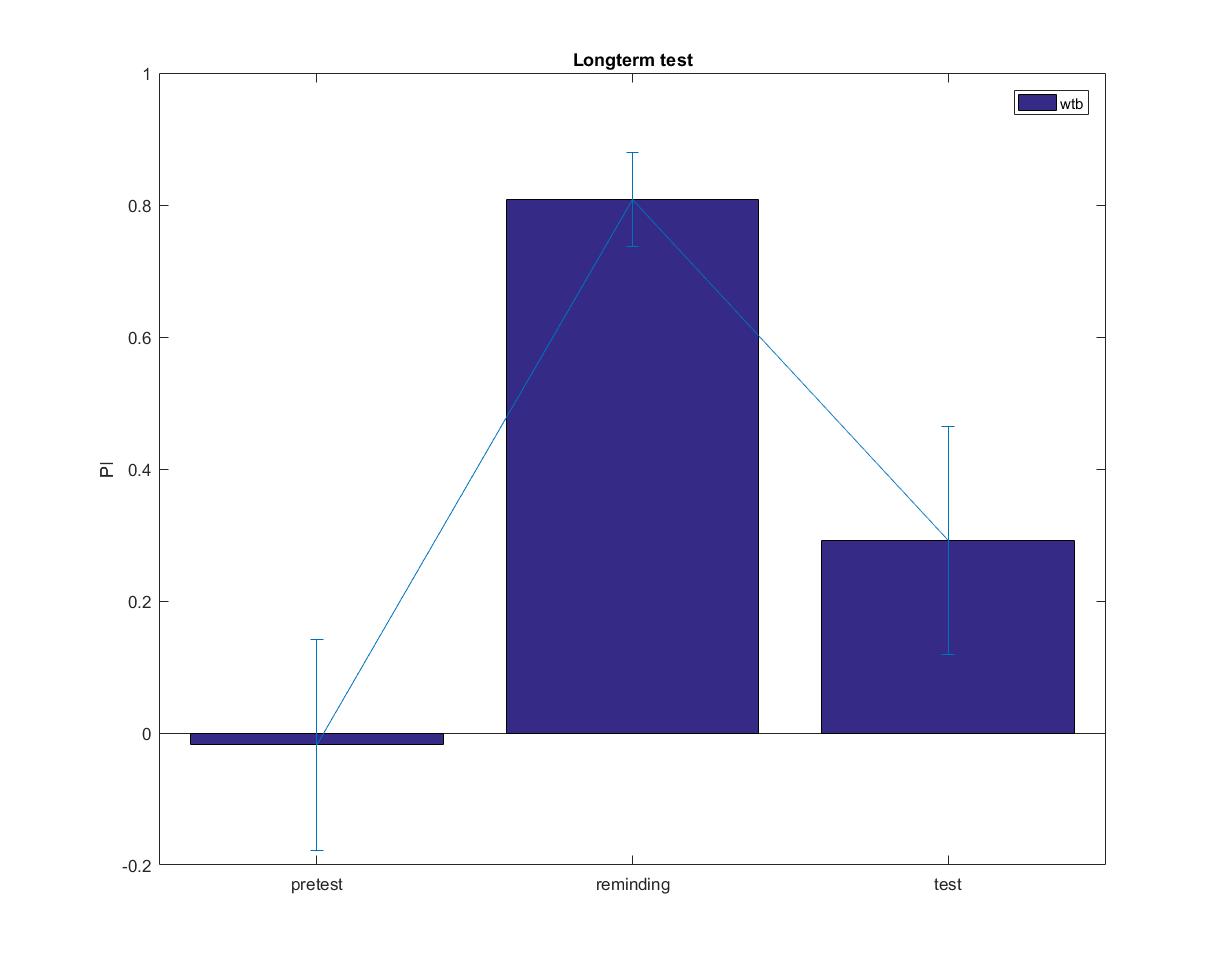
Long-term memroy from self-learning
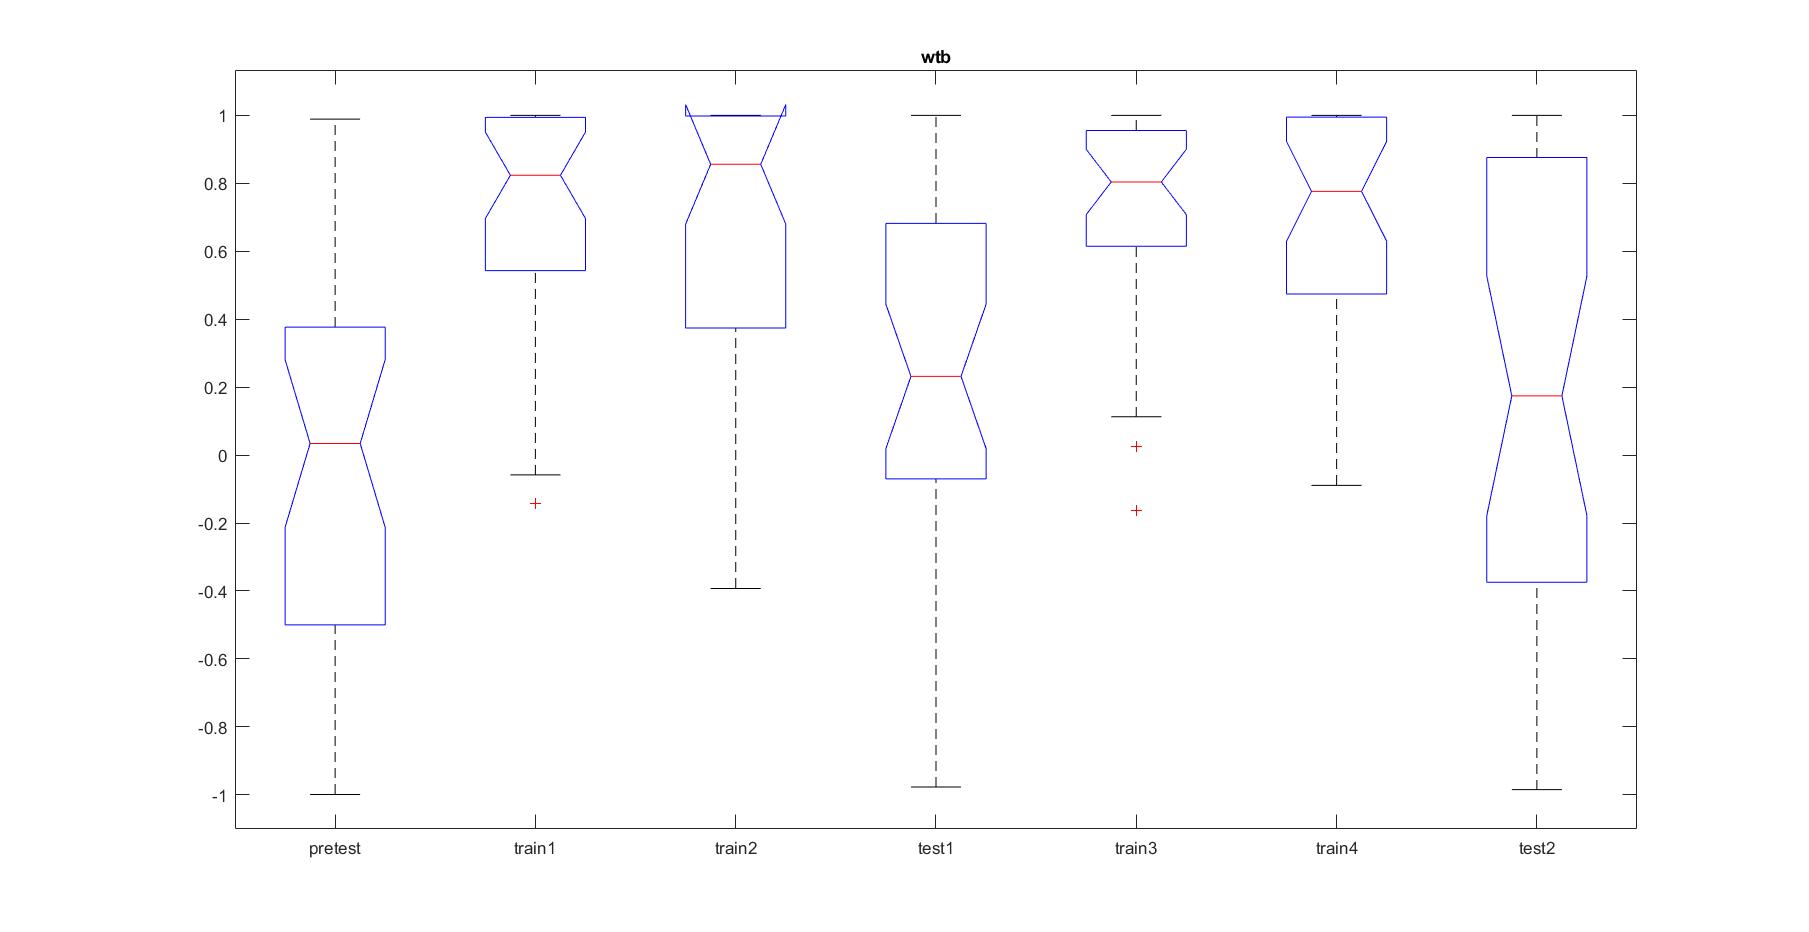
Self-learning training/tests from transgeneic flies
Category: operant self-learning, Optogenetics | No Comments
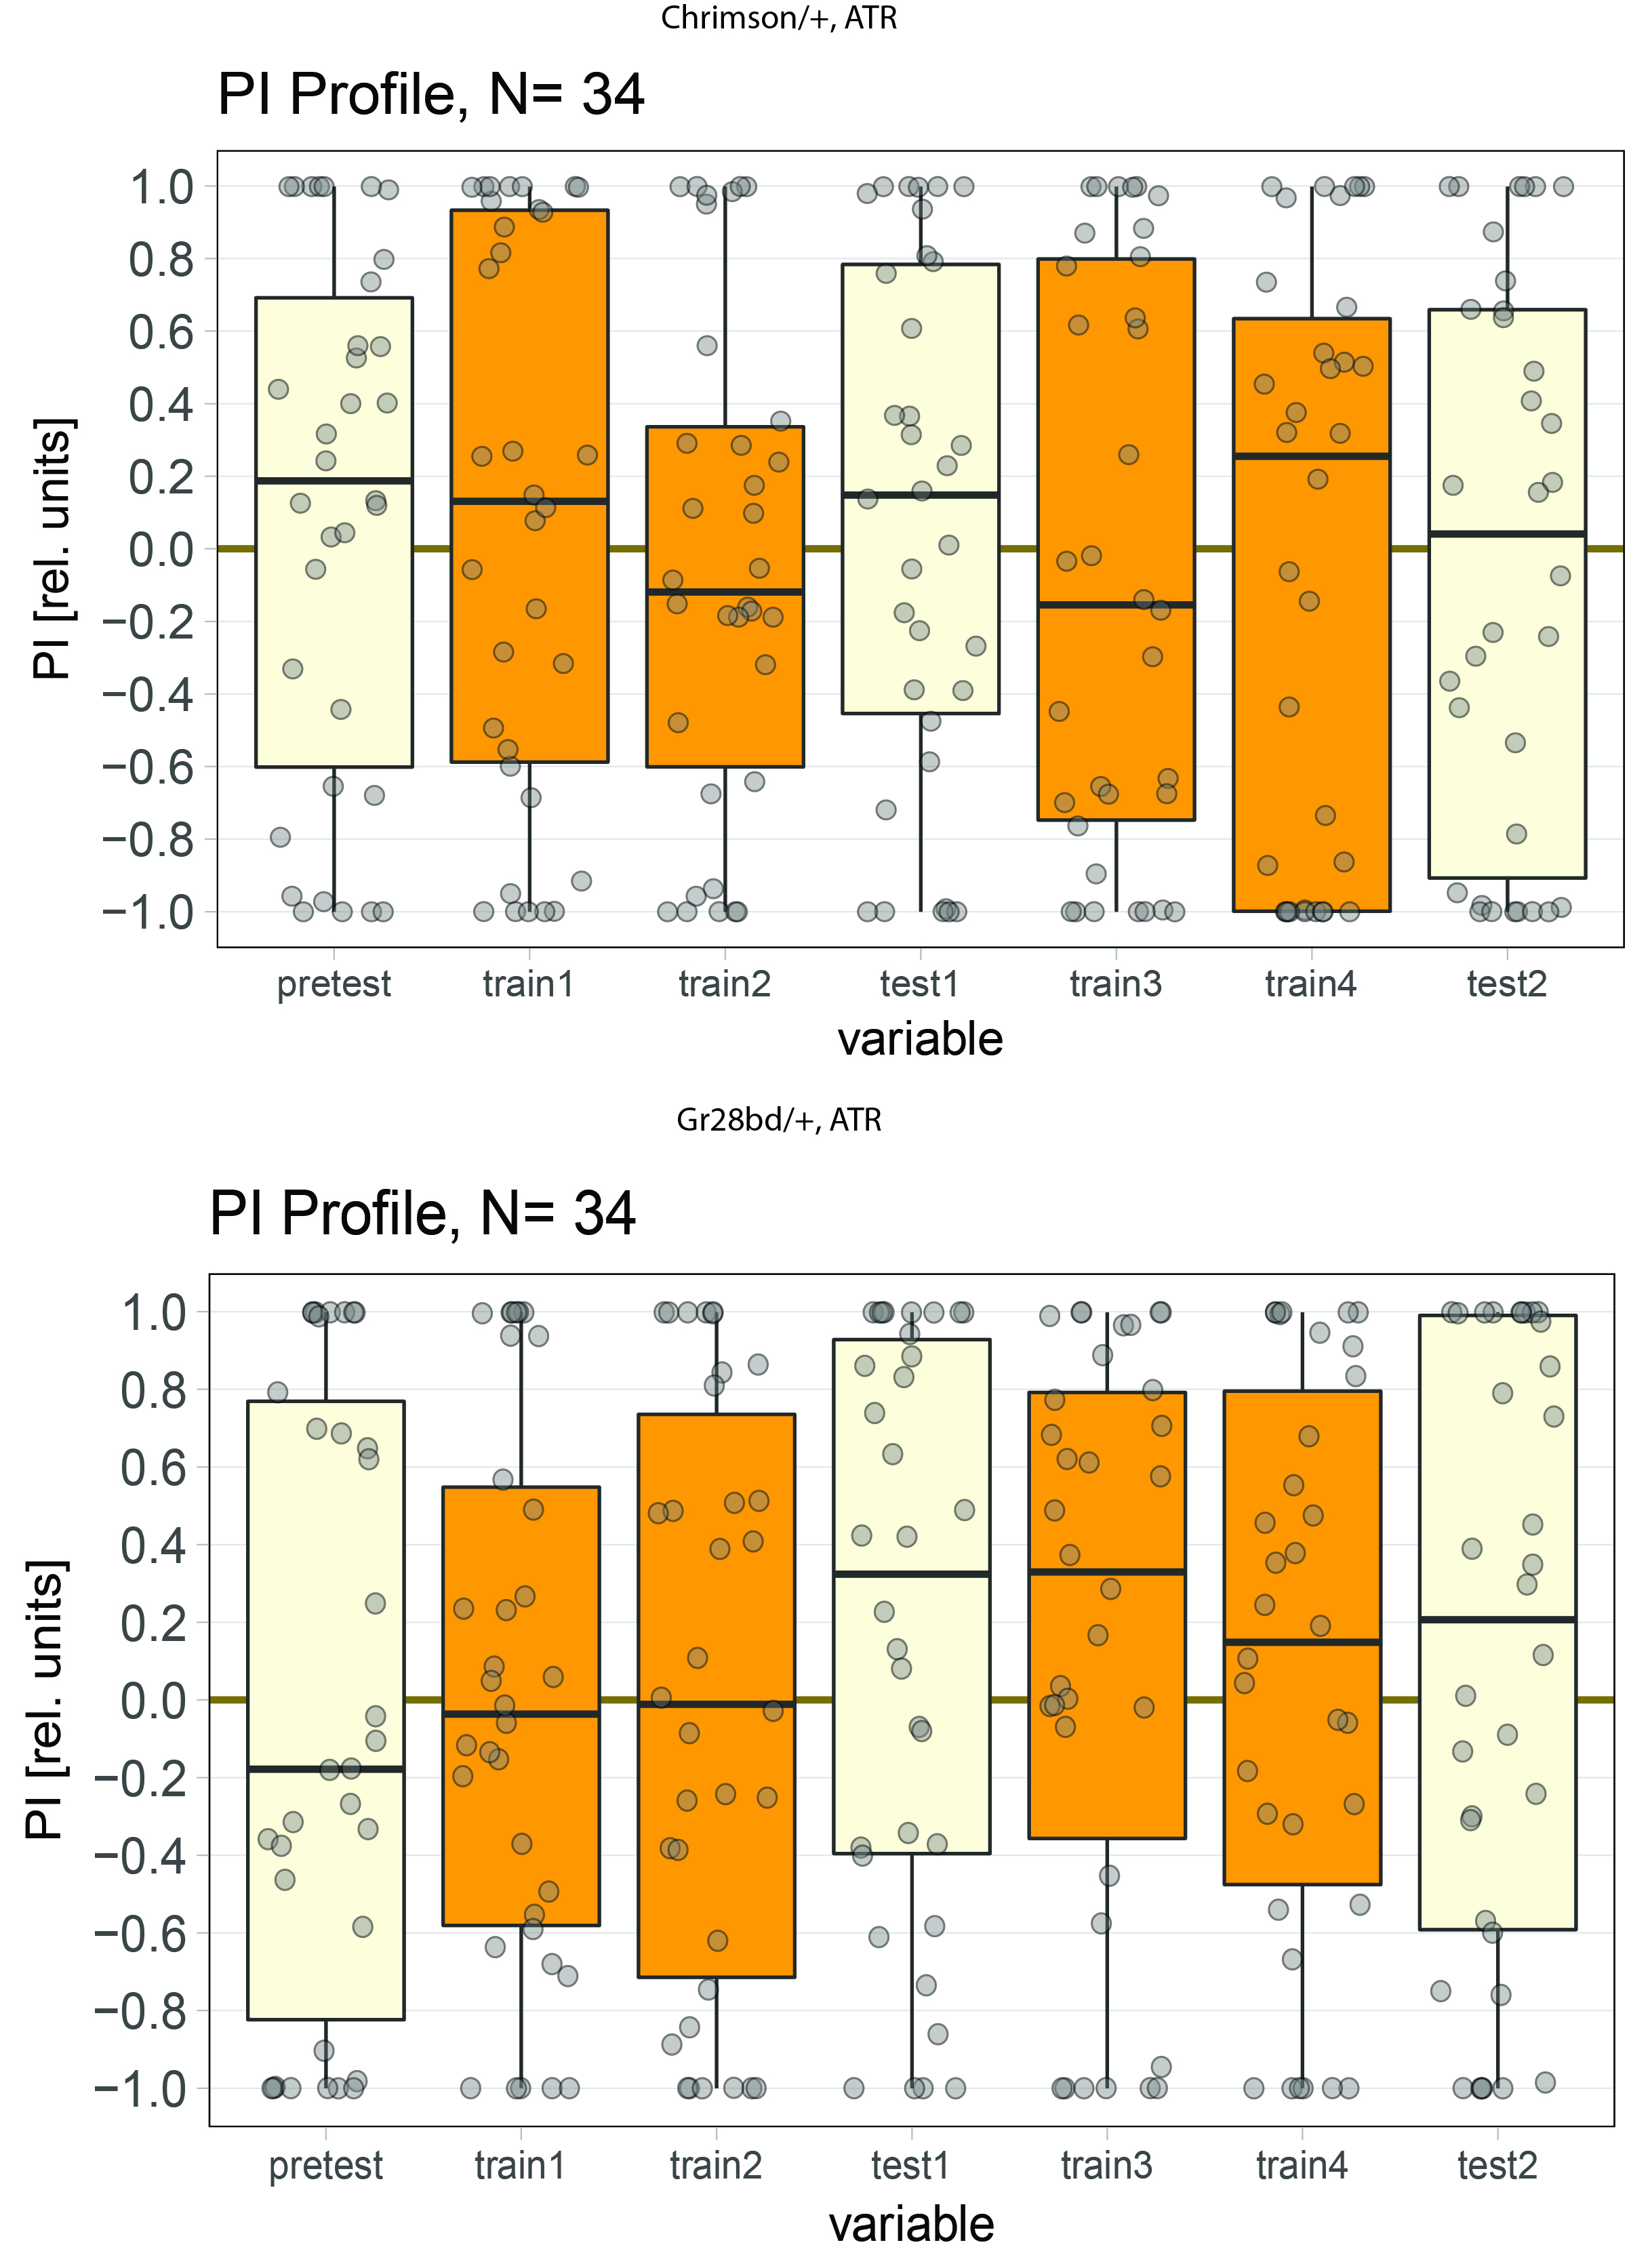
Chrimson/Gr28bd lines tests in yellow light (580nm)
on Monday, December 4th, 2017 2:17 | by Weitian Sun
Category: operant self-learning, Optogenetics | No Comments
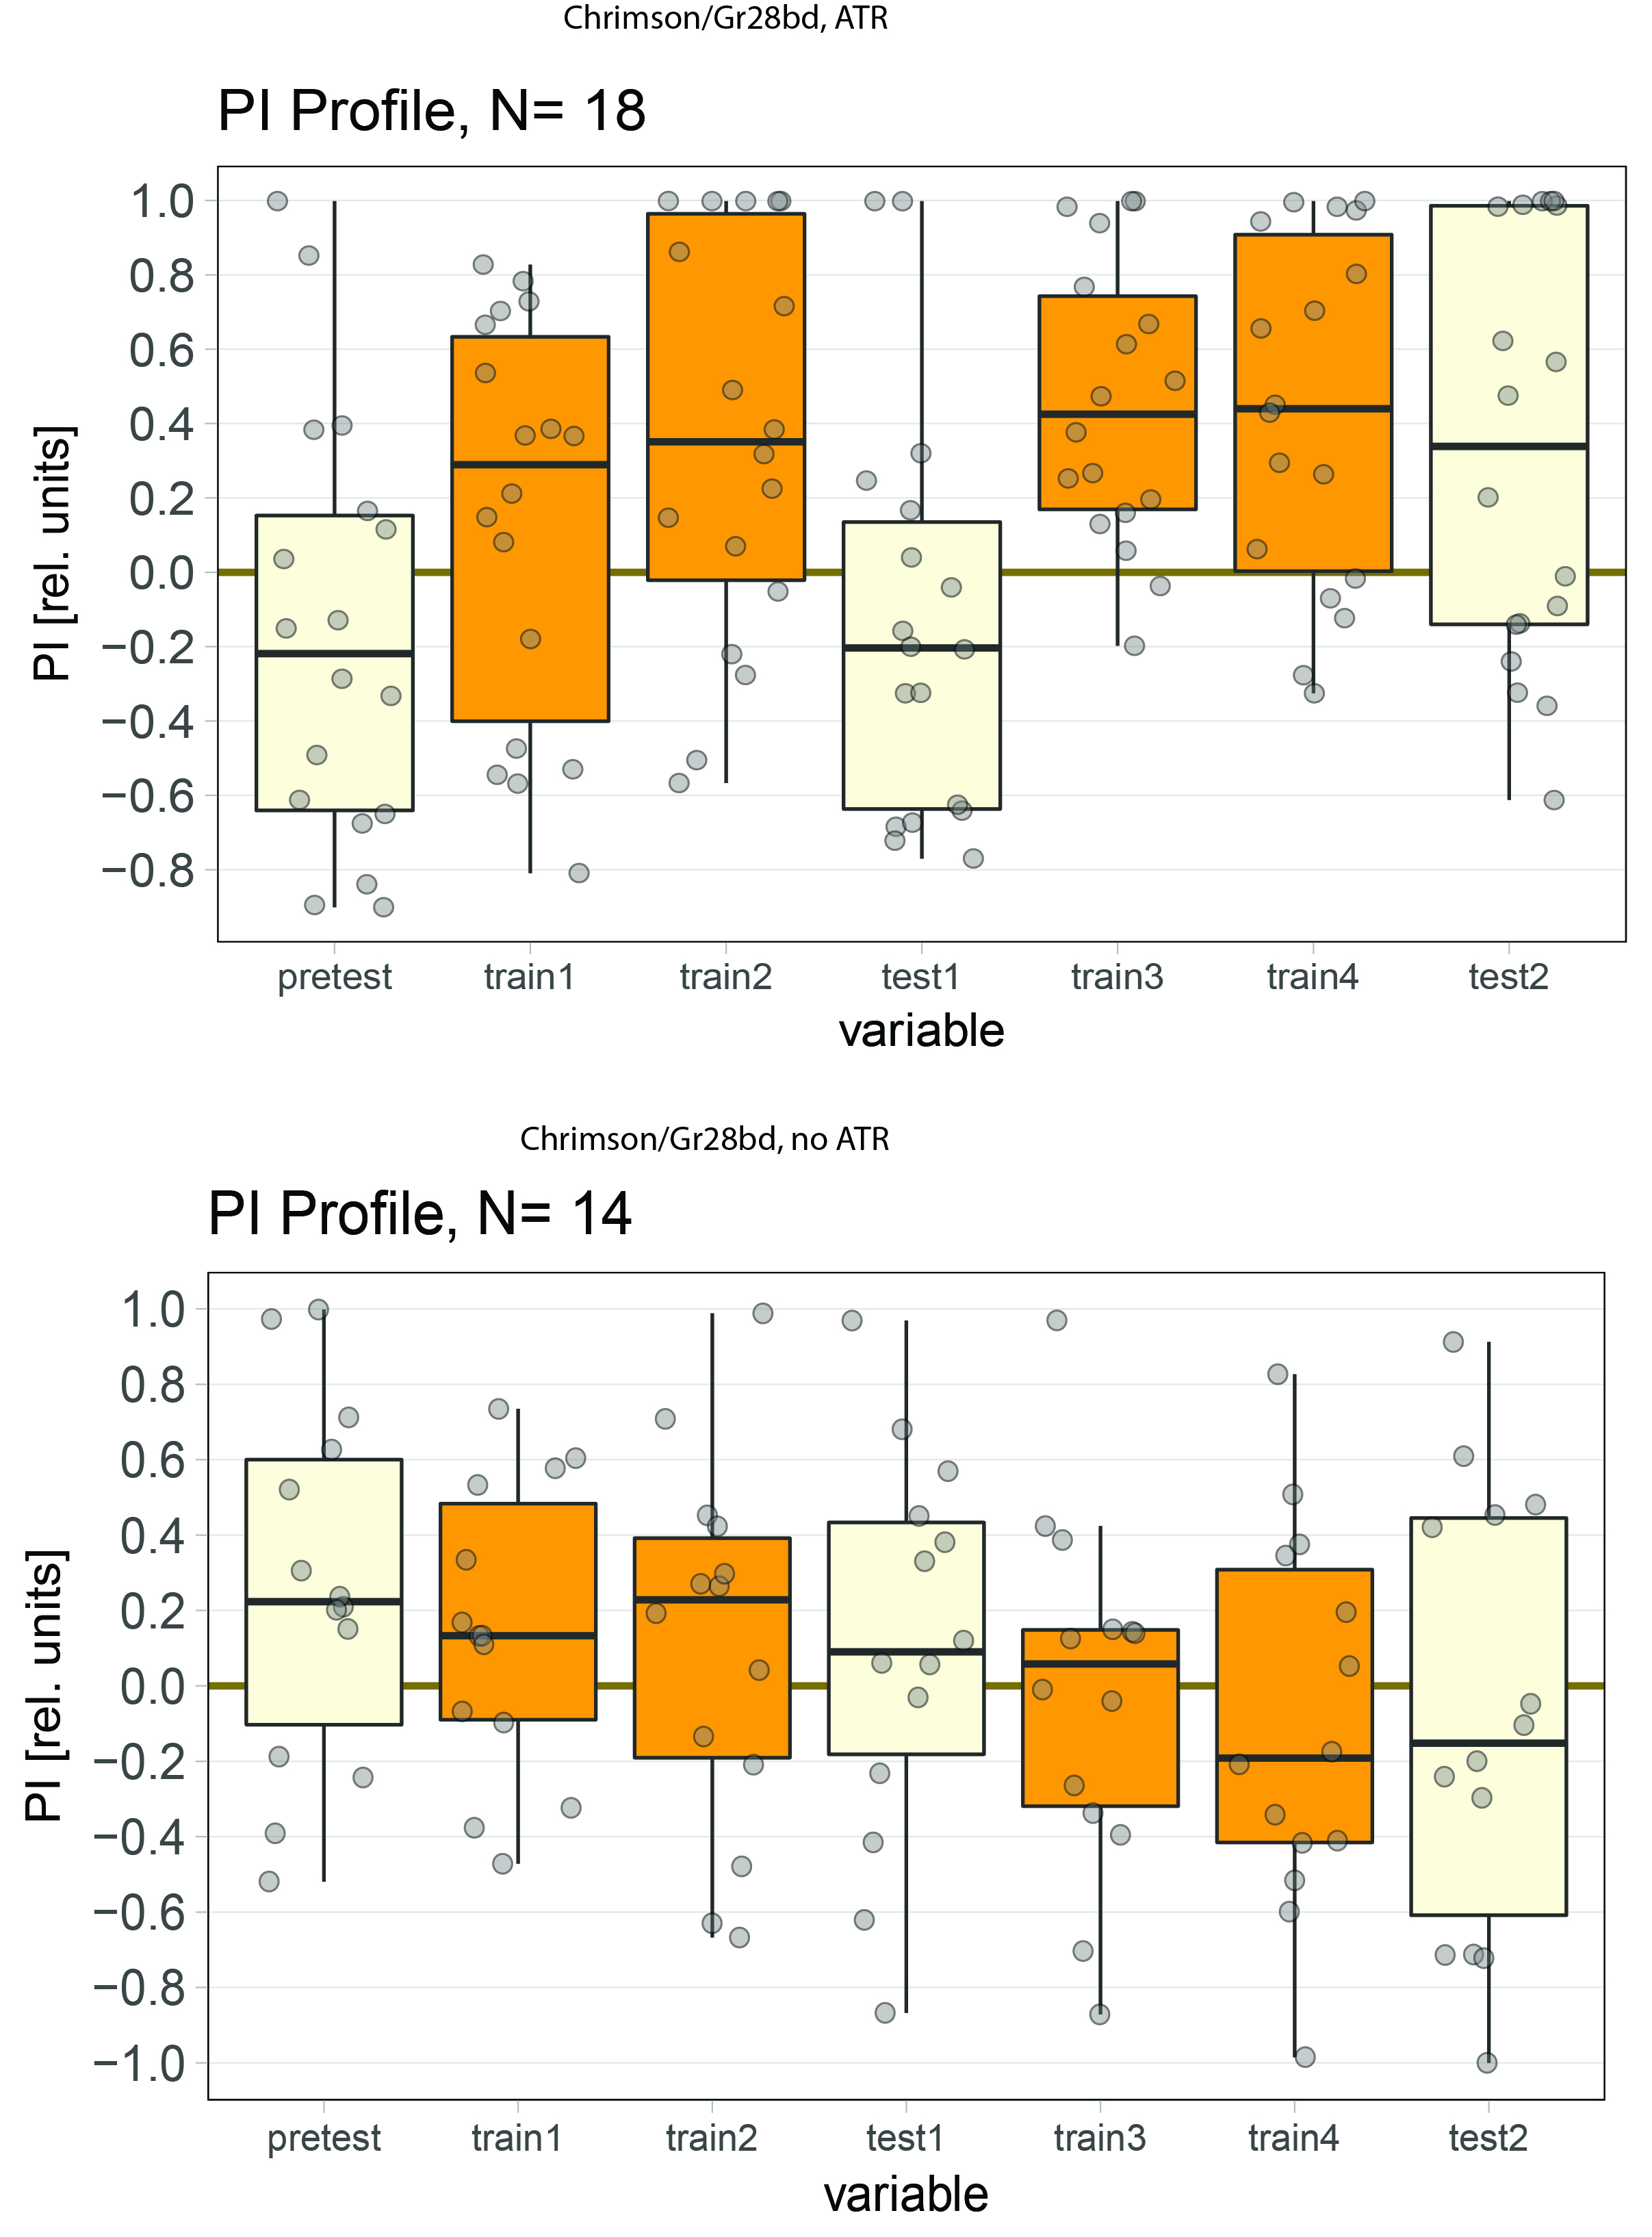
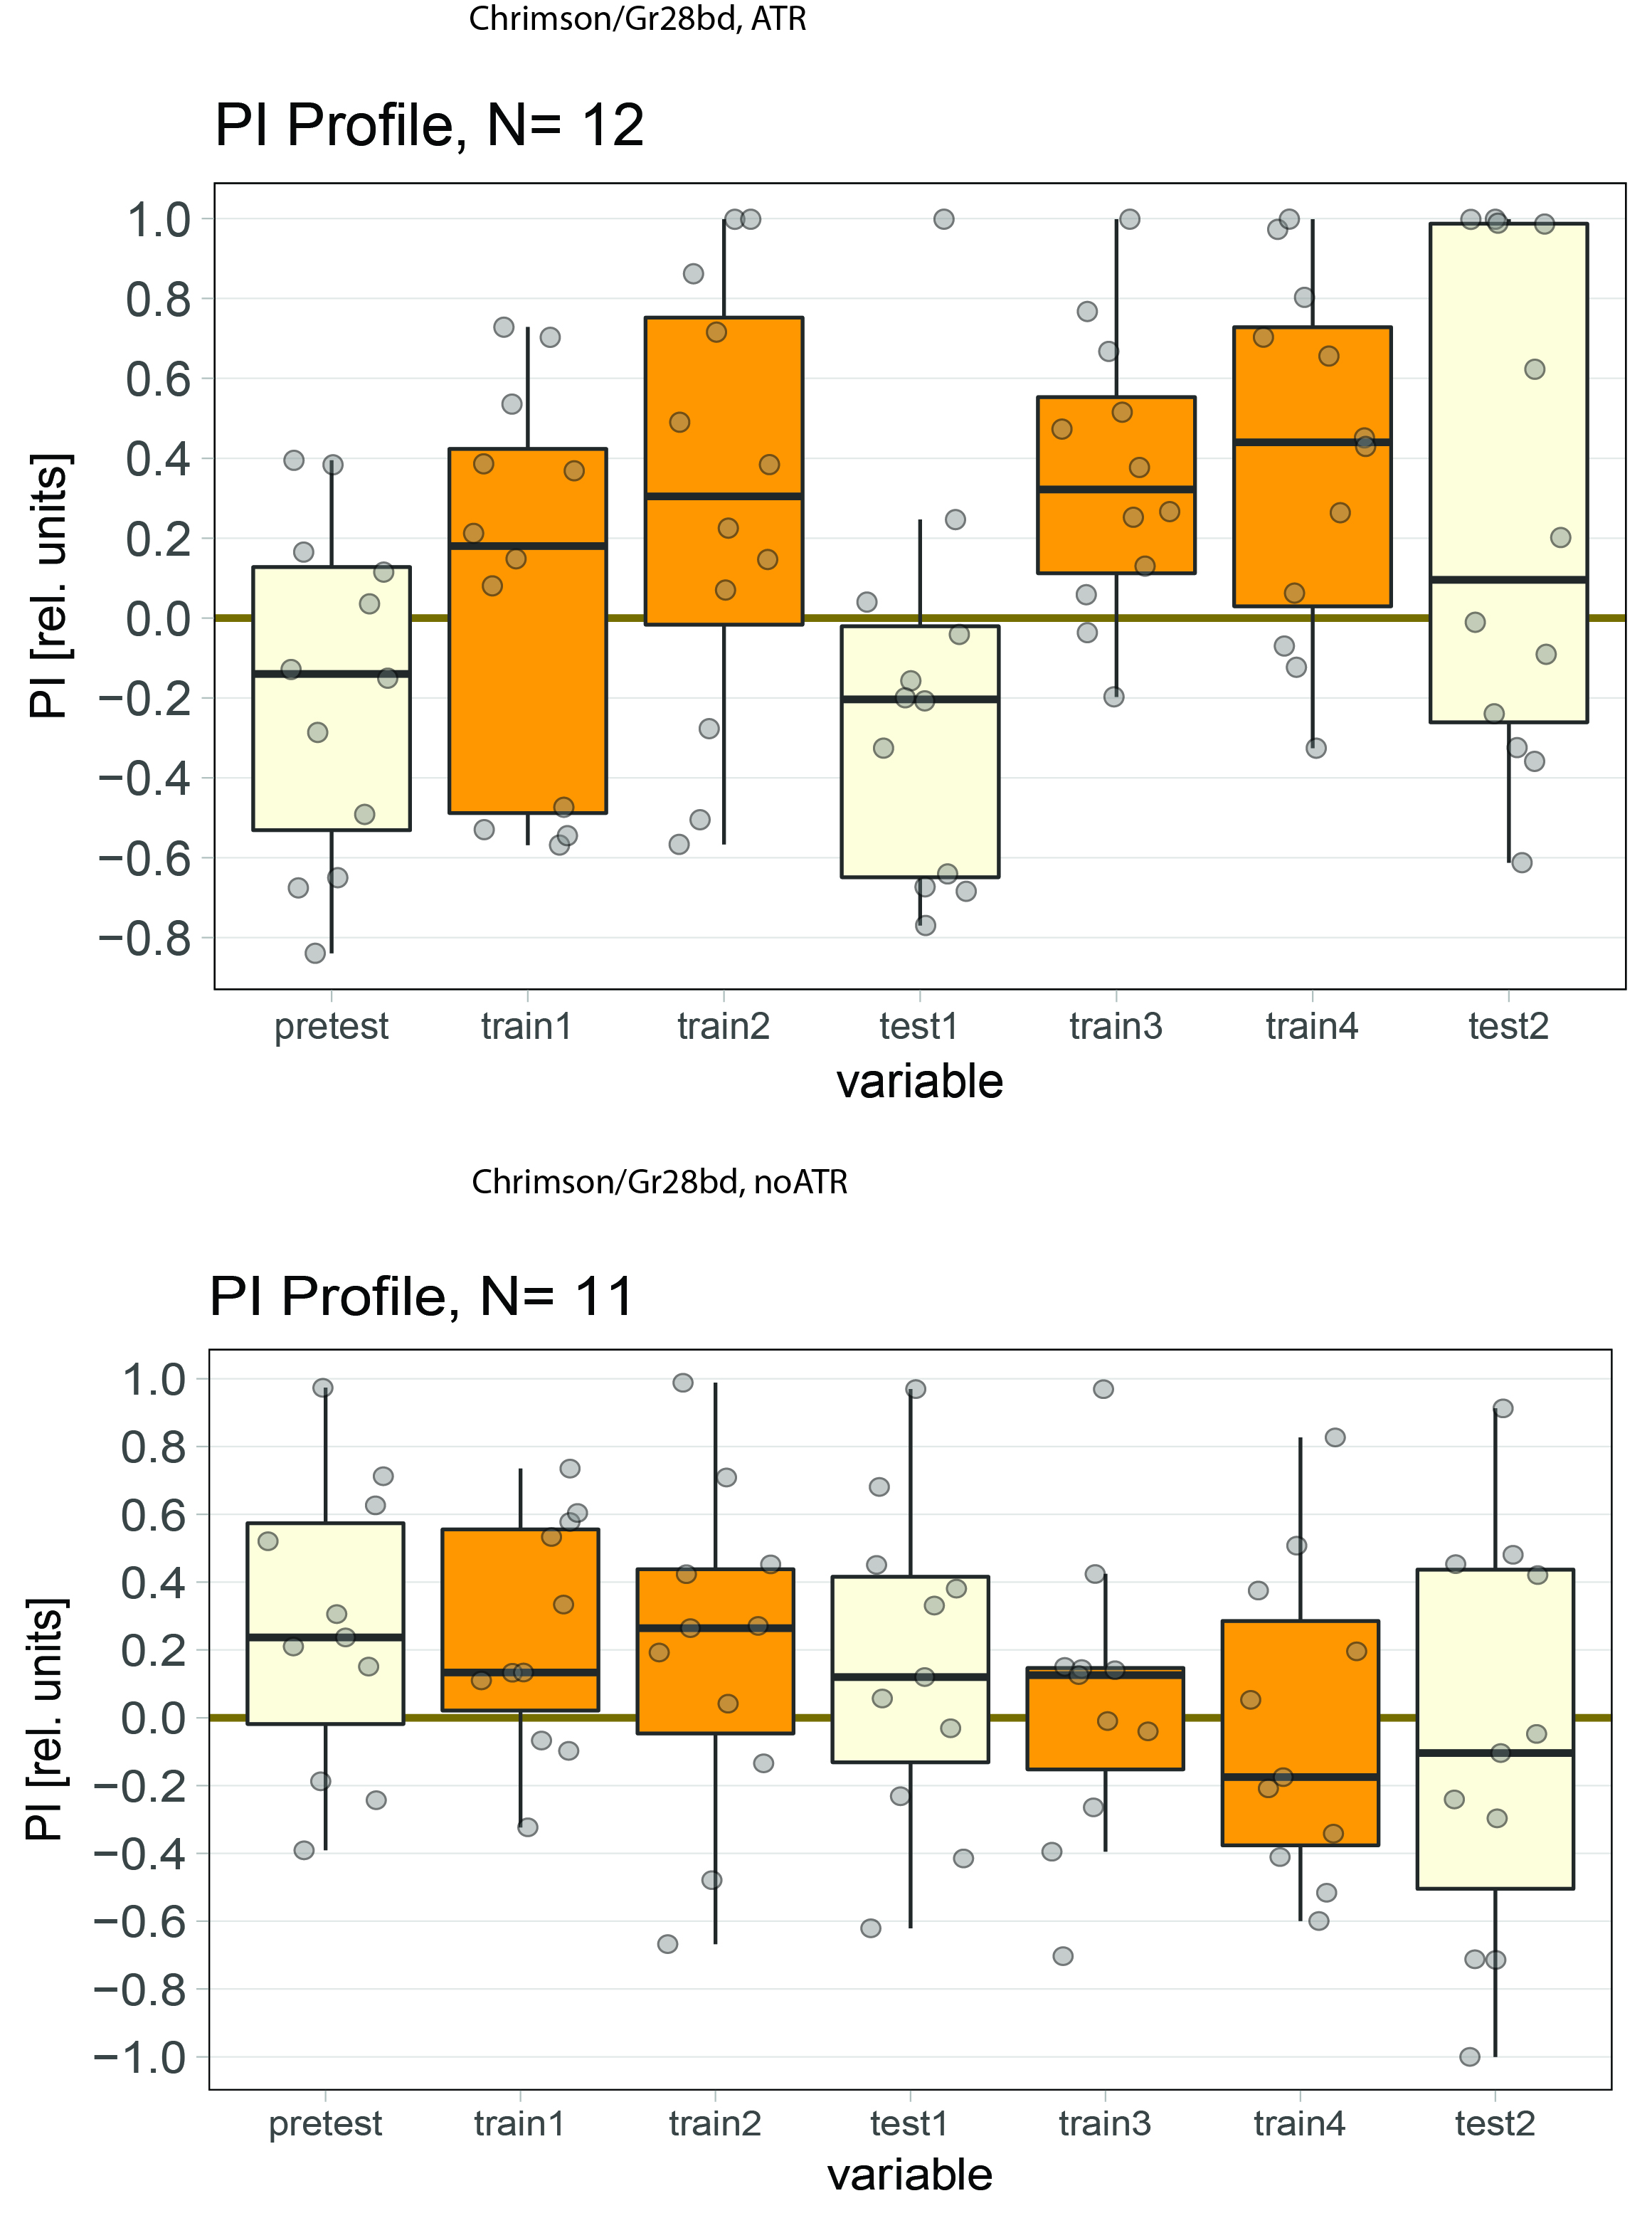
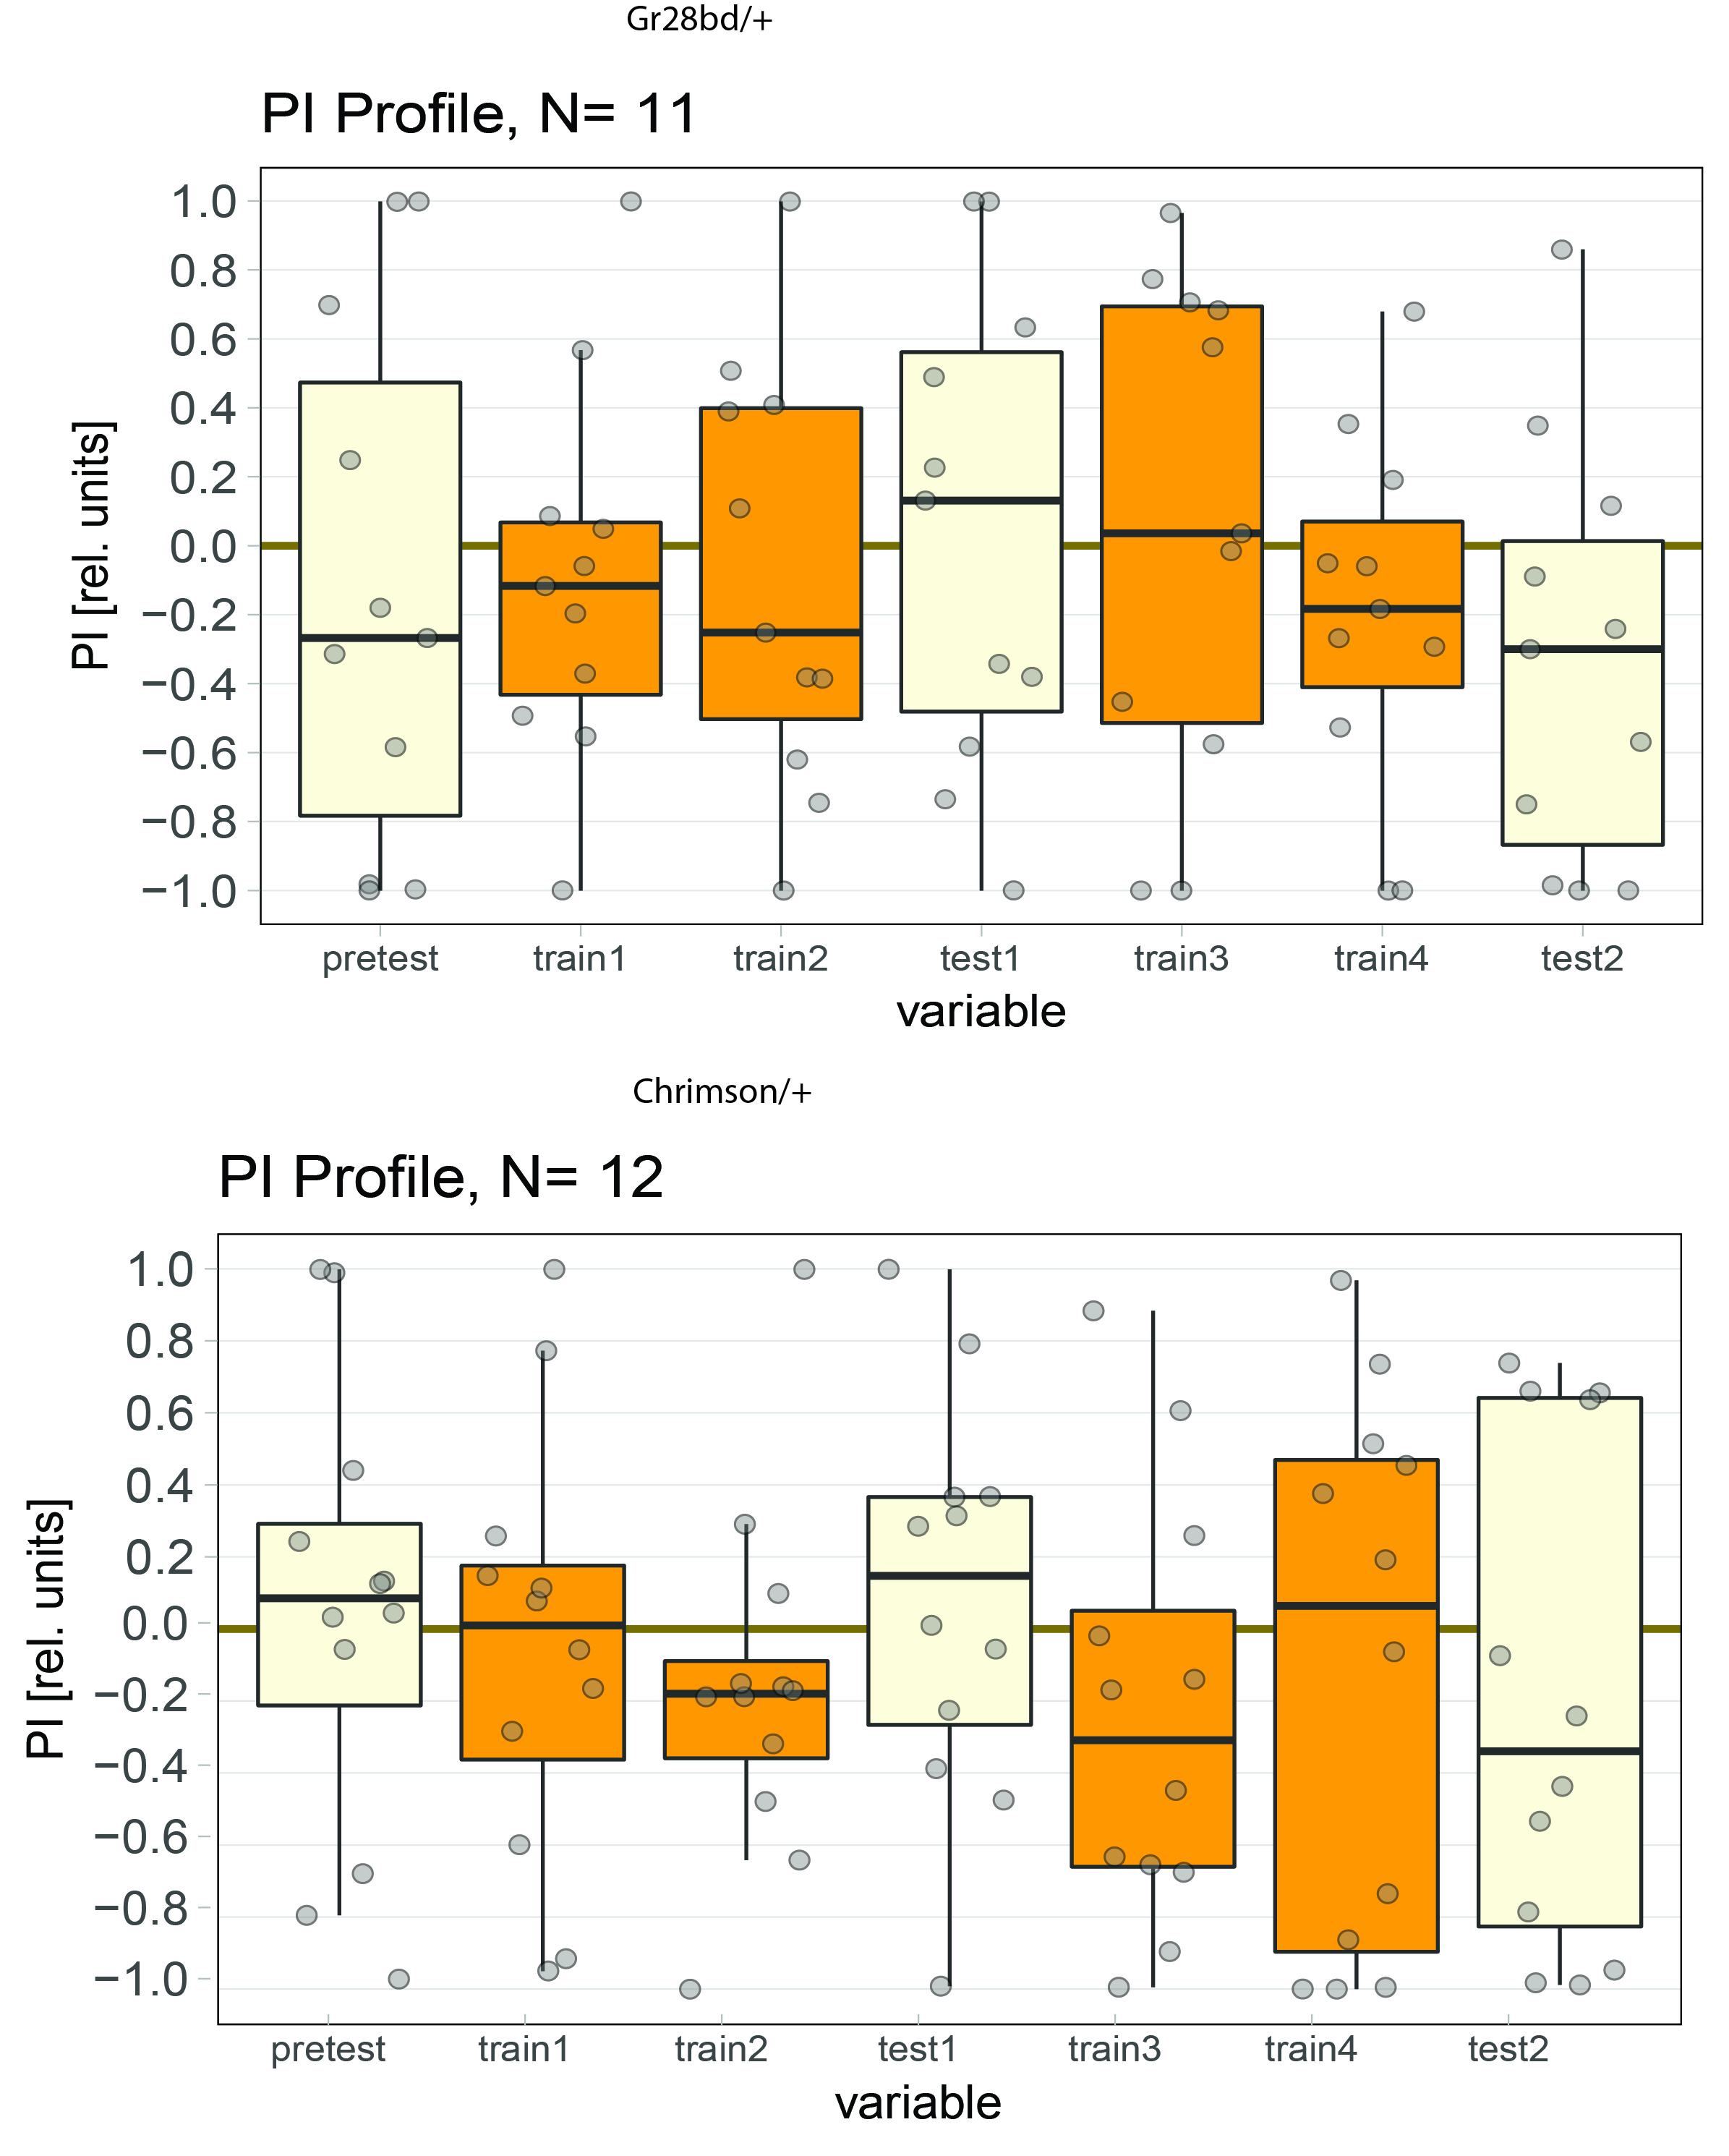
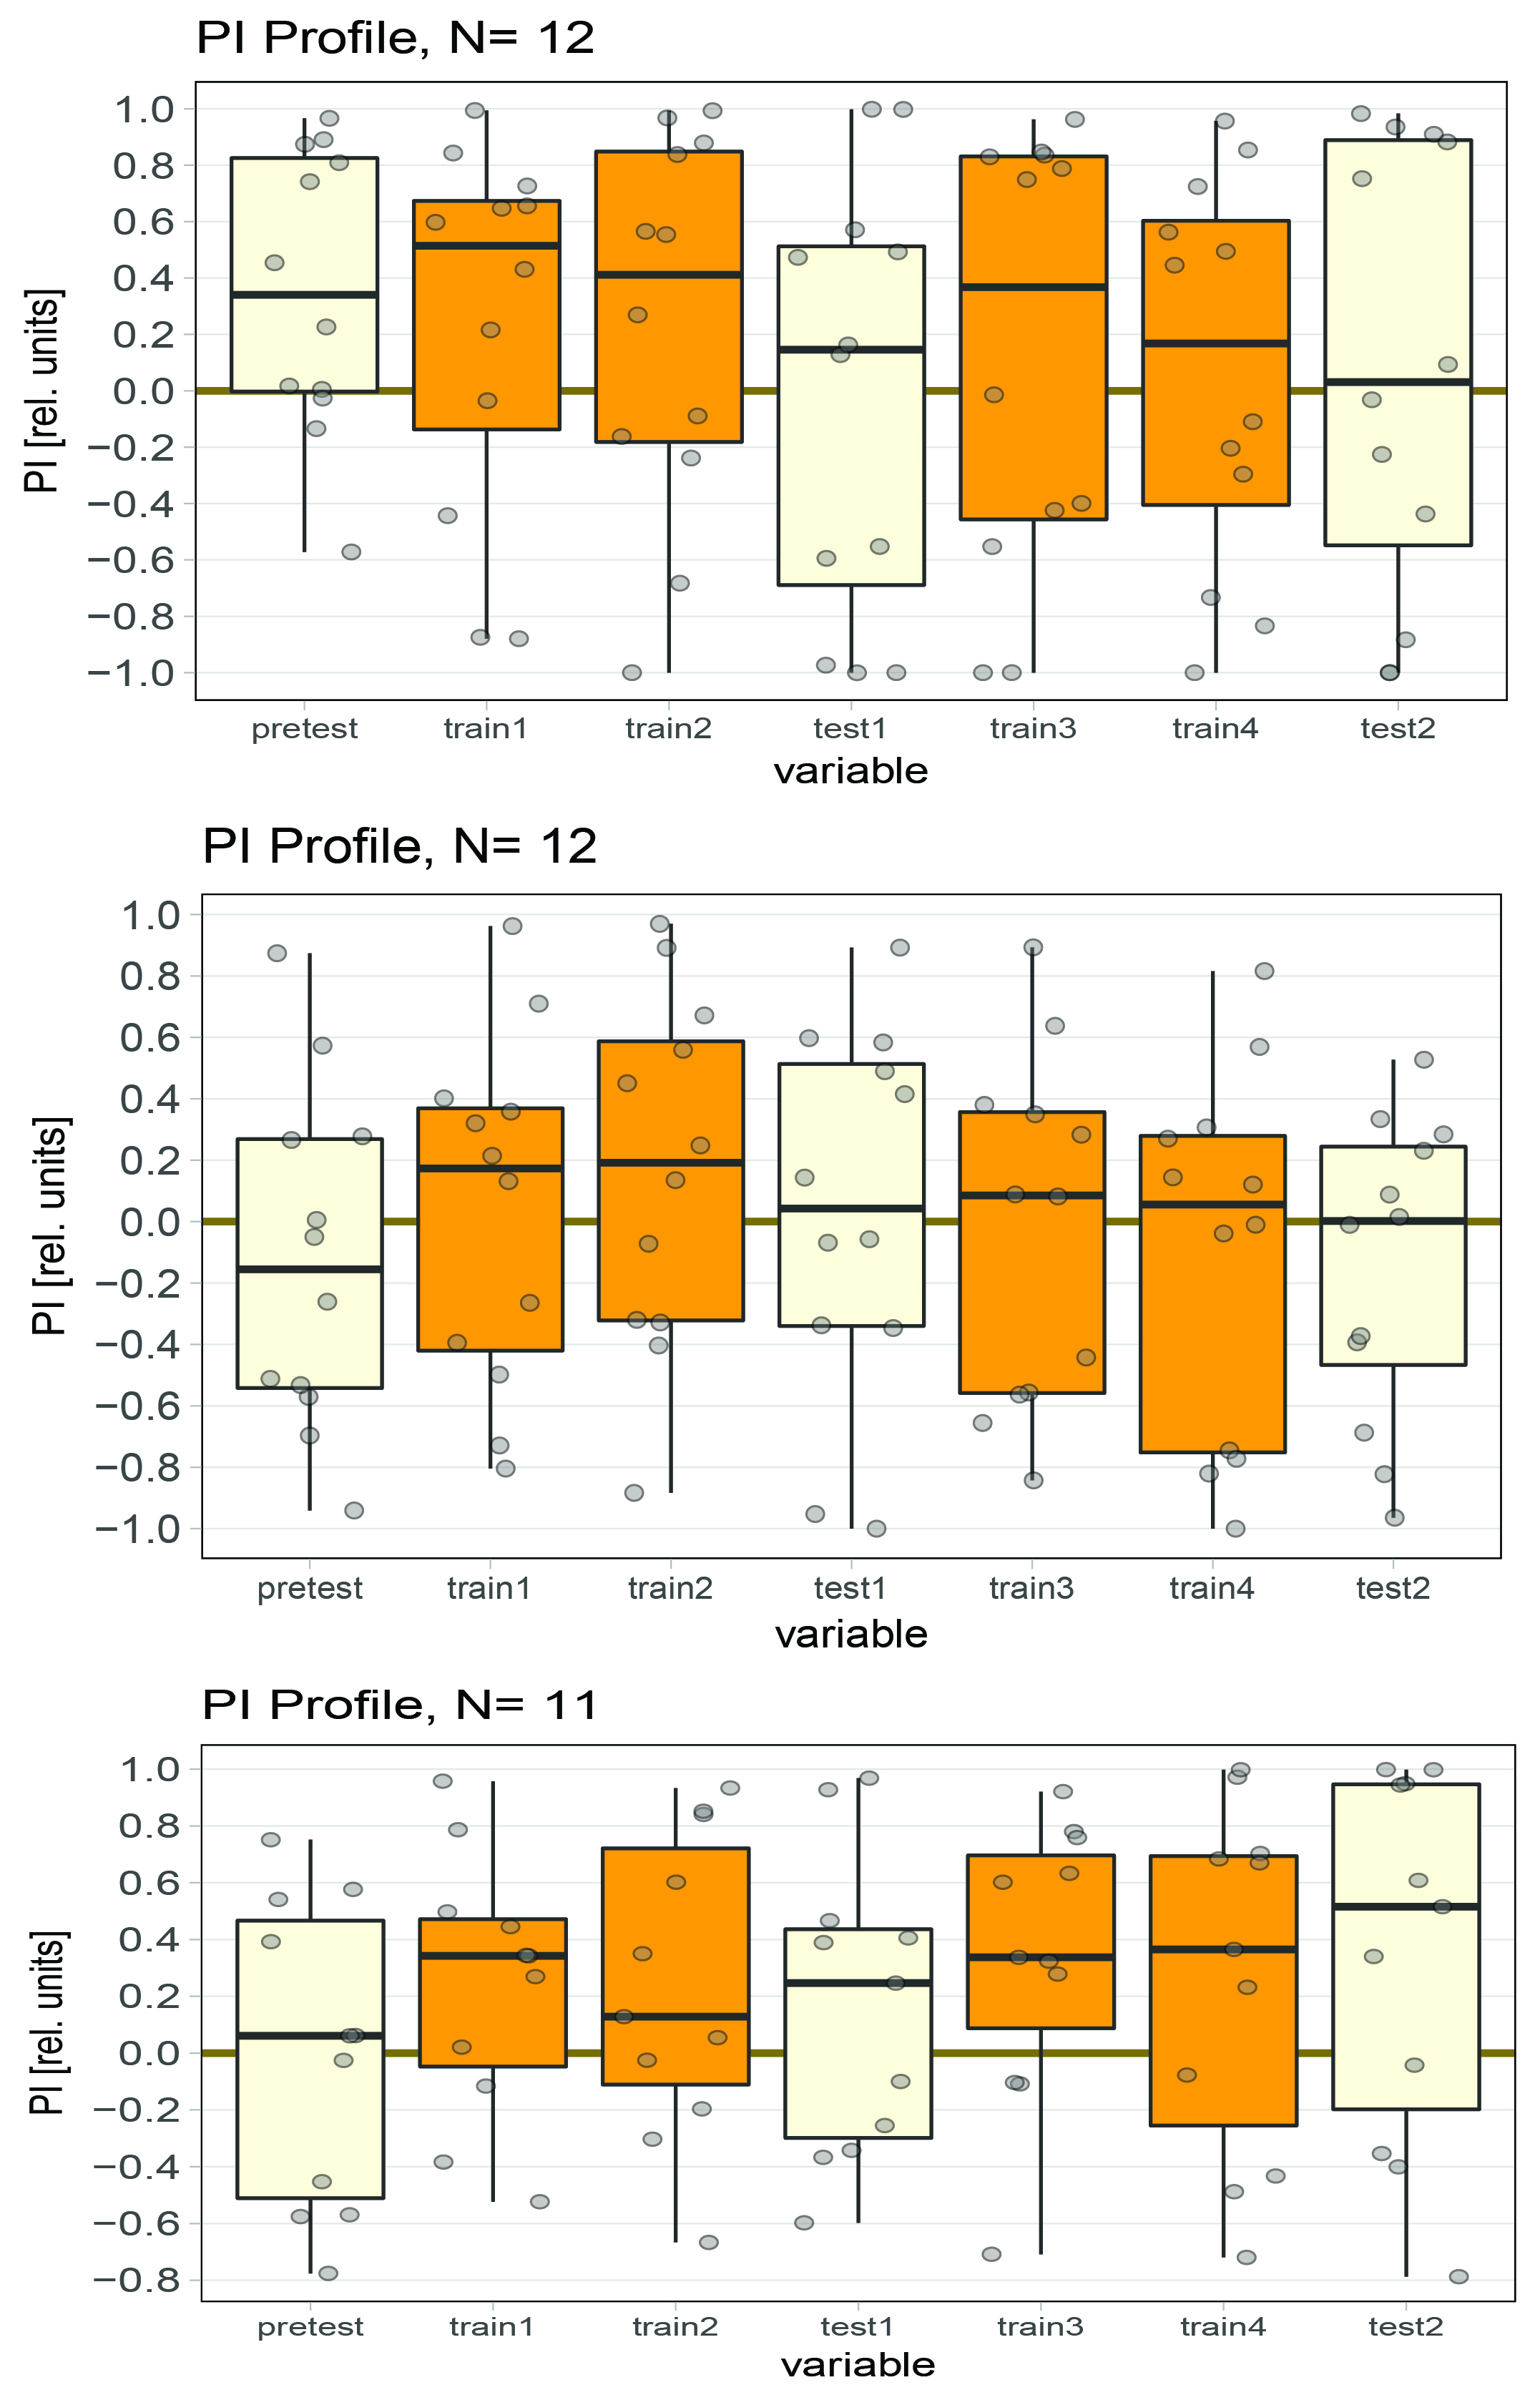
new TrpA/chrimson self-learning tests
on Monday, November 27th, 2017 12:05 | by Weitian Sun
NorpA; Chrimson/Gr28 (N=12, ATR)
NorpA; Chrimson/Gr28 (N012, No ATR)
NorpA;Chrimson/+ (N=11, ATR)
Category: operant self-learning | No Comments
Normal vision on platform test
on Monday, October 2nd, 2017 11:08 | by Weitian Sun
Category: operant self-learning, Optogenetics | No Comments
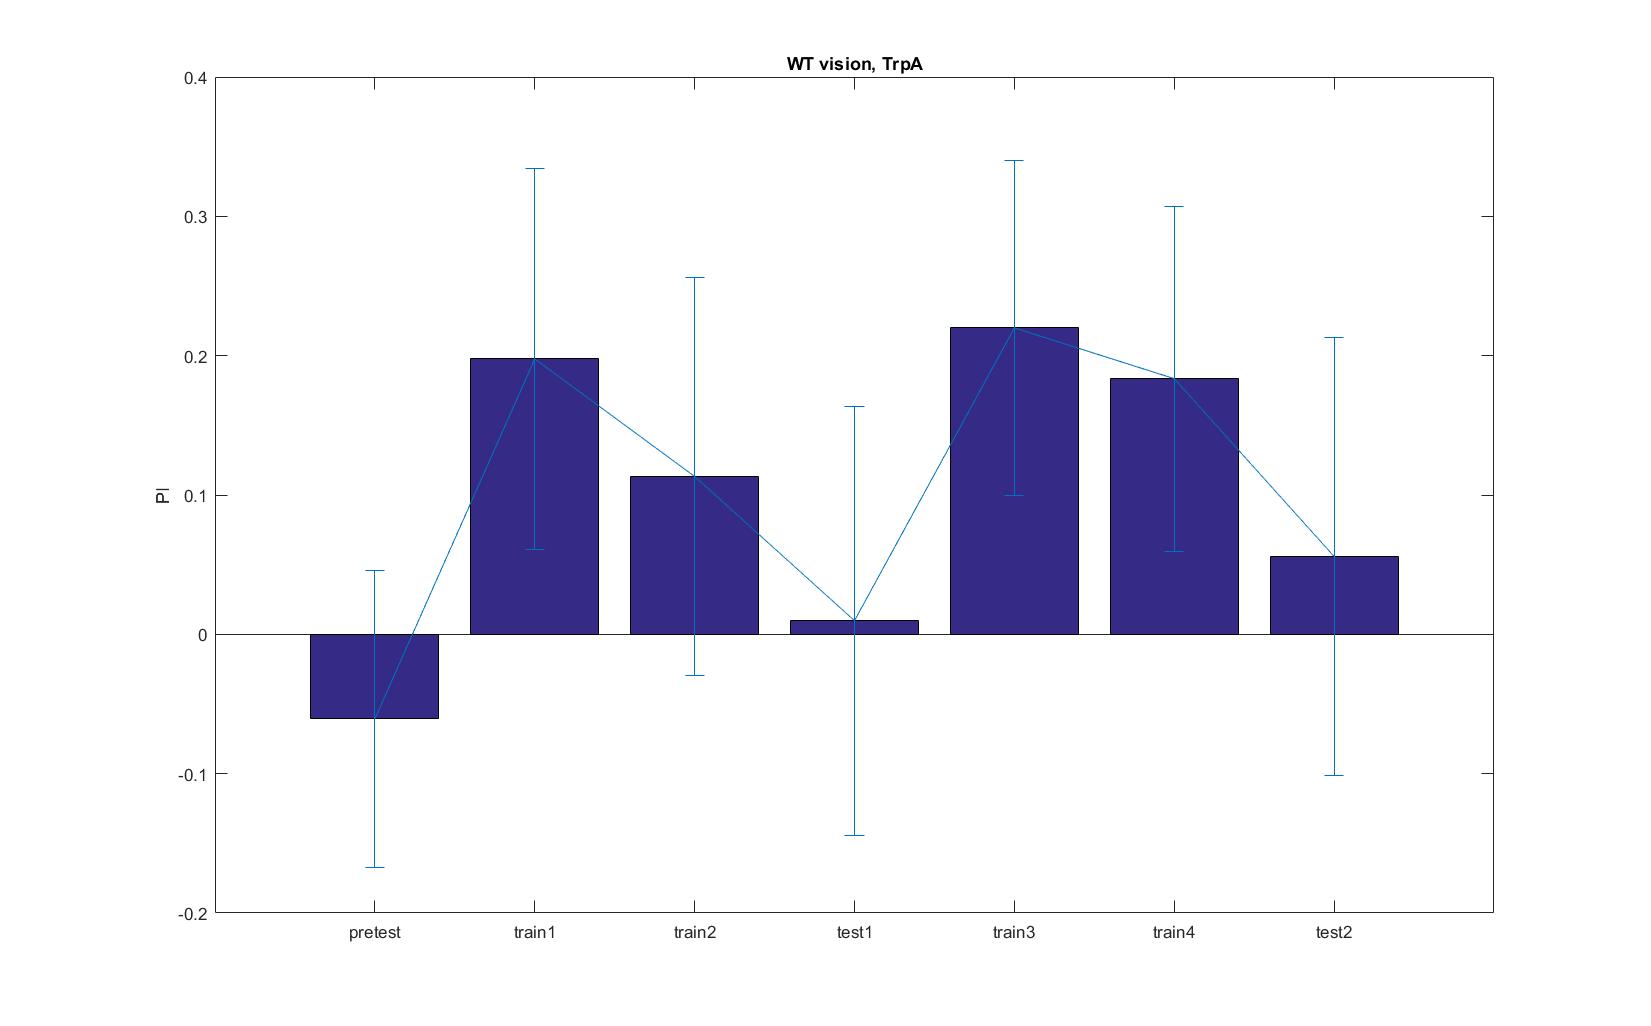
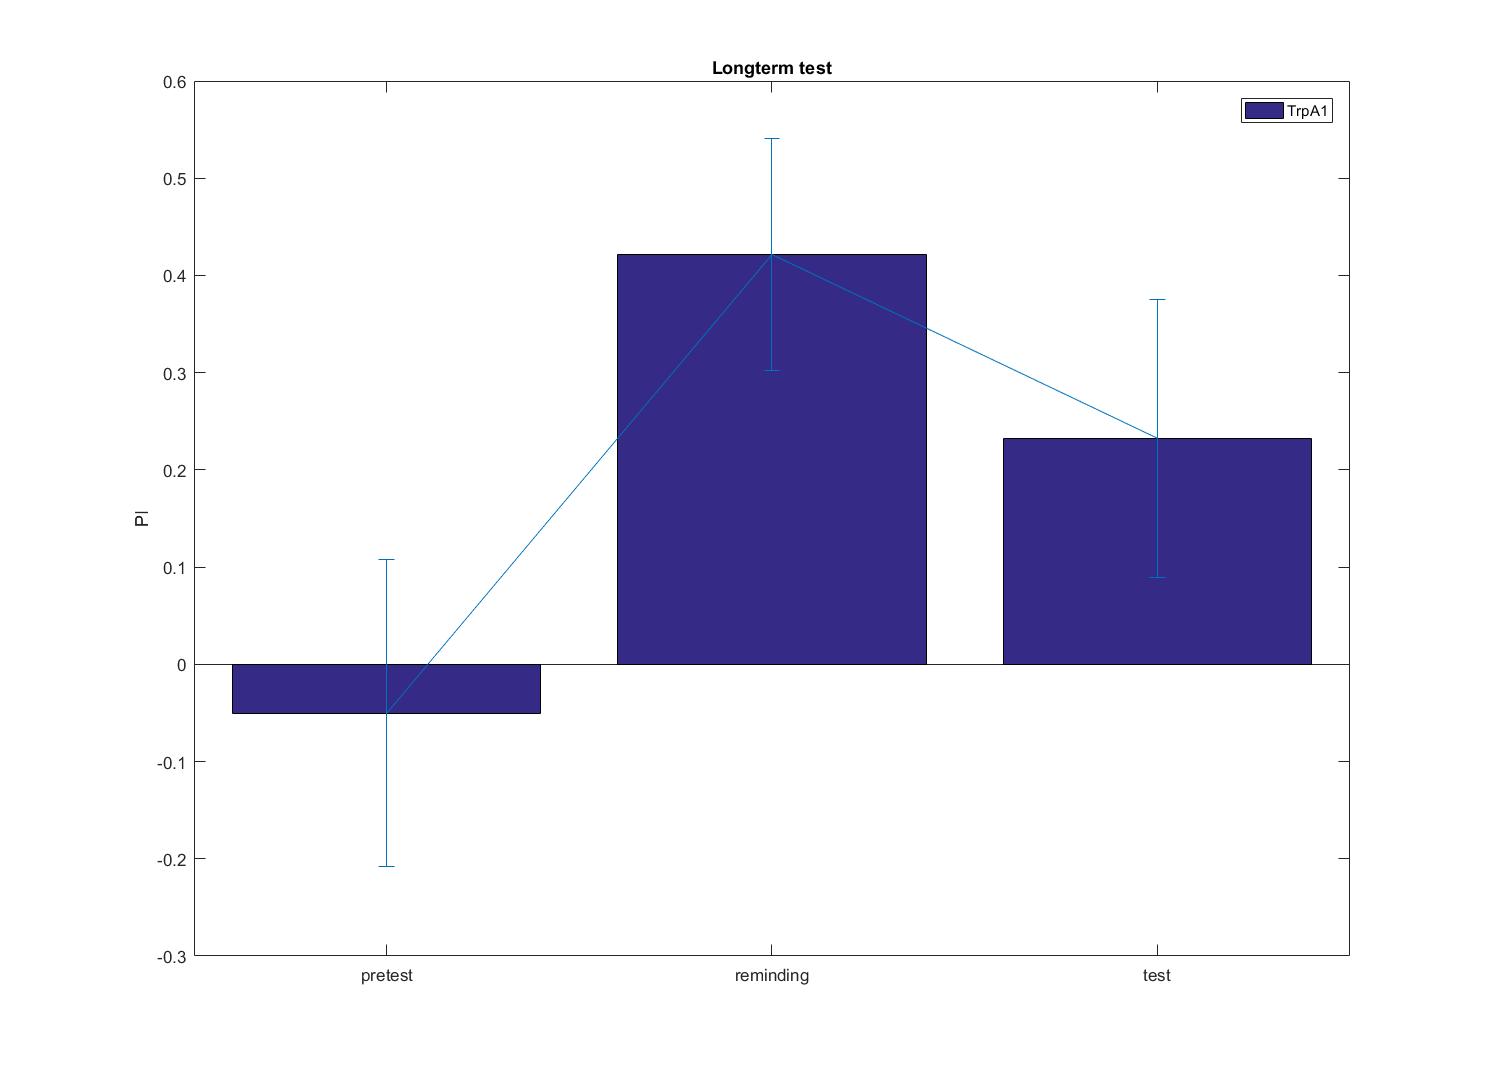
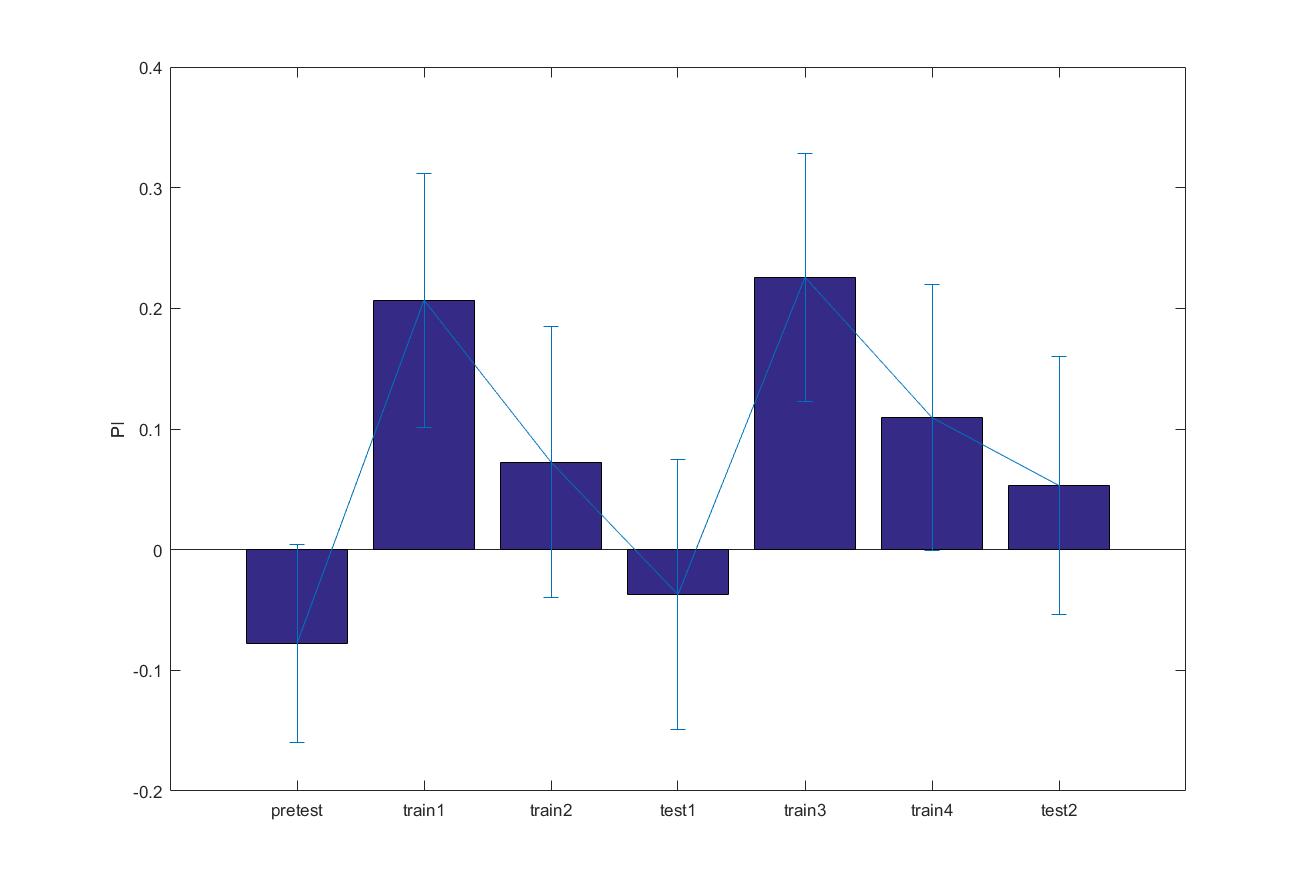
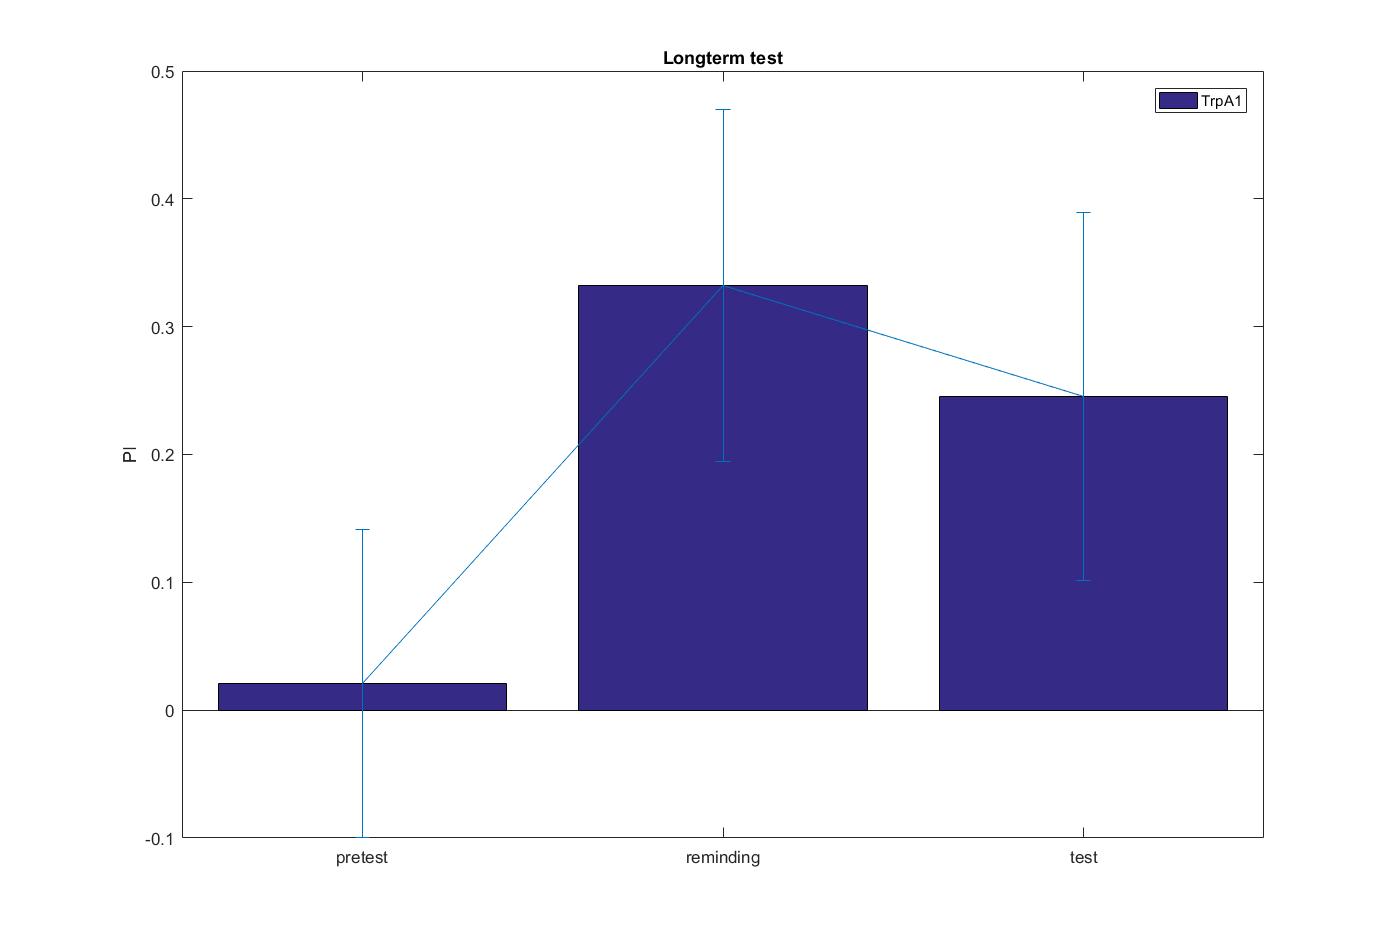
Self learning test and long-term memory test of TrpA1 from optogenetic training
on Monday, September 4th, 2017 2:20 | by Weitian Sun
TrpA1 self learning test, N= 47
TrpA1 long term memory, N= 39
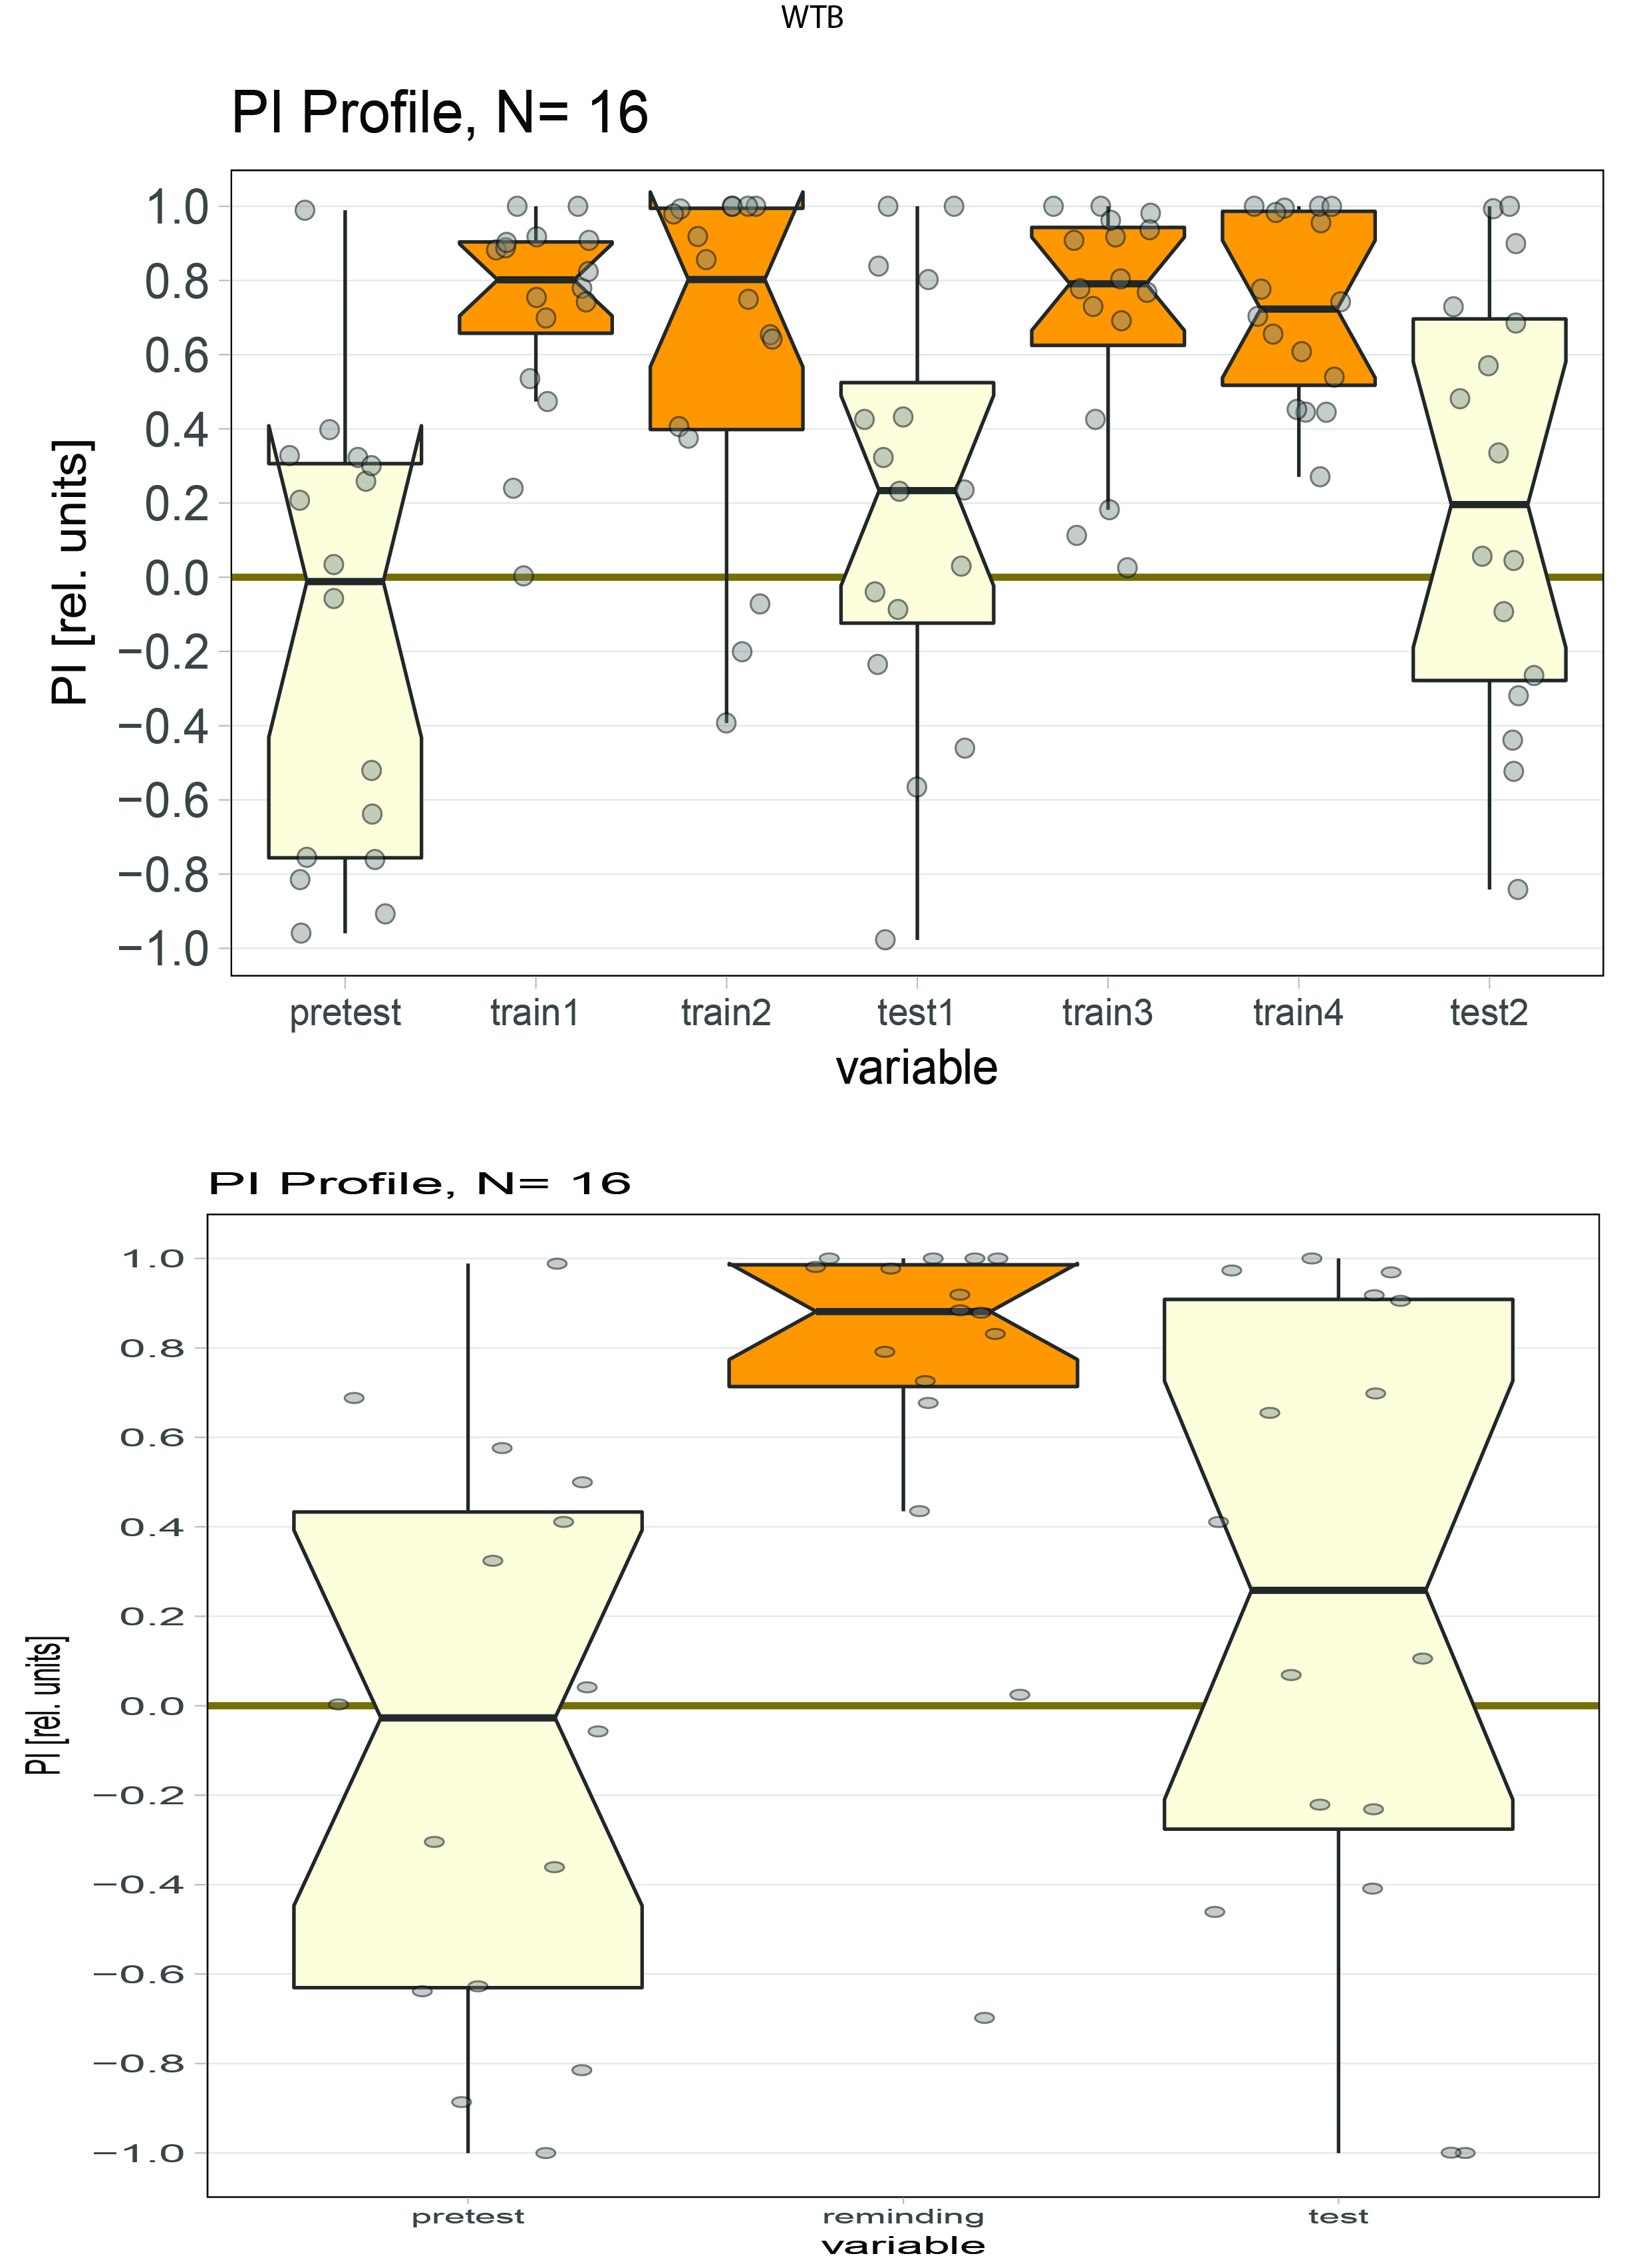
Wtb long term memory (previous on fly simulator), N= 16
Category: operant self-learning | No Comments
self-learning update
on Friday, July 21st, 2017 4:11 | by Weitian Sun
N= 31
Category: operant self-learning | No Comments
update on self learning test comparsion
on Monday, July 17th, 2017 12:40 | by Weitian Sun
30 from each lines, no statistially difference among them. I will keeping testing on flight simultor before transgenic flies hatch.


Category: operant self-learning | No Comments
Correct the longterm memory results
on Friday, June 30th, 2017 3:29 | by Weitian Sun
Category: operant self-learning | No Comments