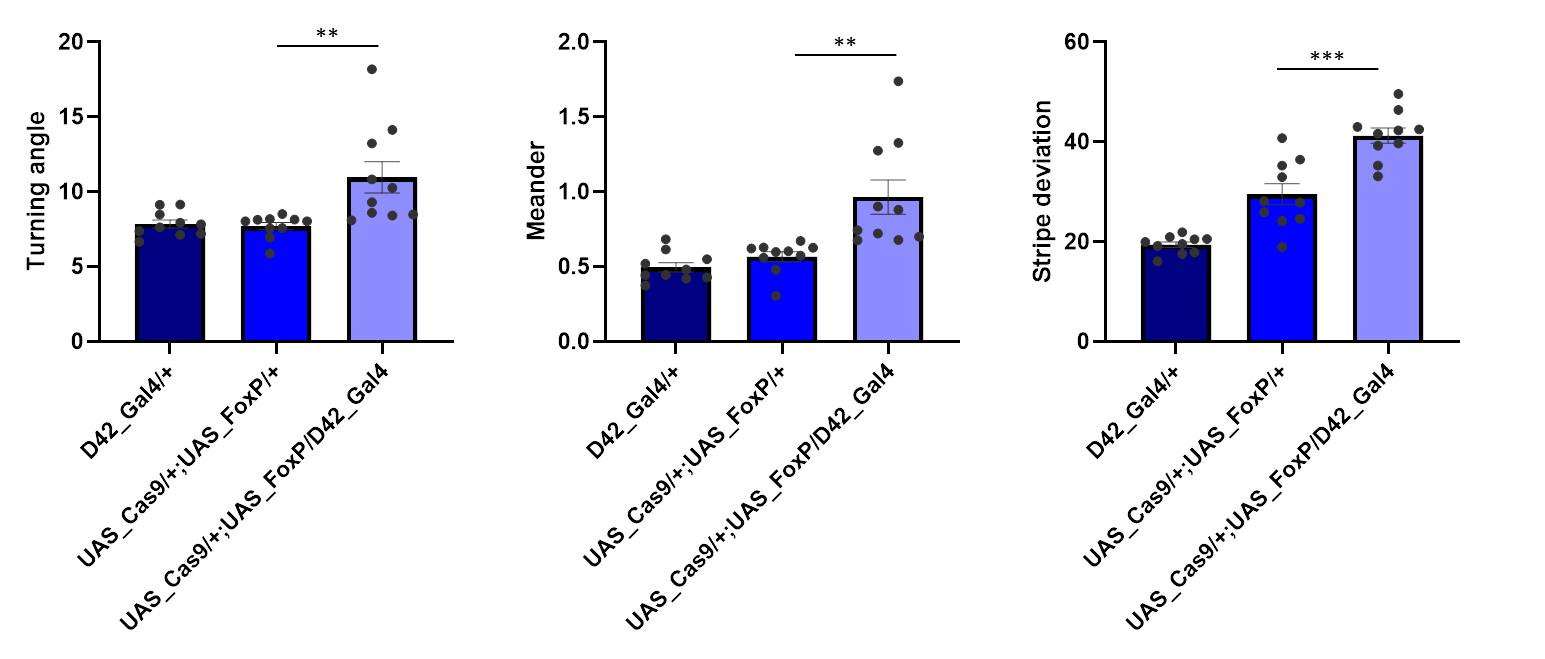
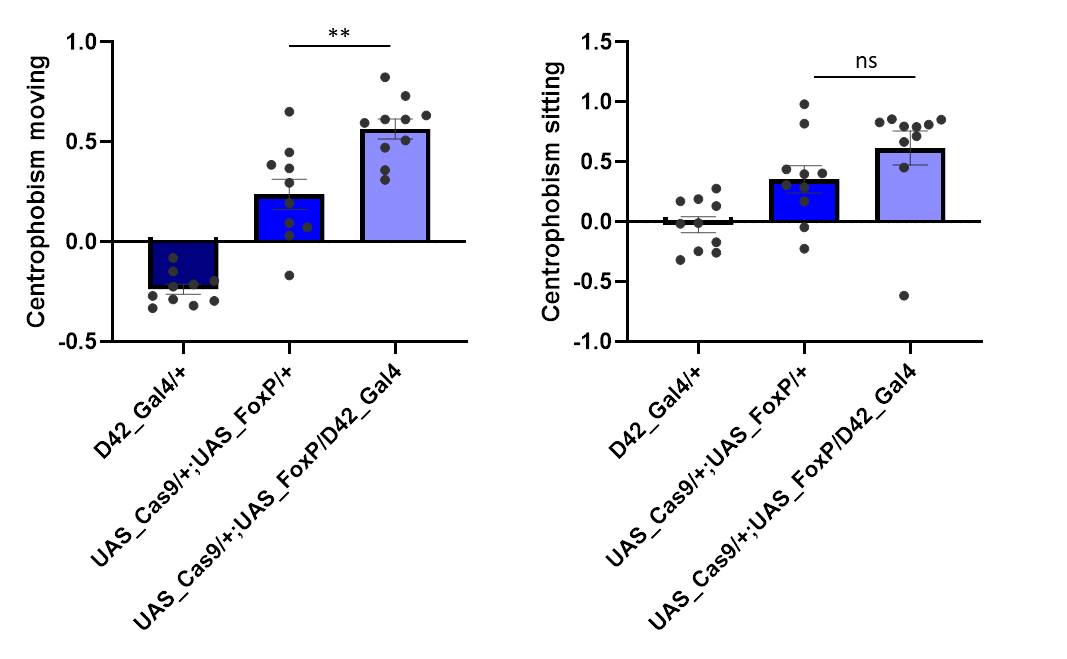
Cas9 controls show a bit of genetic background
on Tuesday, April 2nd, 2019 2:12 | by Ottavia Palazzo

Category: buridan, Foxp | No Comments
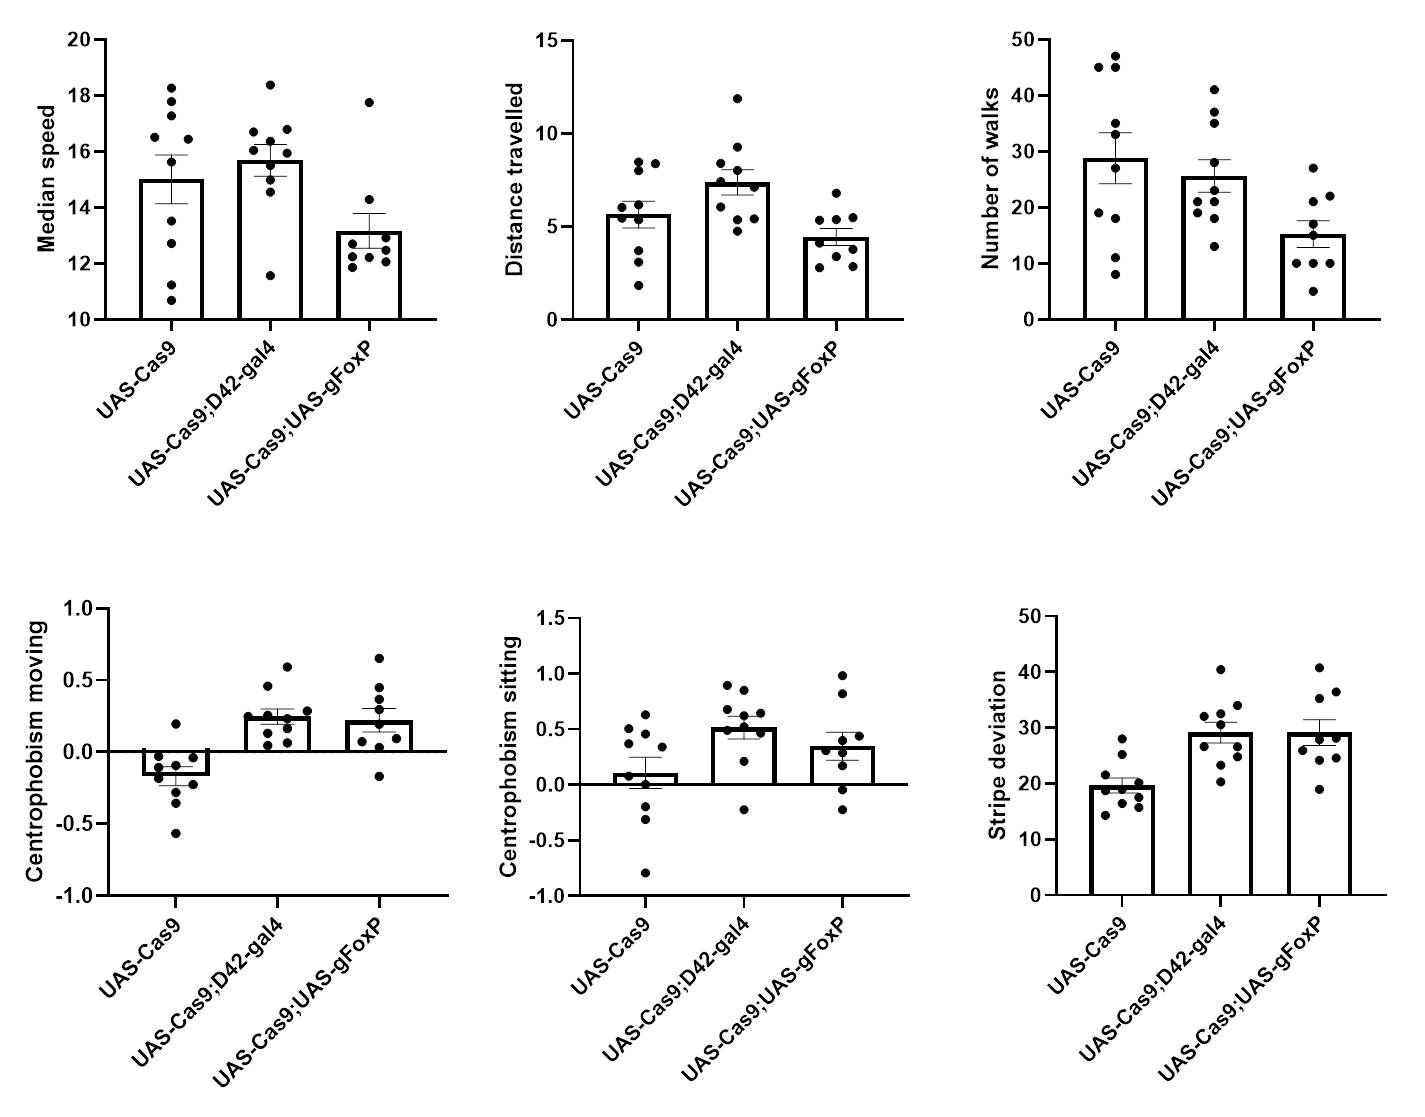
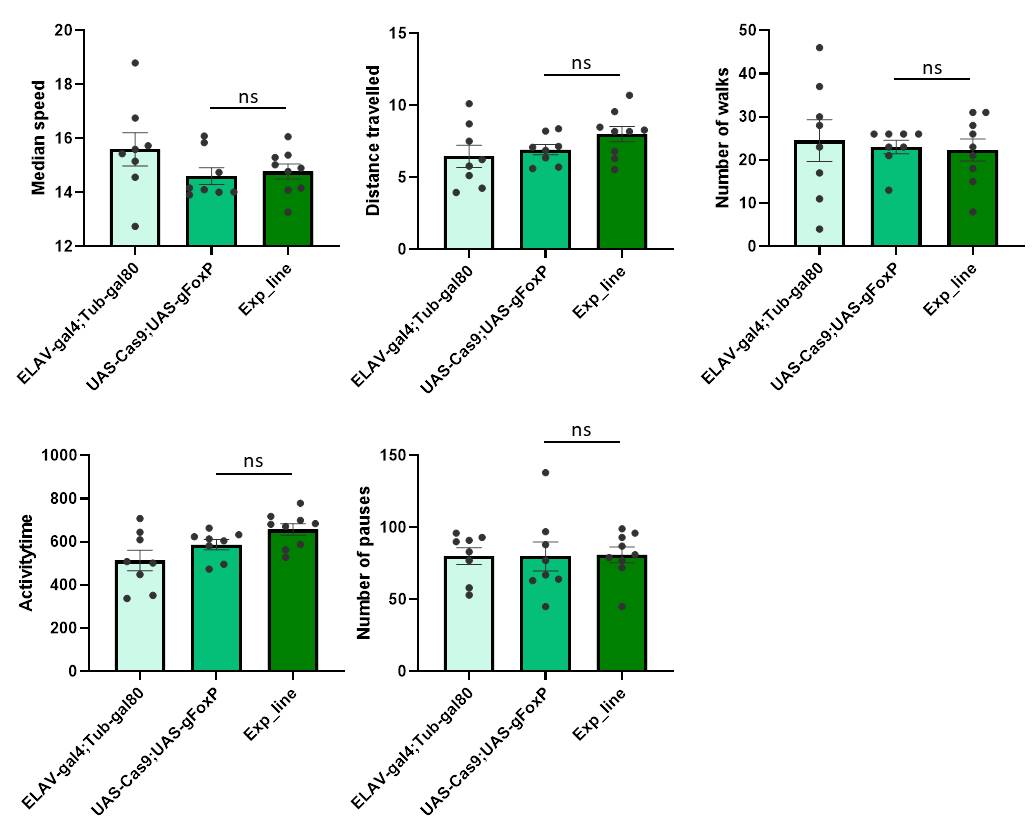
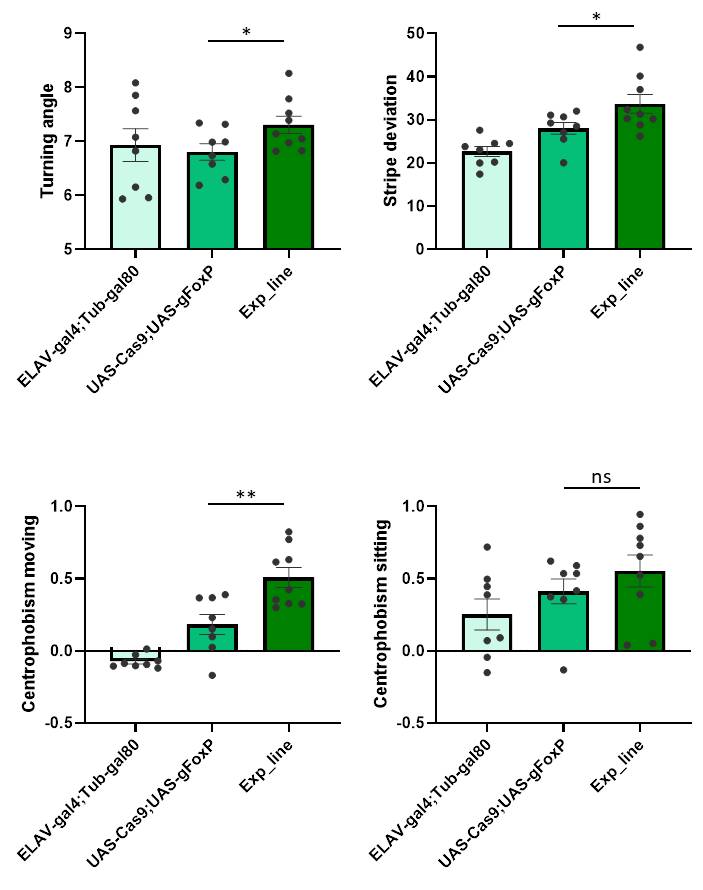
FoxP adult function
on Wednesday, March 27th, 2019 11:38 | by Ottavia Palazzo
Category: buridan, Foxp | No Comments
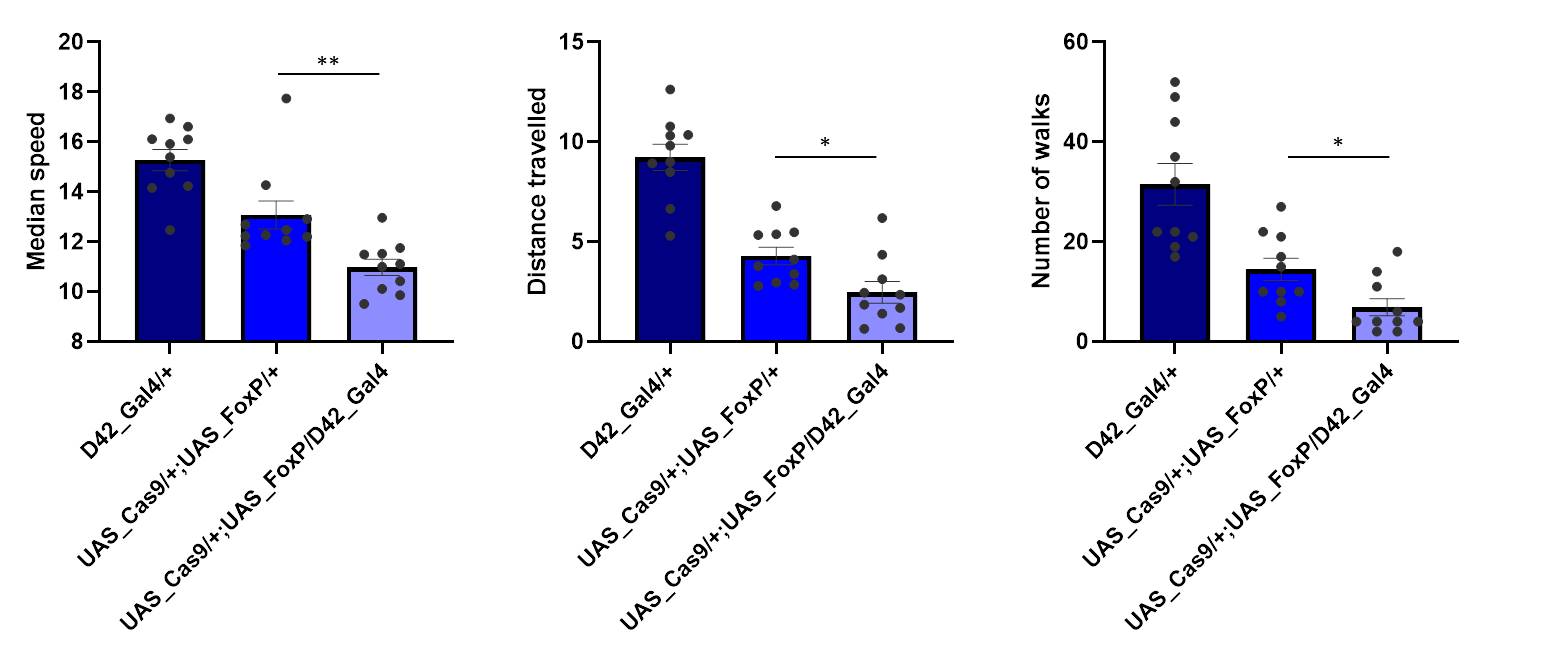
Buridan: UAS_gFoxP x D42_Gal4
on Monday, March 18th, 2019 2:56 | by Ottavia Palazzo
Category: buridan, Foxp | No Comments
Meander and Turning angle
on Thursday, February 14th, 2019 4:58 | by Ottavia Palazzo
Category: buridan, Foxp | No Comments
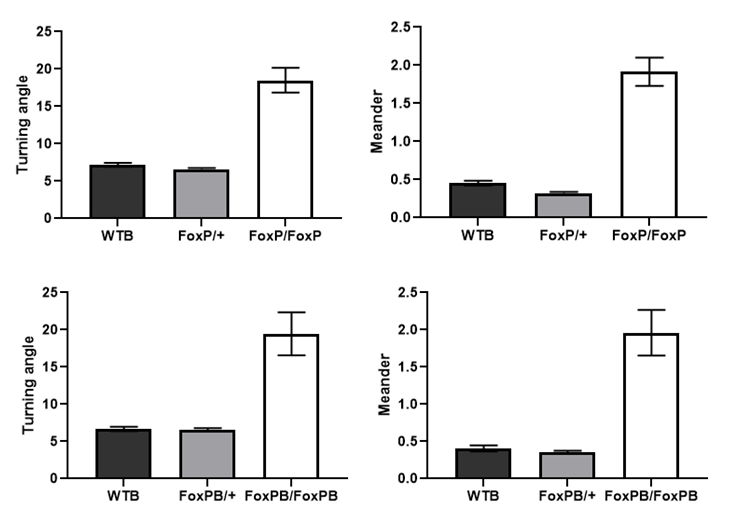
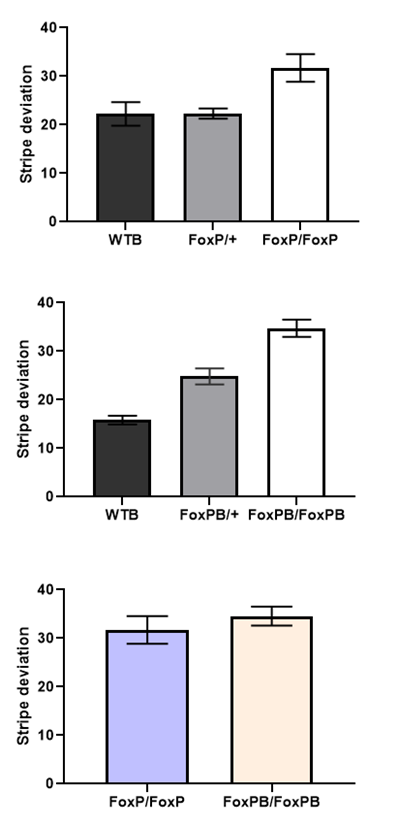
Buridan on FoxP and FoxPB mutant
on Wednesday, February 13th, 2019 10:24 | by Ottavia Palazzo
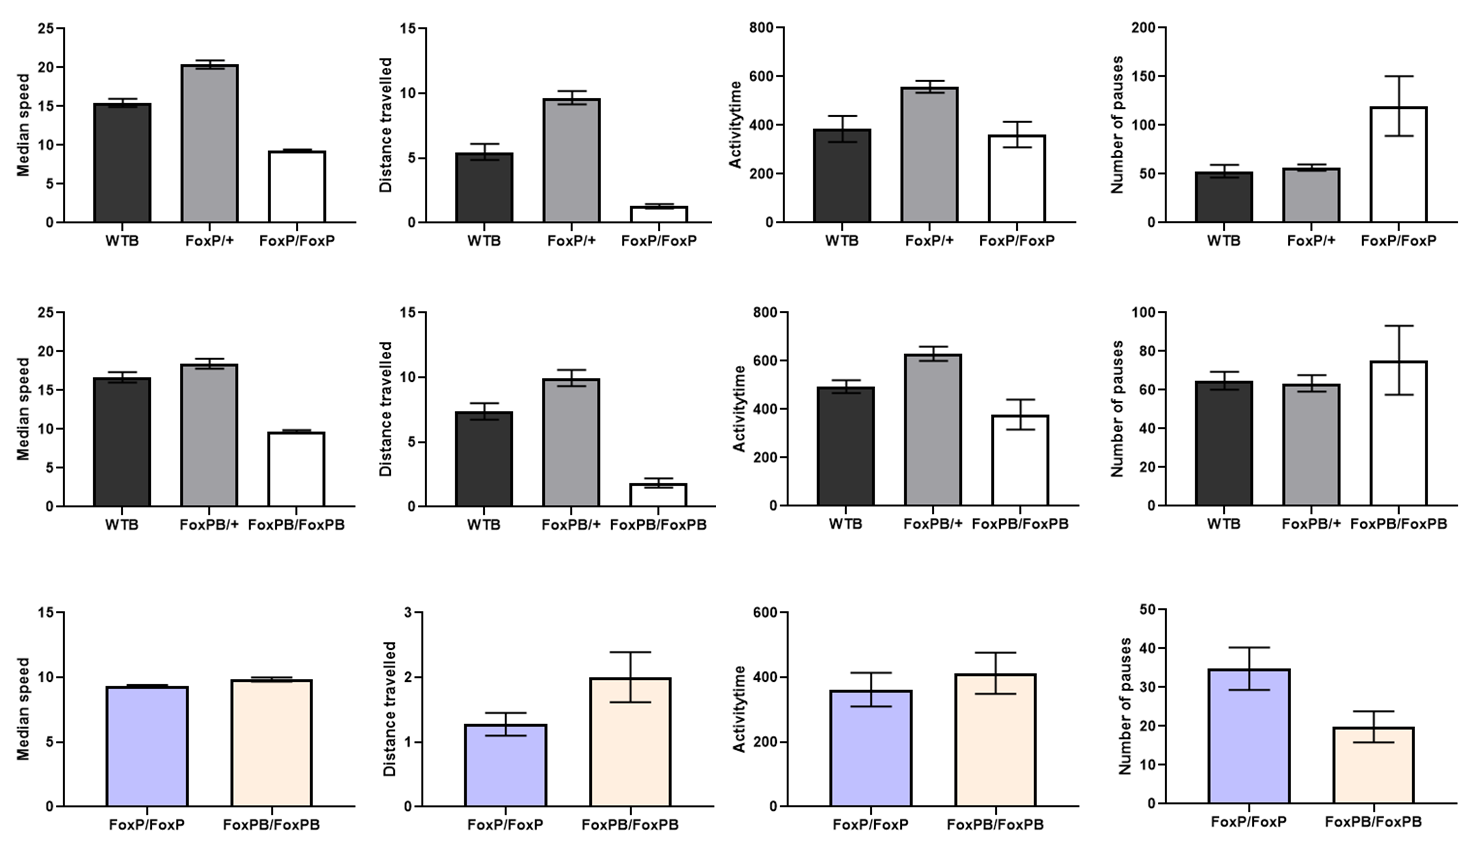
Category: buridan, Foxp | No Comments
Variability of Phototaxis 4: Buridan
on Friday, November 6th, 2015 1:56 | by Isabelle Steymans
Below there are the transitionplots of all the different tubes tested (Fig.1-Fig.6). You can see that the flies of the different subgroups seem to have quite similar Transitionplots.
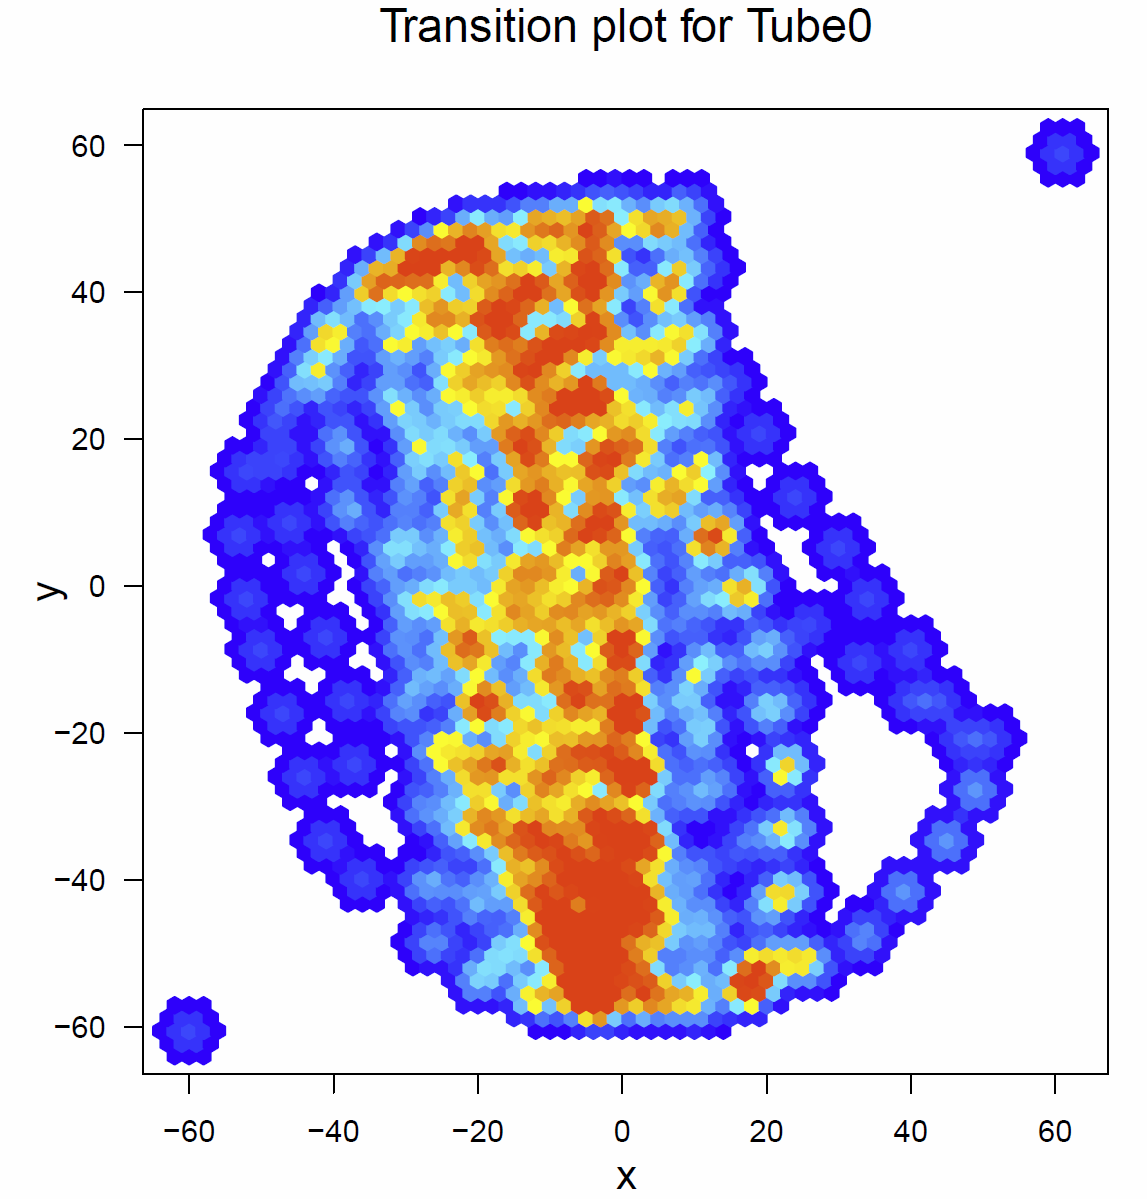
Fig.1 Transitionplot for tube 0
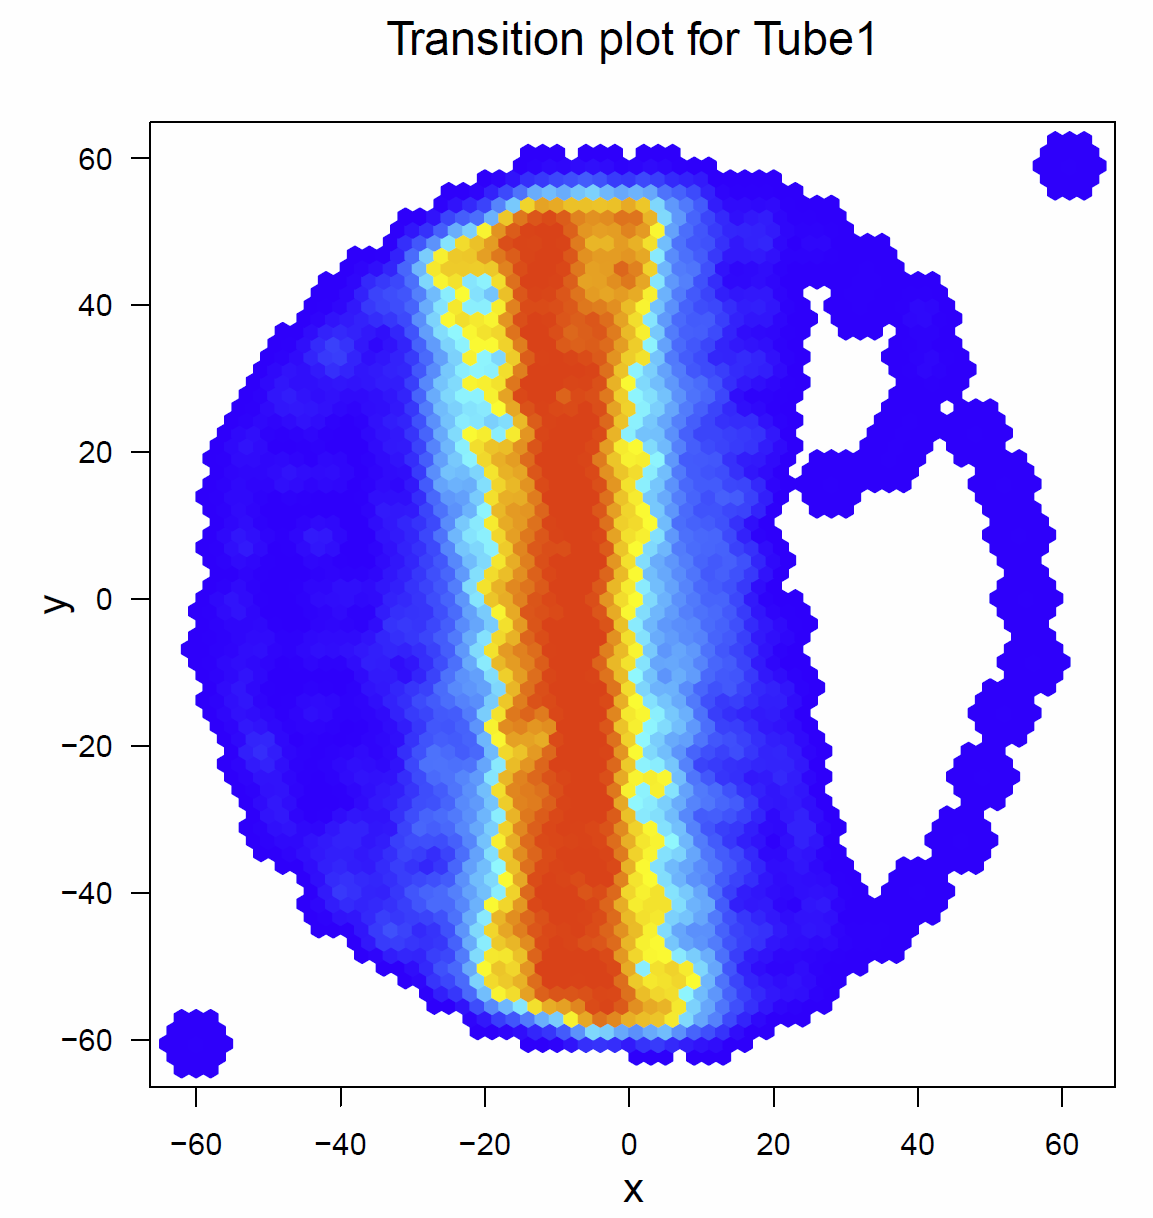
Fig. 2 Transitionplot for tube 1
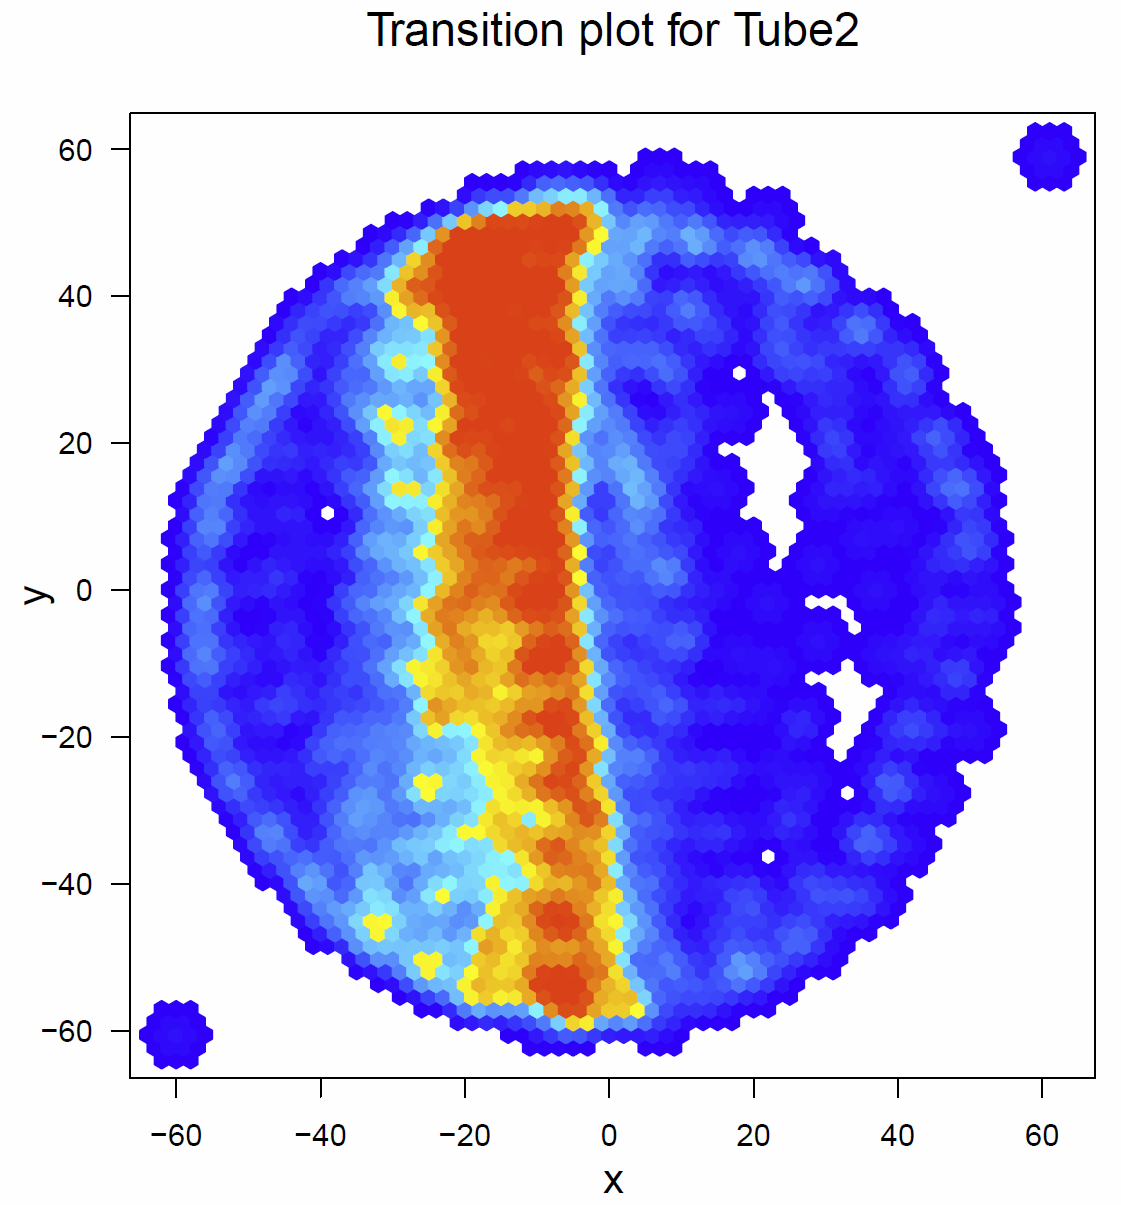
Fig. 3 Transitionplot for tube 2
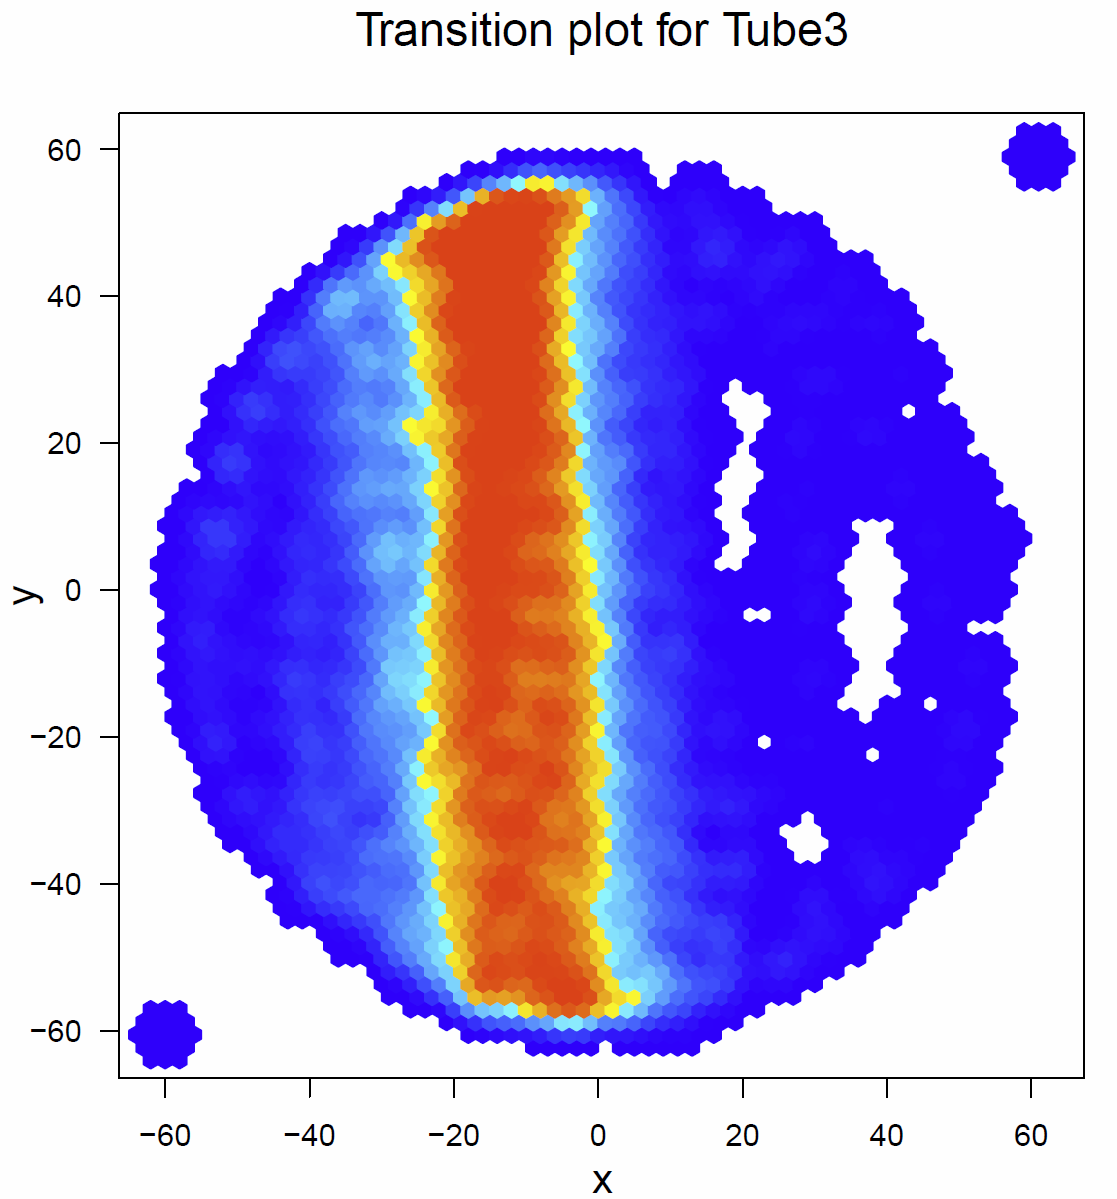
Fig. 4 Transitionplot for tube 3
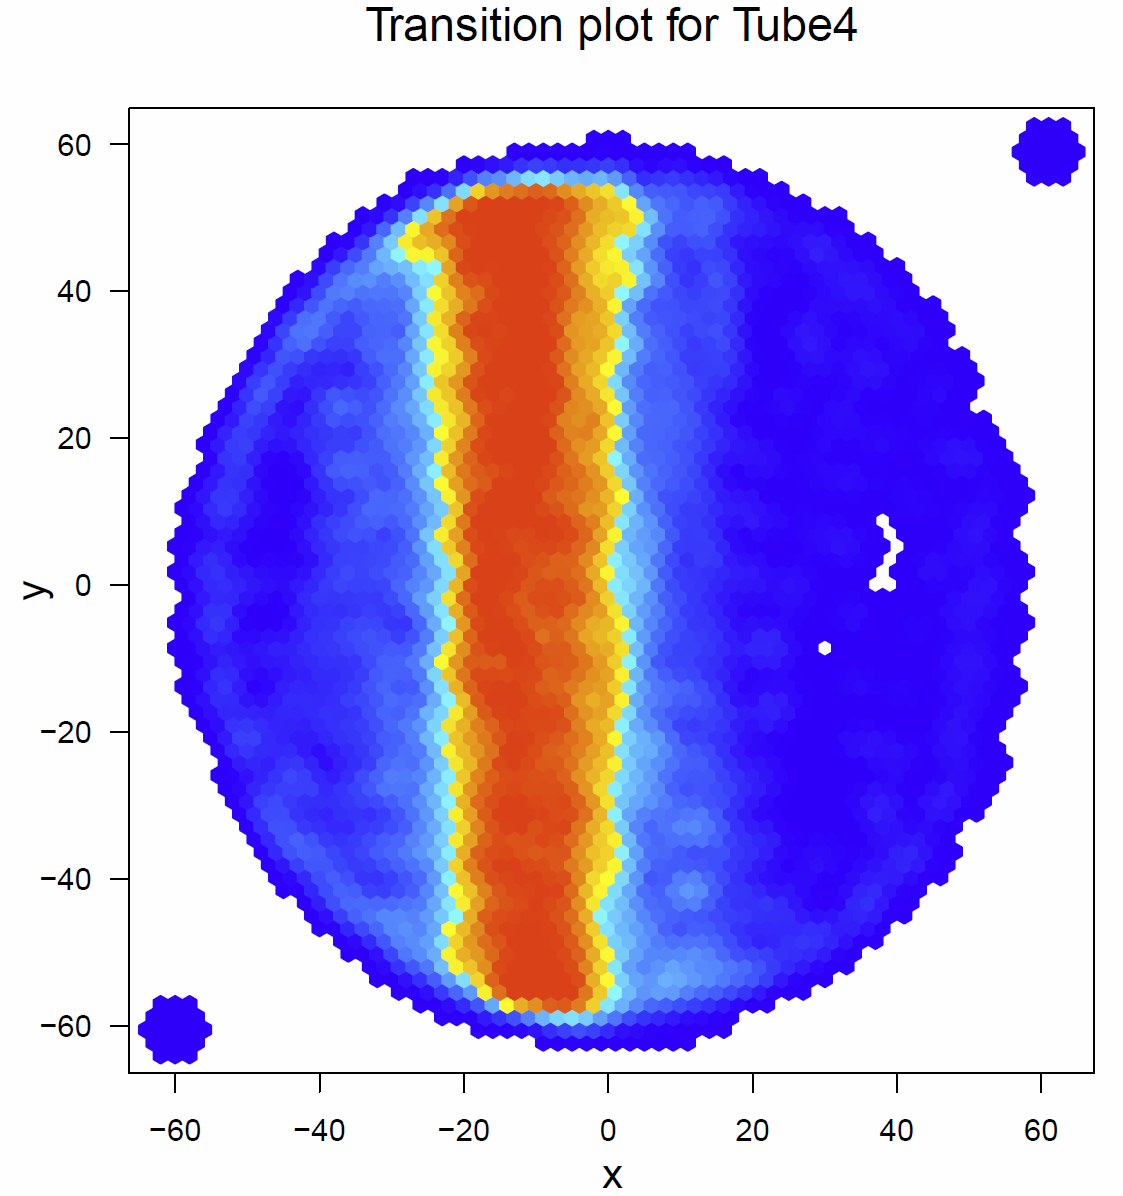
Fig. 5 Transitionplot for tube 4
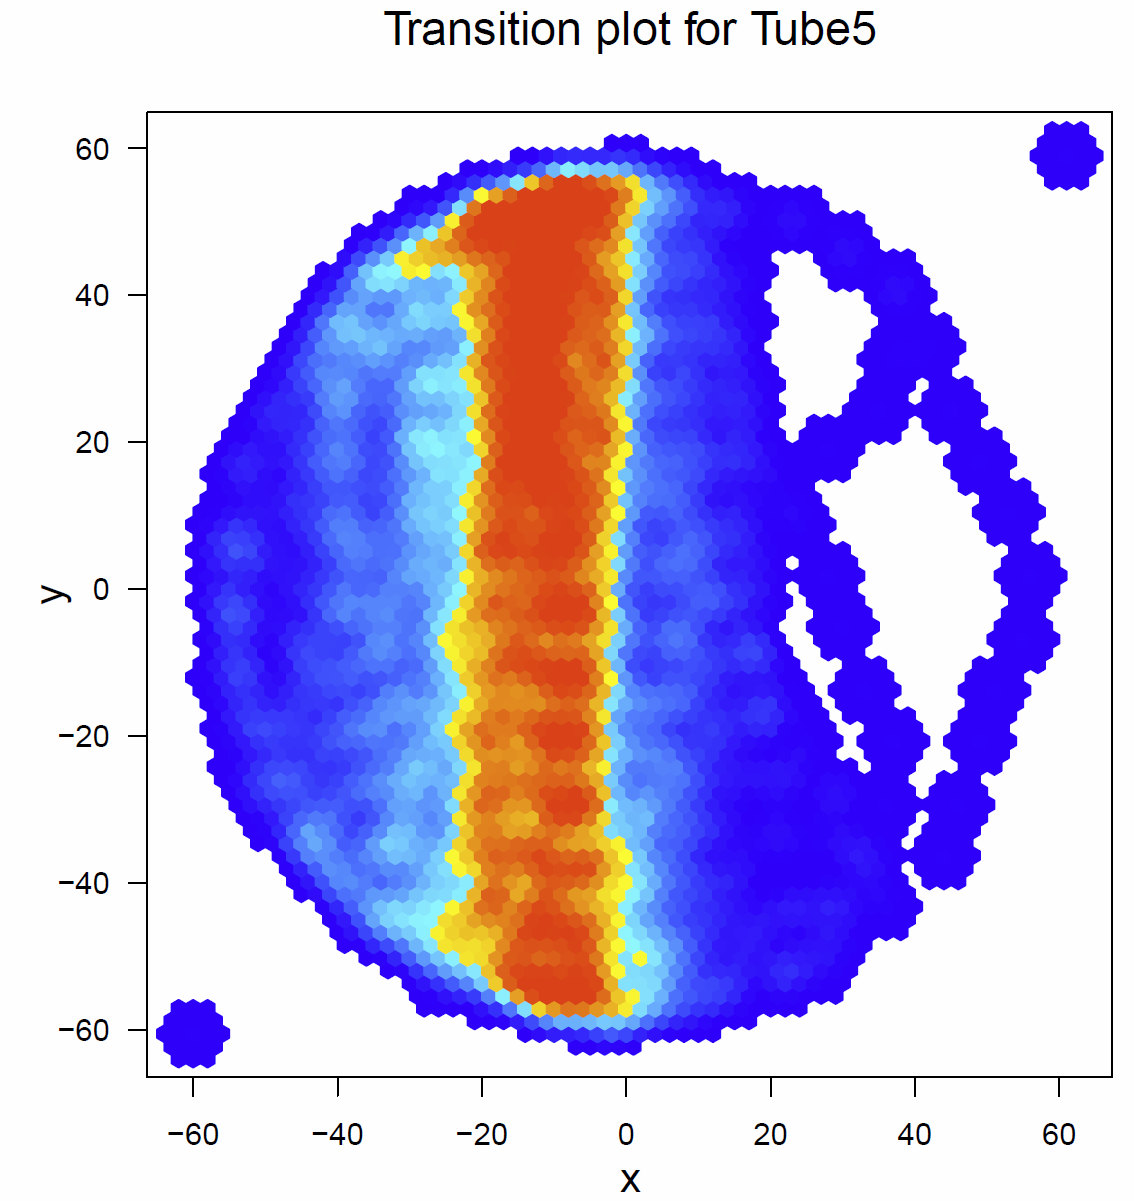
Fig. 6 Transitionplot for tube 5
In addition I had a look on the activitytime per minute (Fig.7+8), the distance traveled per minute (Fig.9), the pause duration and lengh (Fig.10+11), the number of pauses (Fig.12+13) and the median speed (Fig.14). All activity metrics were calculated in two different ways, the first computation (time-threshold: TT) considers every movement as activity and every absence of movement lasting longer than 1 s as a pause. The second approach (speed threshold: ST) uses the distance traveled by the fly in a sliding window of 1 second duration, measuring its mean velocity during that second.
The activitytime of the flies of the tubes 1, 2,3 and 5 is very similar, however in the tubes 0 and 4 it seems to be more elevated. (Fig. 7+8) If we compare these results to the traveled distance (Fig. 9) we see that tubes 4 shows a higher distance as well, tube 0, in this case, is more similar to the tubes 1, 2,3 and 5. For the flies of tube 4 this can be explained by the pause duration and the number of pauses per minute (Fig. 10+12+12) because they show less pauses per minute and a slightly reduced duration of this pauses. In addition we see that the median speed (Fig.14) is lower in the flies of the tube 0, the rest of the tubes are quite similar.
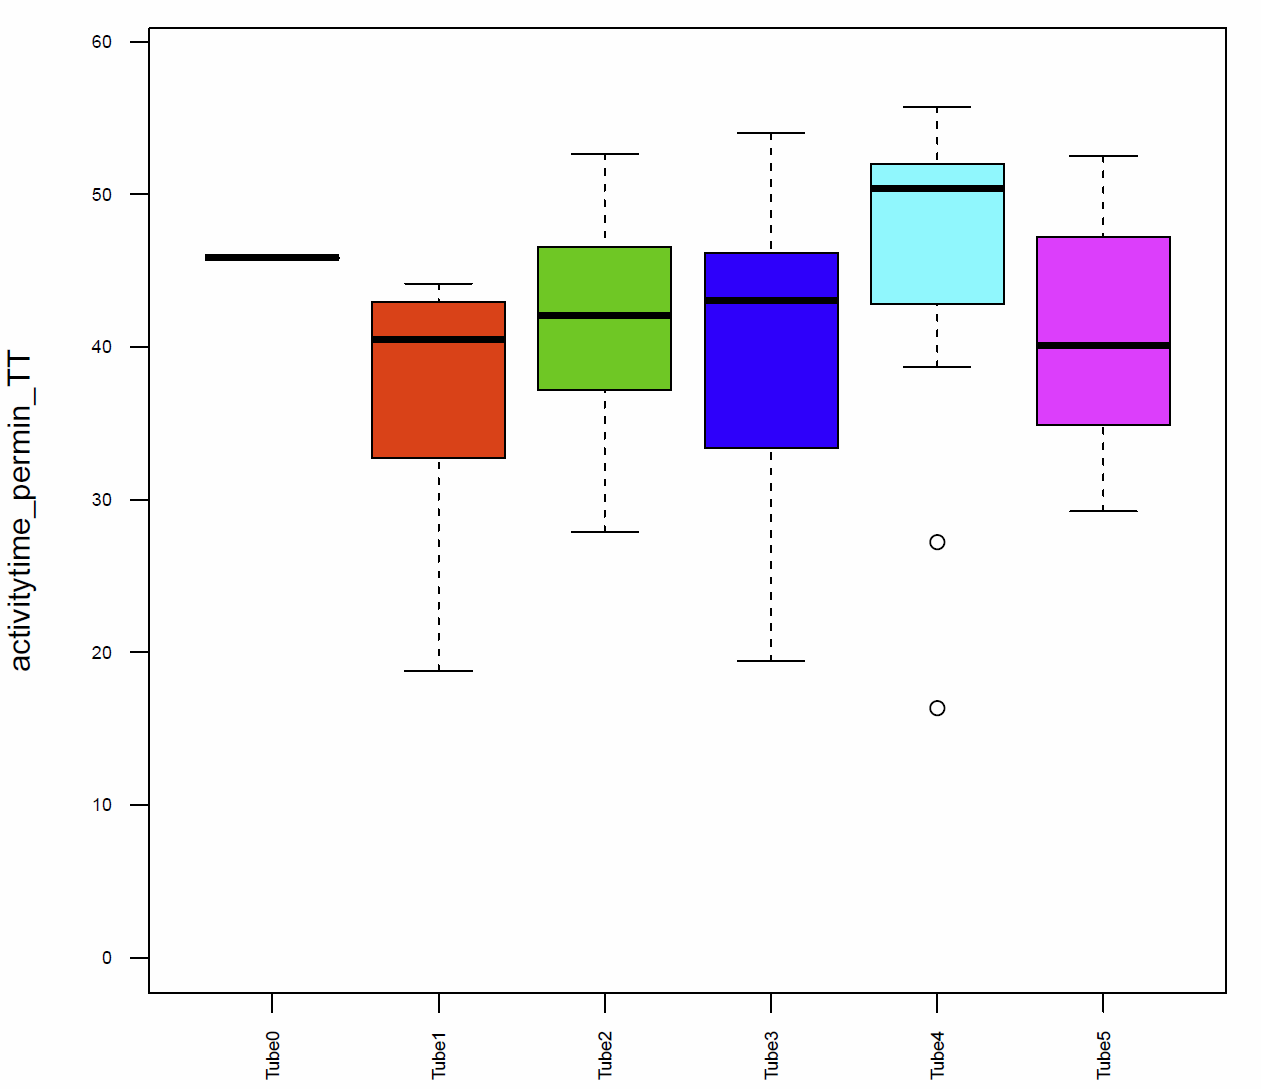
Fig. 7 Activitytime per min TT
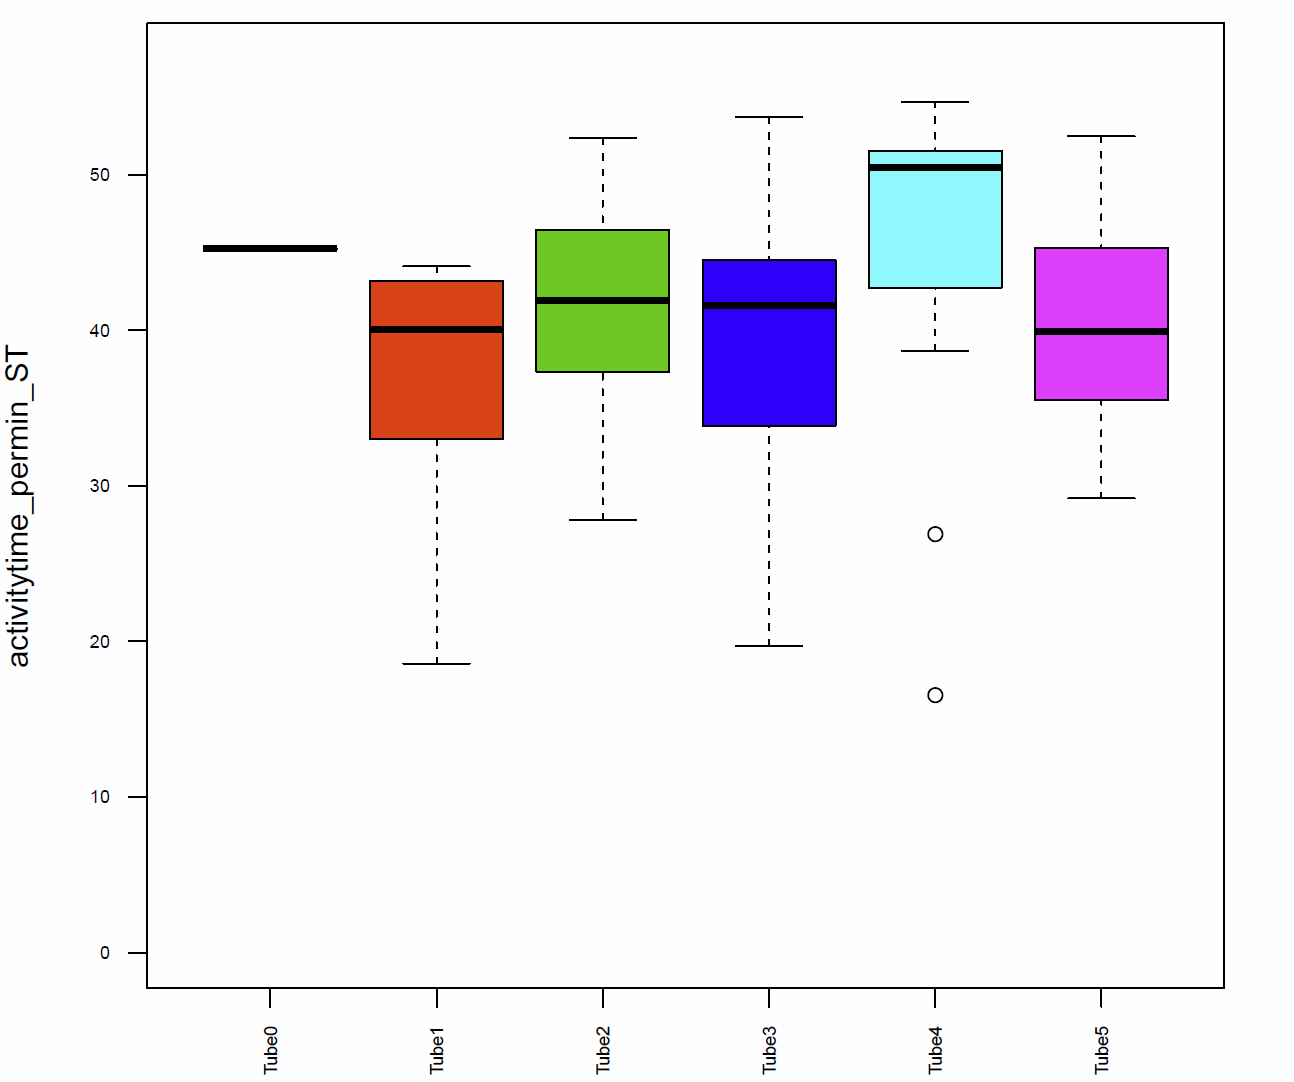
Fig. 8 Activitytime per min ST
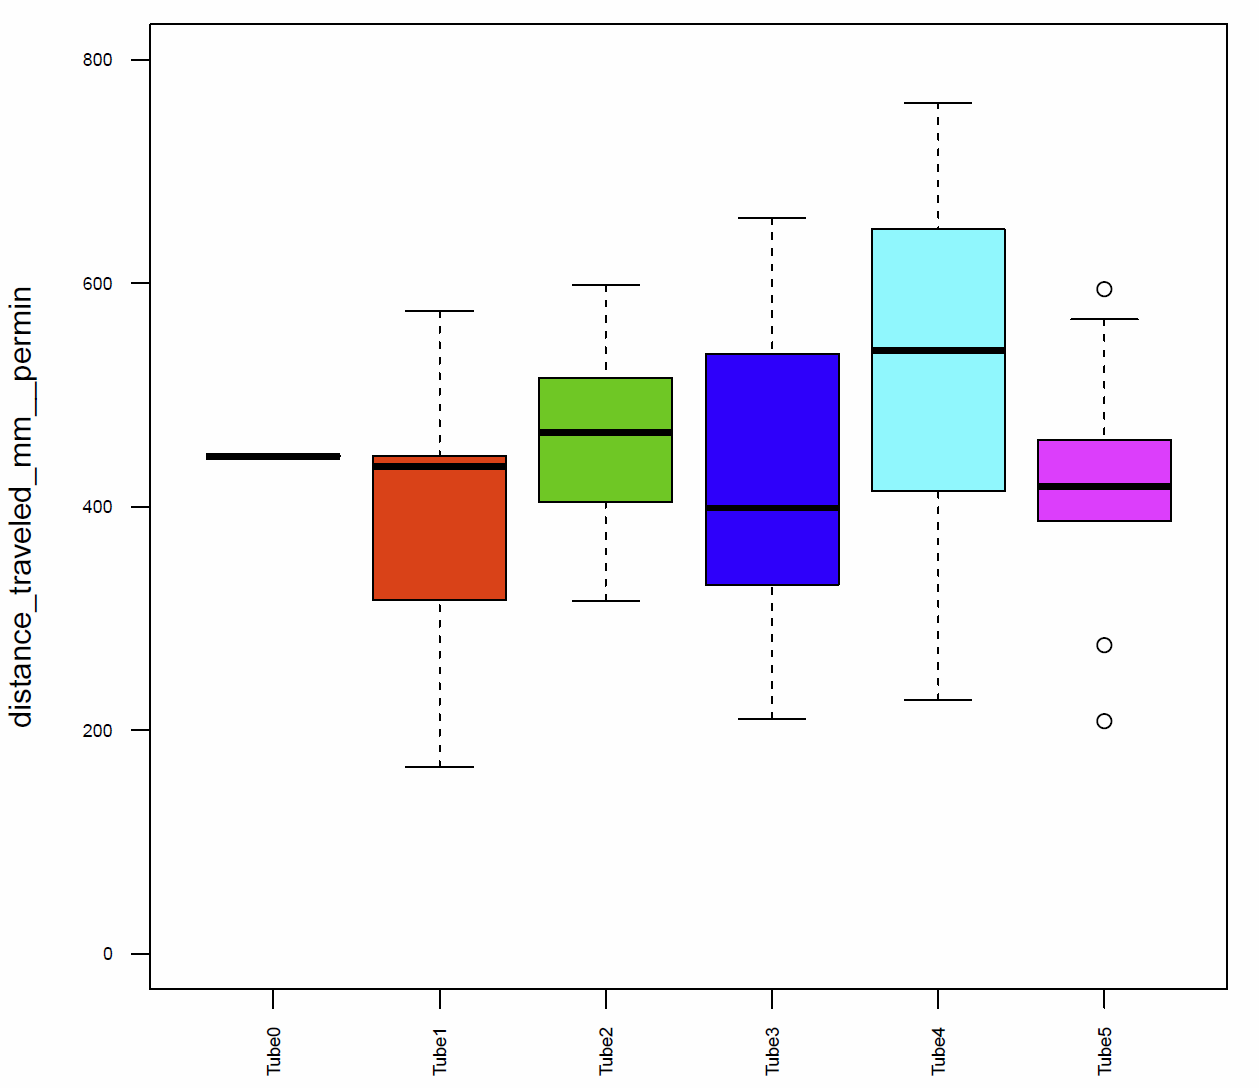
Fig. 9 distance traveled per min
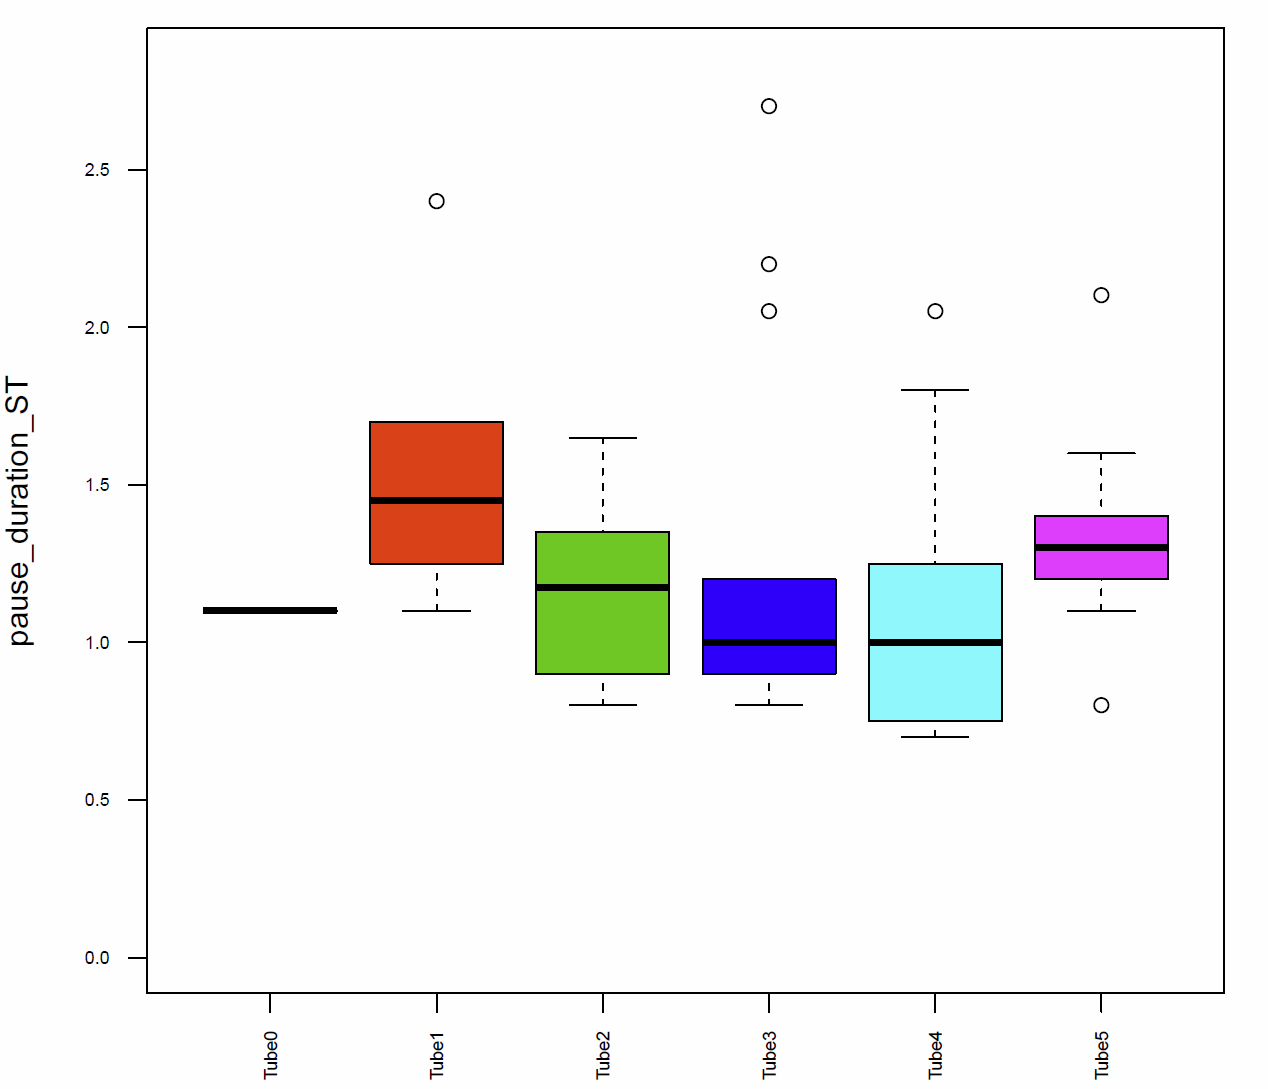
Fig. 10 pause duration ST
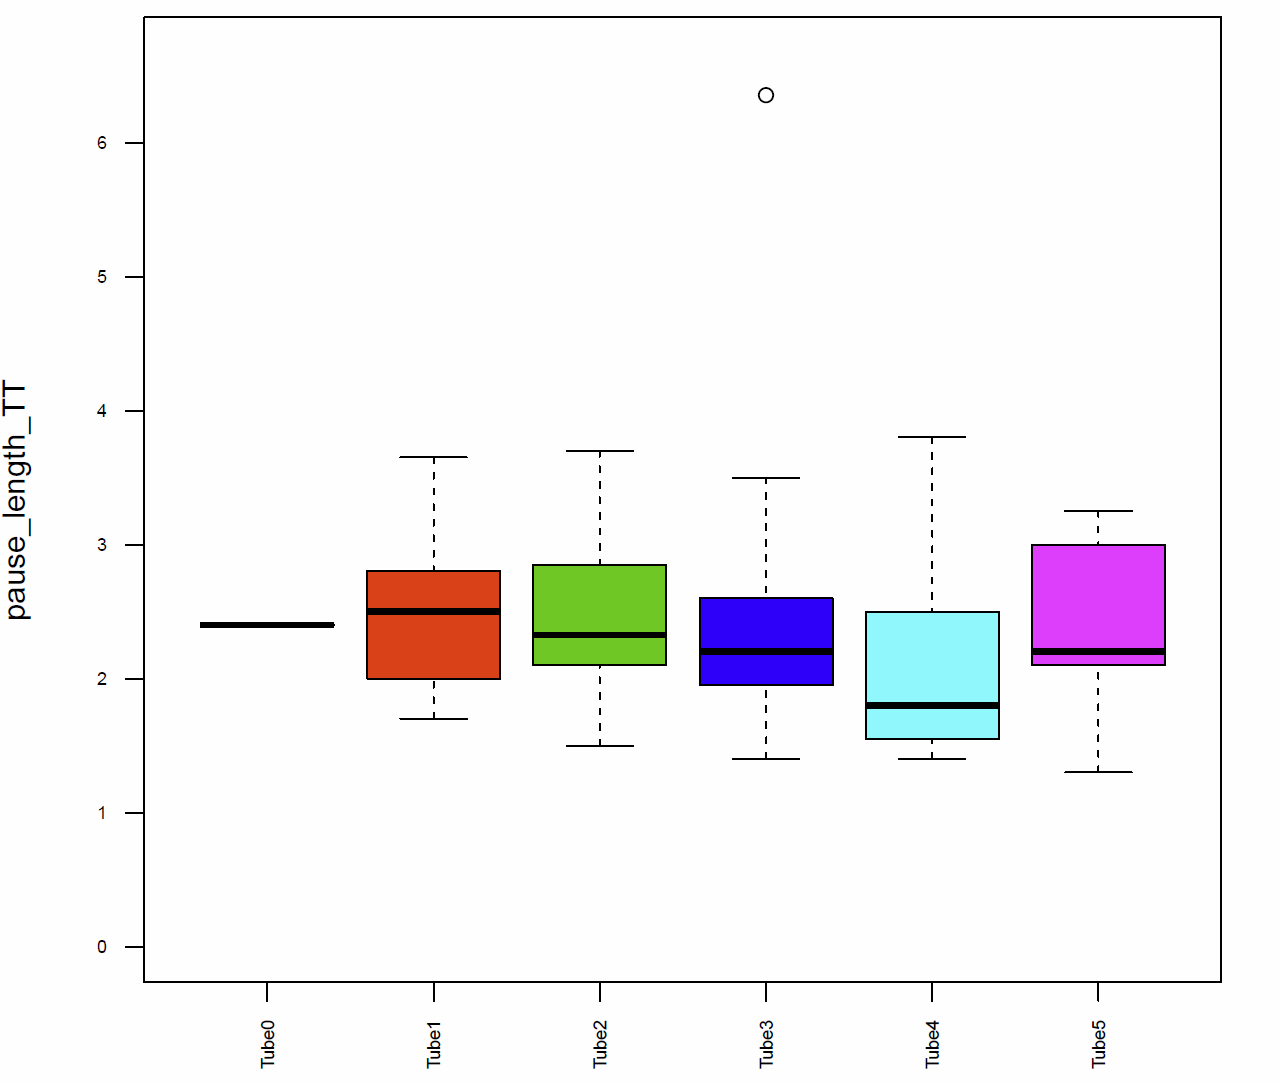
Fig. 11 Pause lengh TT
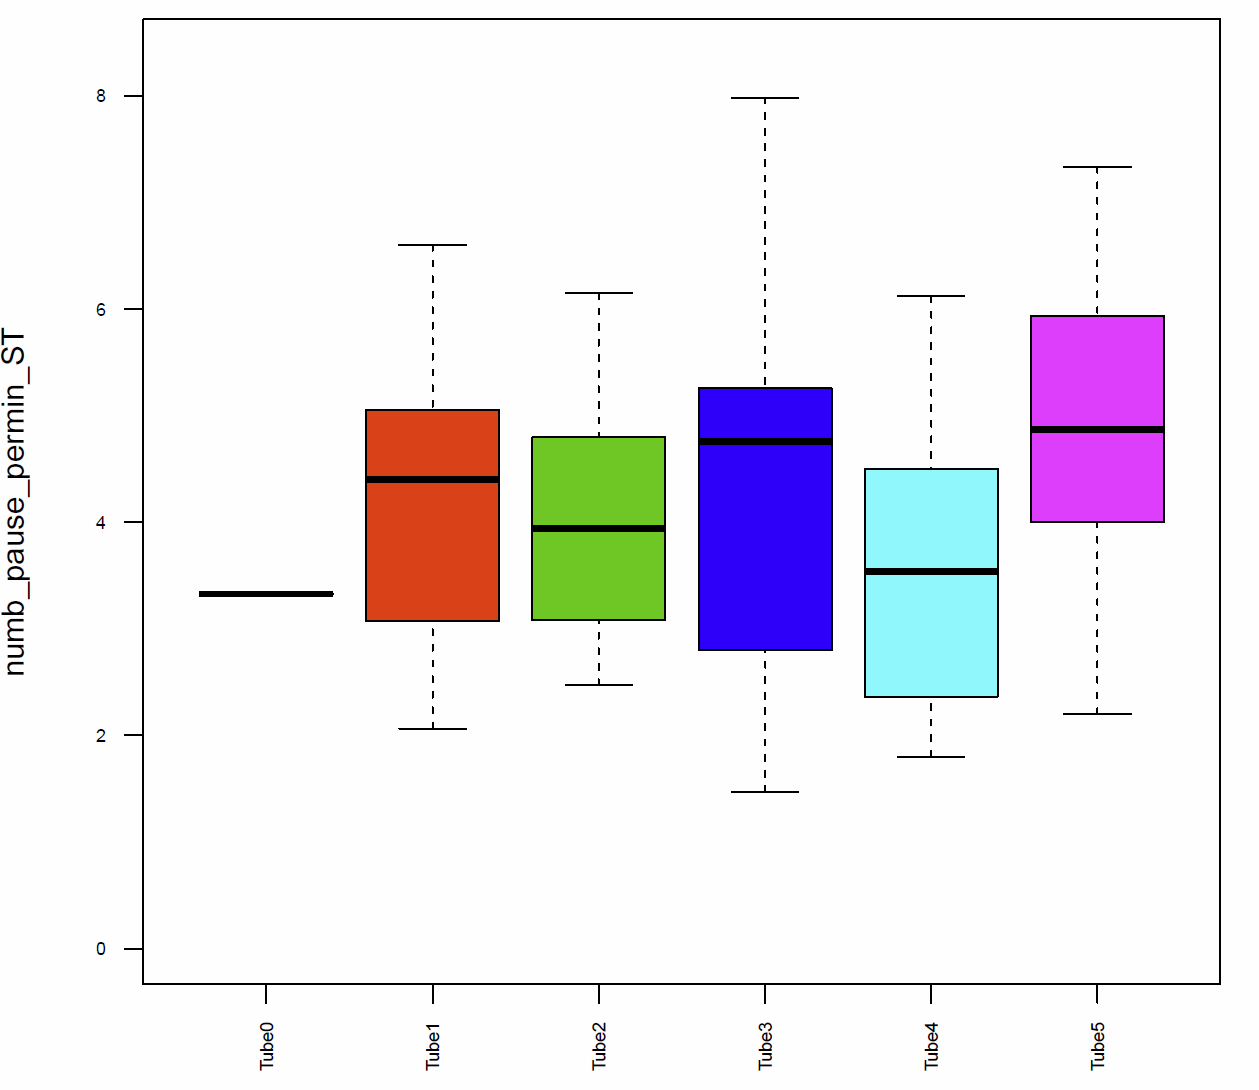
Fig. 12 number of pauses per min ST
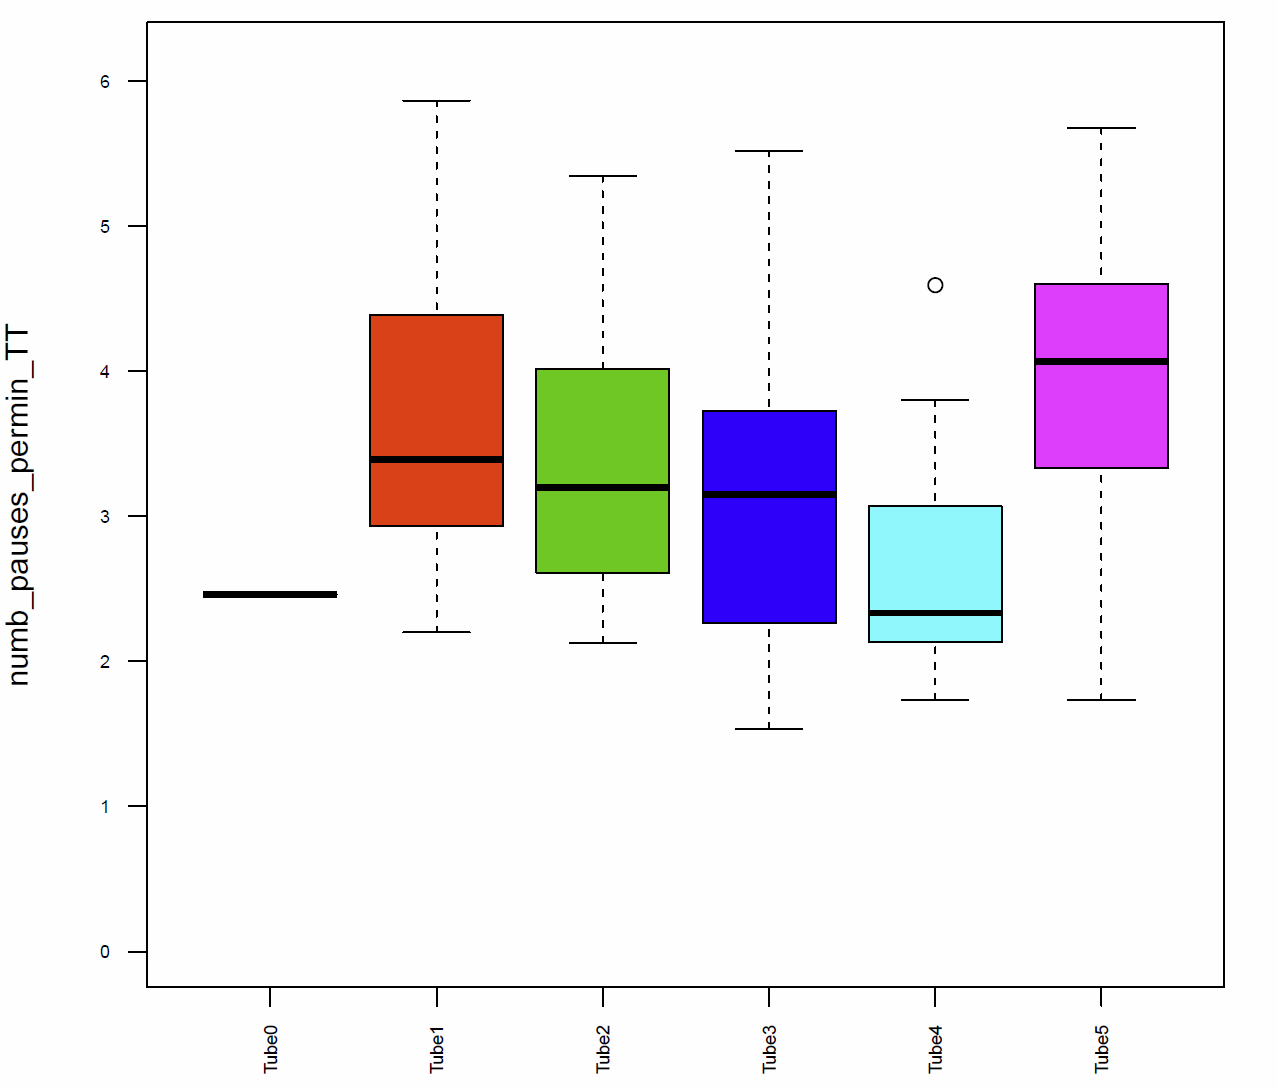
Fig. 13 number of pauses per min TT
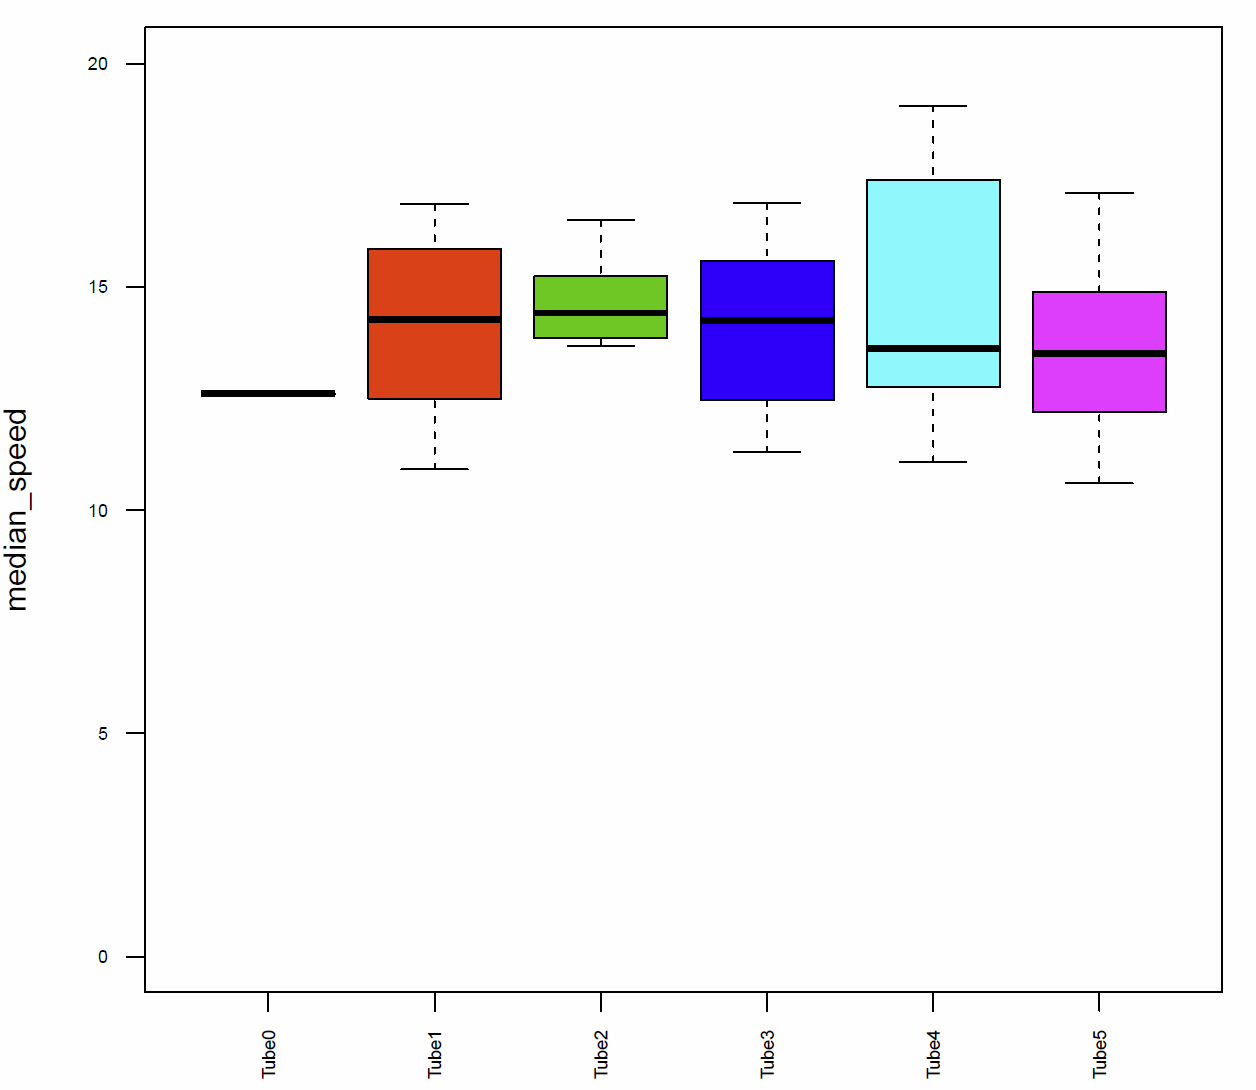
Fig. 14 median speed
A General Buridan Protocol
on Sunday, January 25th, 2015 1:14 | by Yasmine Graf
Category: buridan, lab.brembs.net, open science, wing clipping | No Comments
Trajectory data: database structure
on Thursday, December 20th, 2012 5:16 | by Julien Colomb
– Buridan’s experiment done with a different tracker
– Walking honeybee tracking in a rectangular arena, with a rewarded target
– Animal (flies/bees) walking on a ball, using open- or closed-loop experiment setup
– trajectory data obtained from the pysolo software (flies)
– larval crawling data
I want to include an automatic depository of the data in a database. Automatic entries in Figshare is for instance possible. (see older posts). My problem is to find a way to treat the data such that:
1. the raw data is uploaded
2. all data is uploaded also if we use only the centroid displacement (in some data file the head position is also given)
3. the data can be reused and data obtained in different lab, animal, setup can be compared. (data should be organized such that it can be searched and queried).
4. probably other elements that I do not think of….
My main problem: I have nearly no experience in data management/design, ontology or semantic web. Here is a first draft of a database structure that I have thought of. Every feedback would be welcome:

Category: buridan, open science, Pysolo, Spontaneous Behavior | 1 Comment
GRIP on inter event intervals from Buridan
on Monday, December 10th, 2012 3:52 | by Sathish K Raja
GRIP on Inter event intervals of Buridan output data ,,, time threshold method,
Inter activity interval

Inter pause interval

Category: buridan | 2 Comments
GRIP analysis on Buridan activity data(TT)
on Thursday, December 6th, 2012 11:29 | by Sathish K Raja
Basically I am extracting inter event intervals and had it run by GRIP to see the level of randomness.GRIP is based on decimal extension of pi.
Category: buridan | No Comments