Data analysis of the prediction of wingstroke amplitude with 40 datapoints.
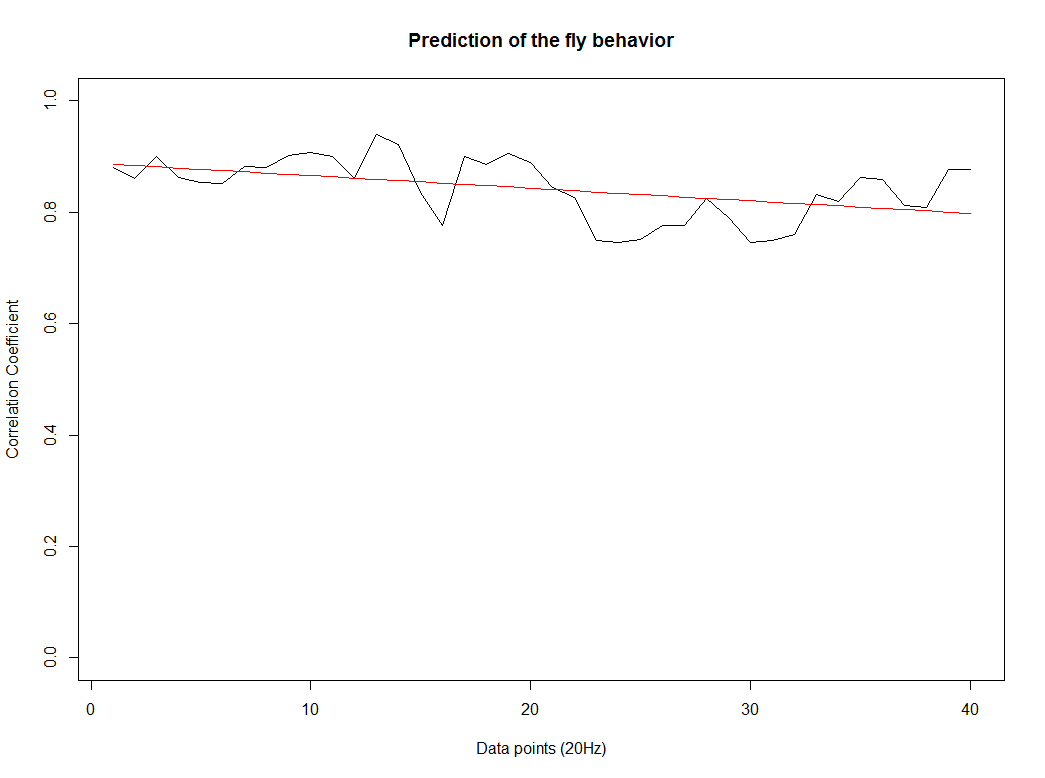
After we got the data of the behavior of the fly with strokelitude, we have made the analysis of 40 datapoints. Those datapoints were randomly picked in the middle of our dataset (10 minutes) and we made a second prediction, taking the points just before the end of the flight. For that we made a double correlation with those two predictions for each line and those are the results:
For the two control lines,
WTB x C105;;C232
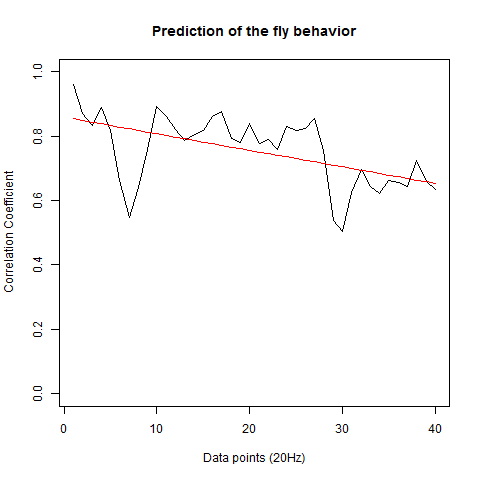
UAS-TNT-E x WTB
And for the experimental line (UAS-TNT-E x C105;;C232)
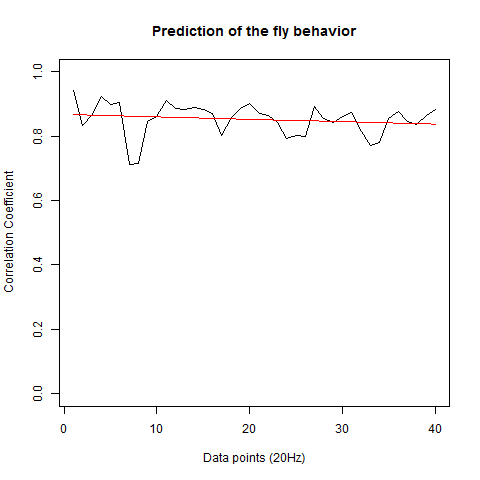
As long as the linear regresion decreases, more impredictable is the fly so its behave like non-linear function. The two controls are suposed to be more impredictable than the control line. There is more decrease in those two lines comparing to the experimental line, although is not too remarkable.
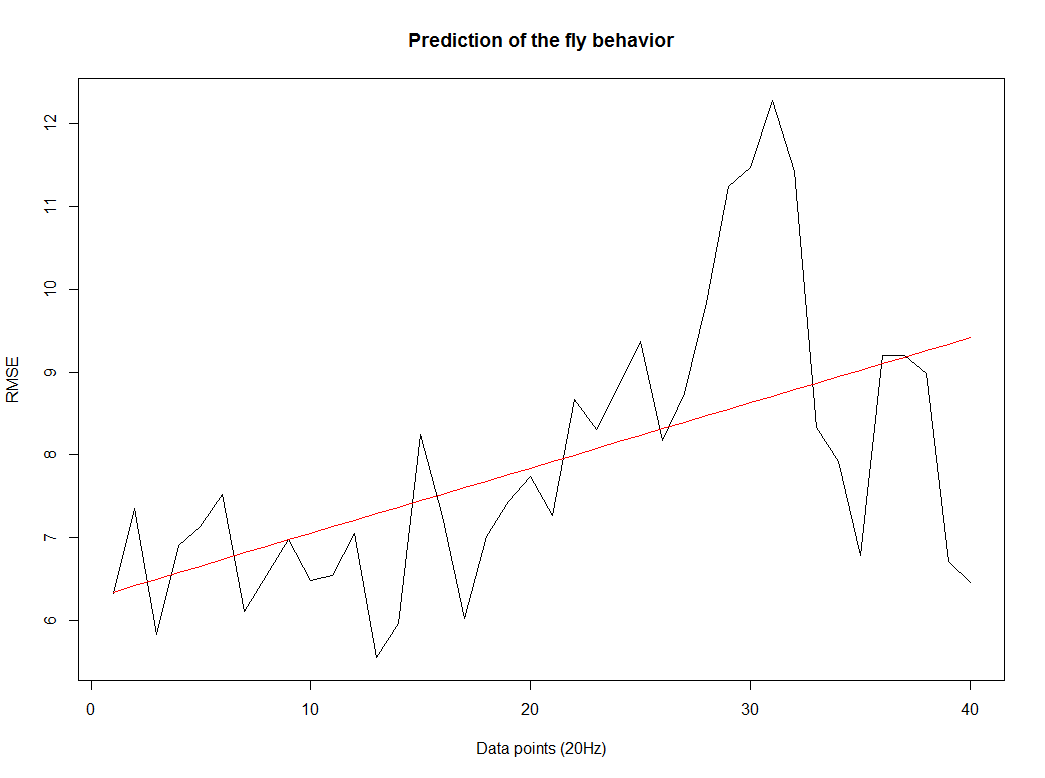
We also made an RMSE analysis, Christian explained it in his post. “RMSE measures just the differences of the absolute points whereas correlation coefficient is rather if the direction and degree of variation correlates (covariates)”
Here we have the plots:
WTB x C105;;C232(control)
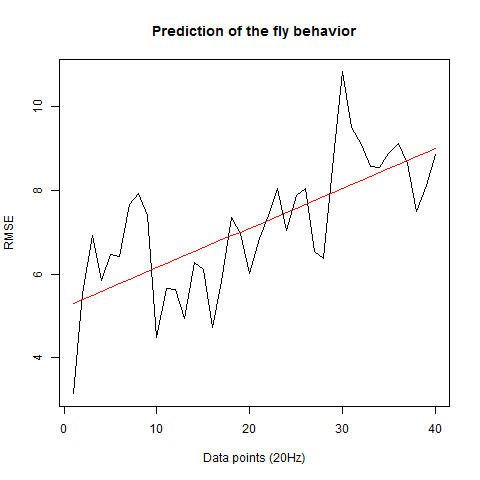
UAS-TNT-E x WTB(control)
experimental line (UAS-TNT-E x C105;;C232)
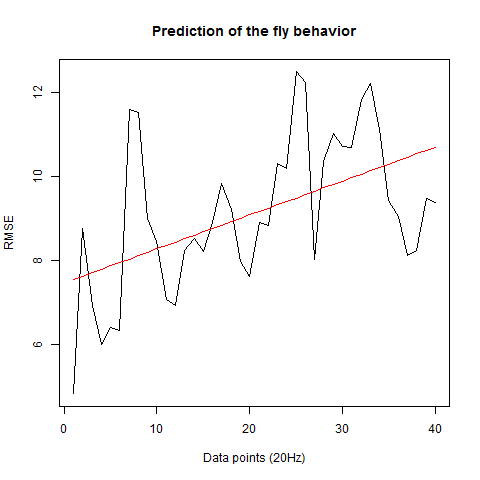
As long as the linear regresion increases, the absolute points differ from the prediction and the normal trace.
Measuring Wingstroke Amplitude with Strokelitude (V)
For a further data analysis, we should have a minimum number of samples. During the last week, I have been measuring the wingstroke amplitude of the flies, to get at least 10 samples of each one(two controls and the experimental line). Here three examples of the different lines:
Males WTB x C105;;C232 (control)
Males UAS-TNT-E x C105;;C232
Males UAS-TNT-E x WTB (control)
Measuring Wingstroke Amplitude with Strokelitude (IV)
After getting good results in the measurement of the wingstroke, and solving problems with the sampling intervals (image below). I have started to measure flies for the experiments.
The time between samples was different depending on the background programs running on the background:
Figure 1
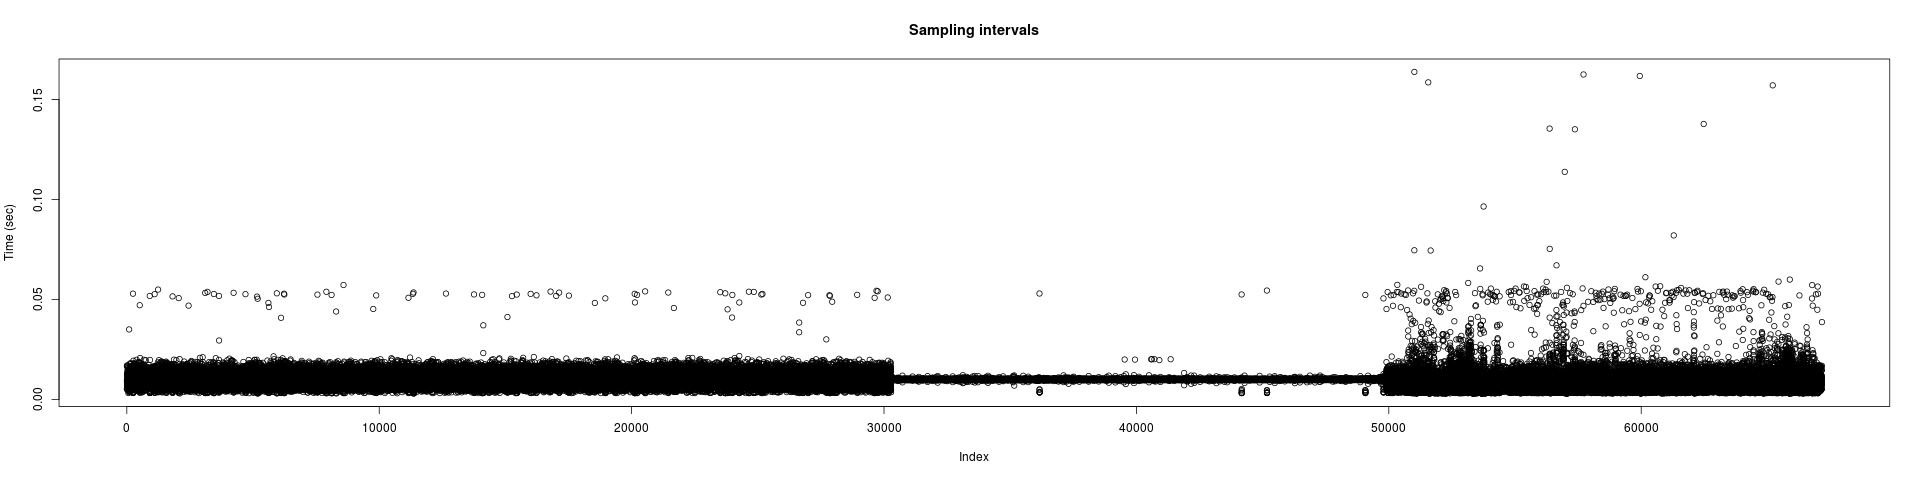
More differences in time within samples when more programs are running at the same time as strokelitude (3nd 1/3 of the plot), when just the display of the camera is running( 1st 1/3 of the plot), and everything shut down(2nd 1/3 of the plot).
The differences among sampling intervals was bigger but with an adjustment of the data, Christian Rohrsen managed to changed. The time between two samples could arise until 1.7 seconds and with the correlation, the time is not bigger than 0.05 seconds.
The strains of flies used fore the experiments are:
UAS-TNT-E, that express the tetanus toxin in the neural cells, using GAL4 system. Being Used as a control.
c105;;c232, that contains a promotor region to express the toxin. Being used as a control.
And the cross between both to have the expression of the tetanus toxin.
Some data from the control flies (UAS-TNT-E):
And some data of the spikes:
Measuring Wingstroke Amplitude with Strokelitude (III)
After the measurements of this week, I get better results in the trace of the fly;
(1)
With the corresponding trace exerpt with the spikes of the figure above (1)
(1)
and two more from other flies:
Measuring Wingstroke Amplitude with Strokelitude (II)
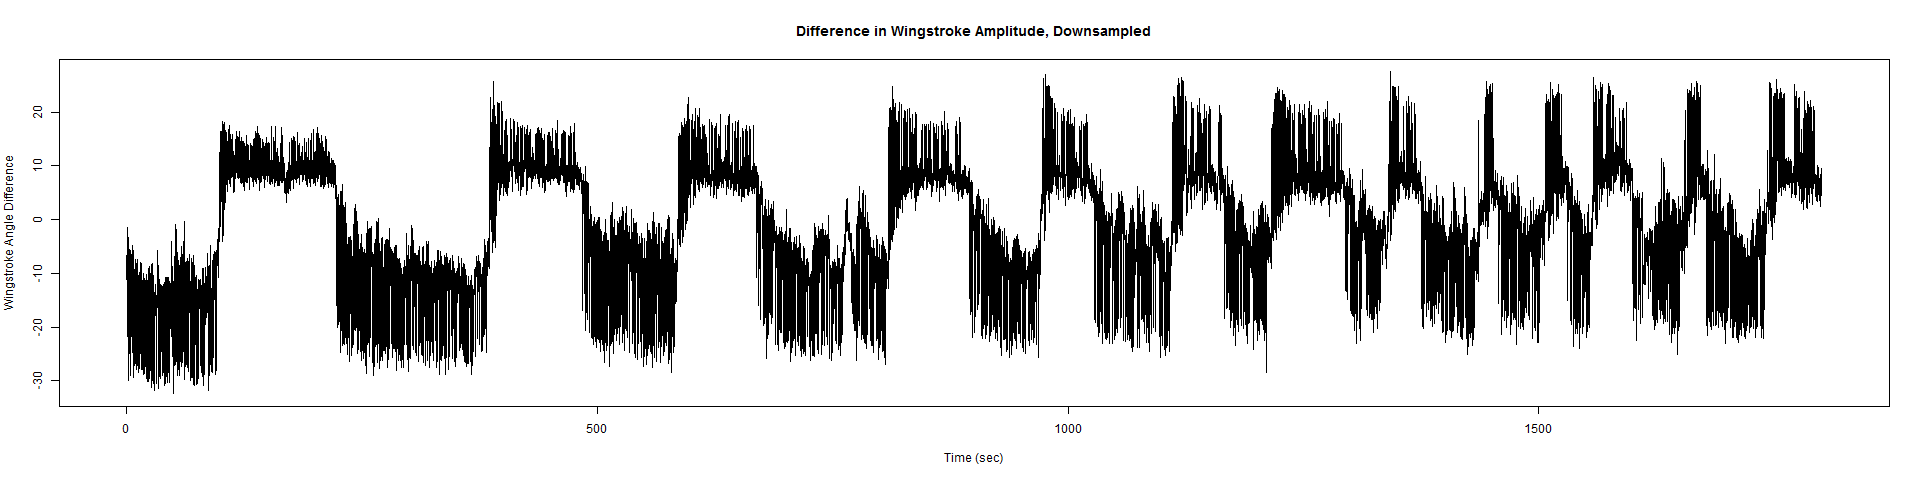
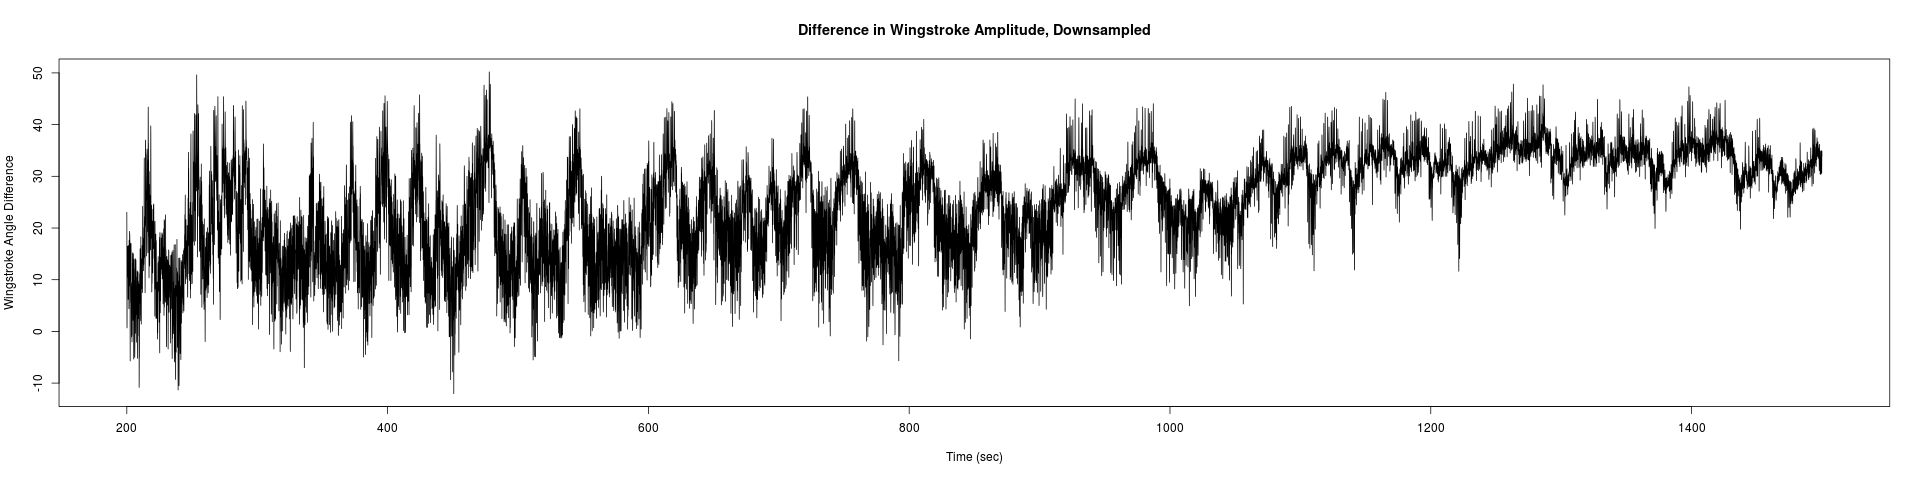
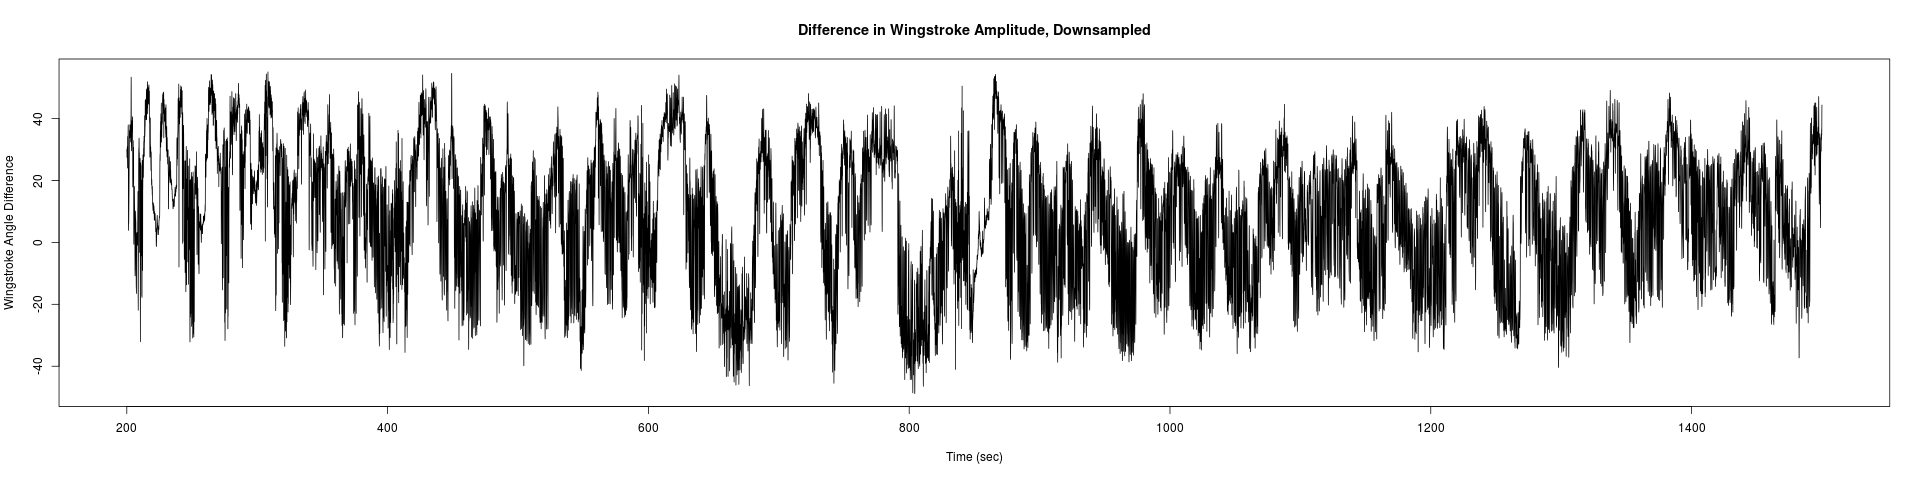
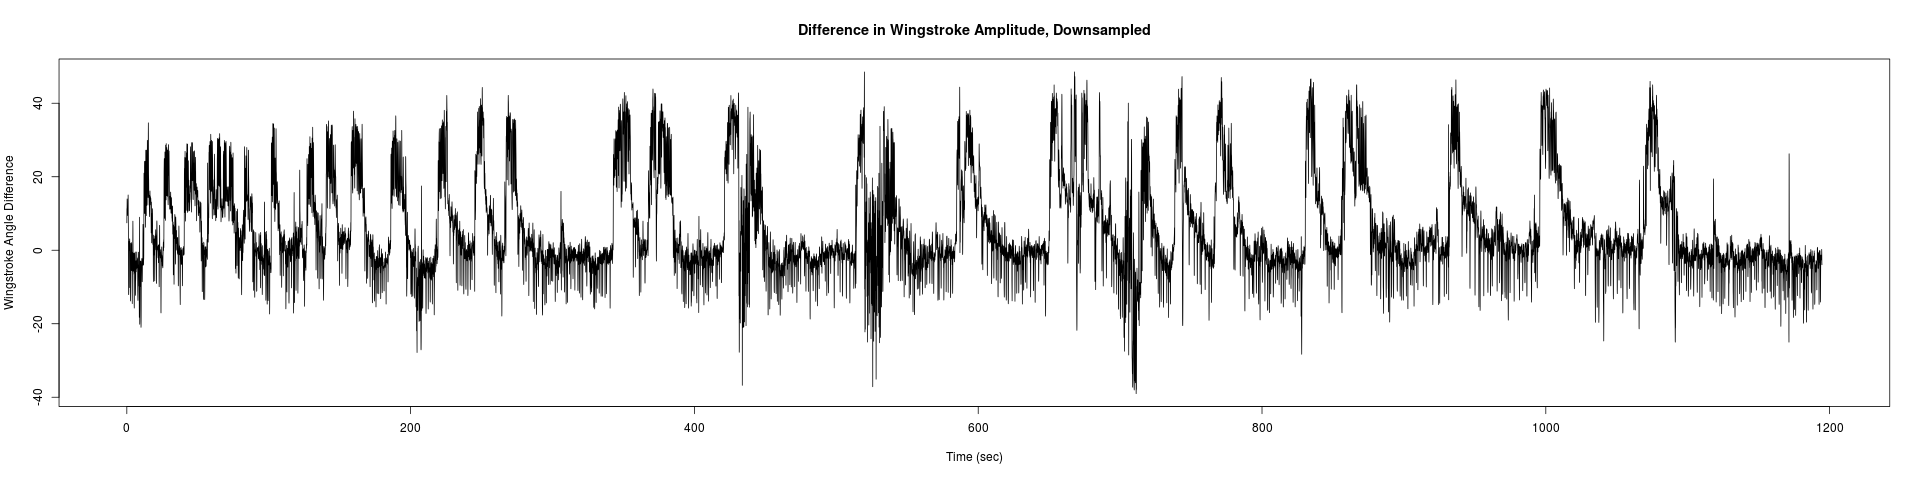
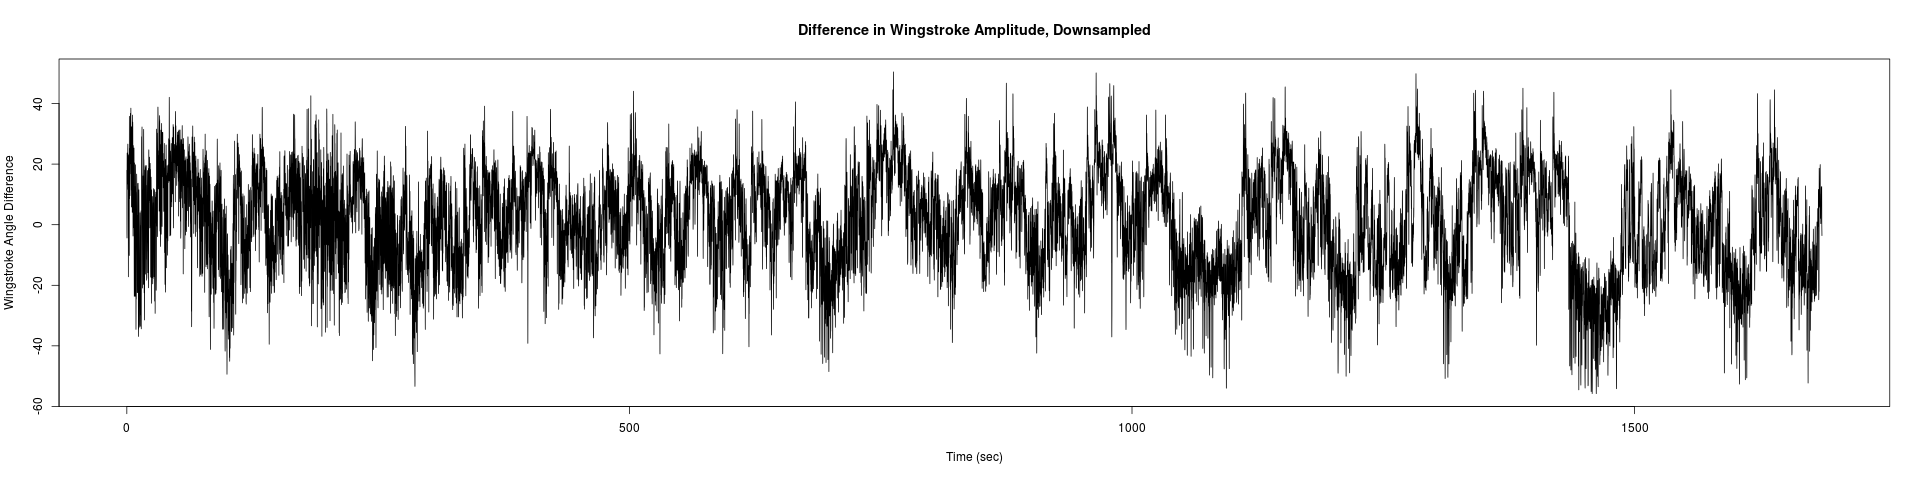
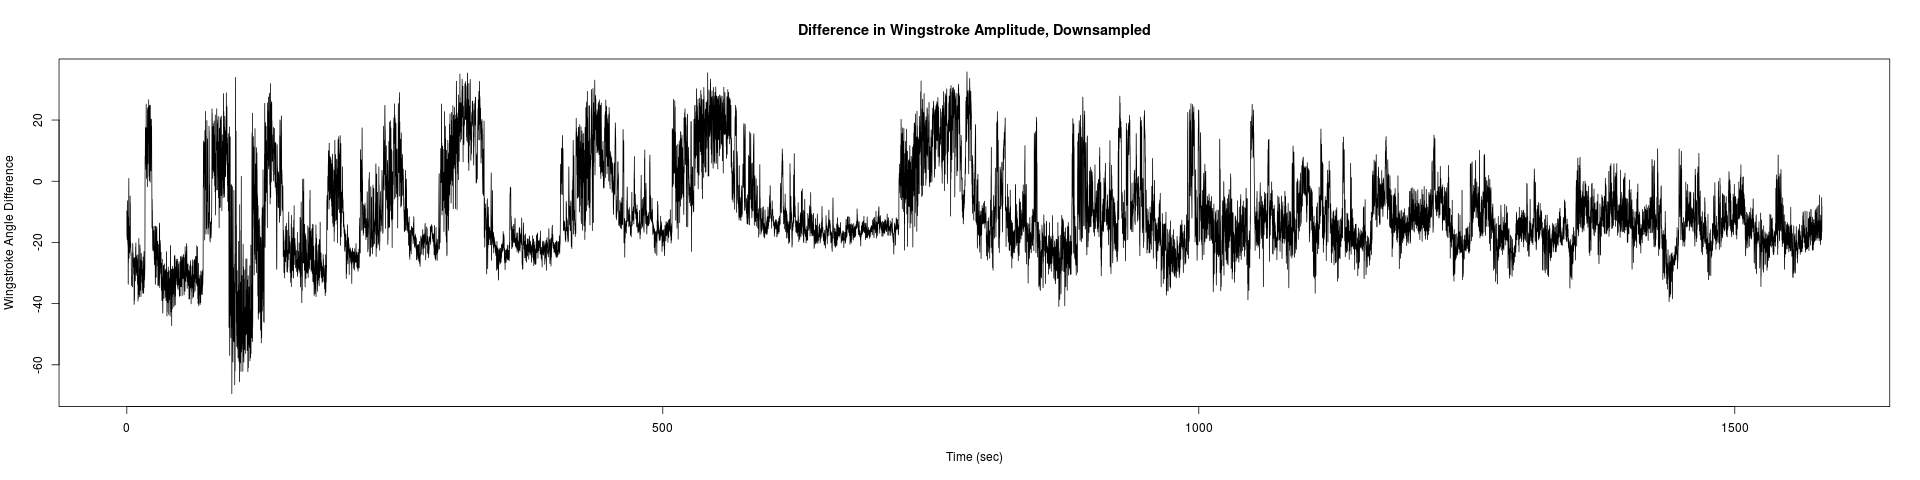
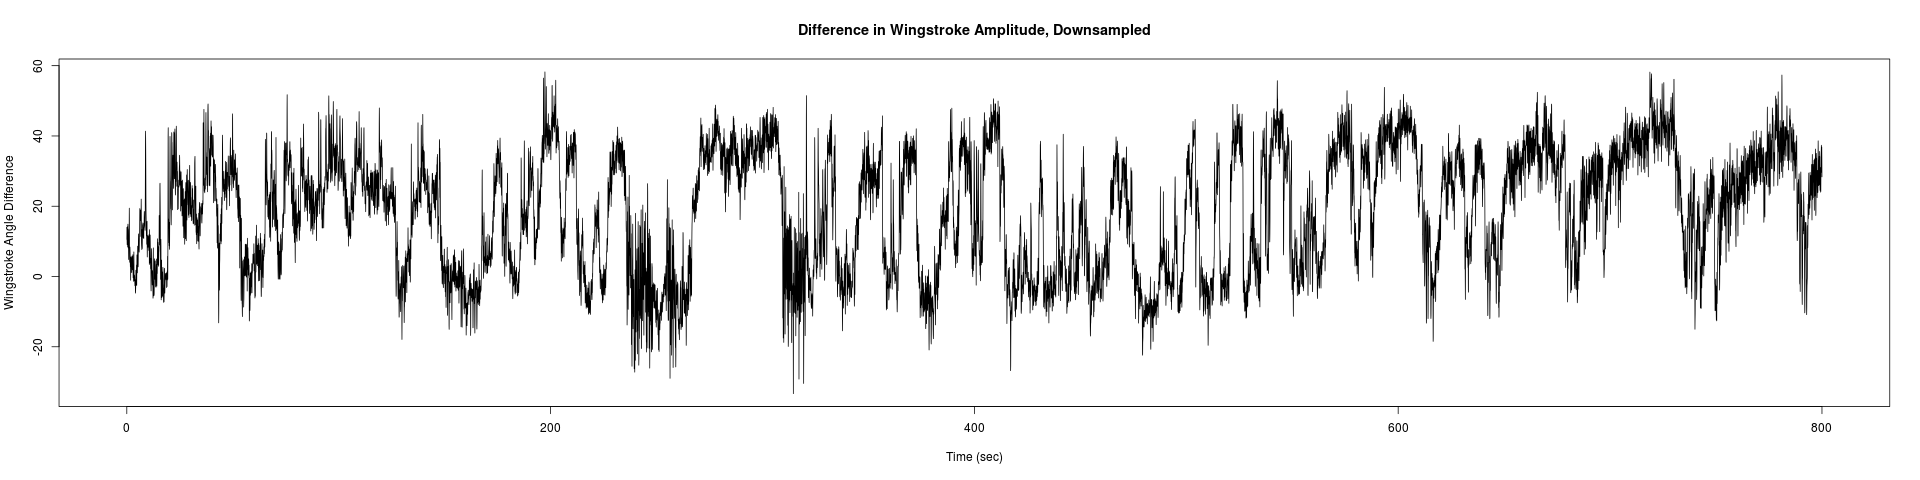
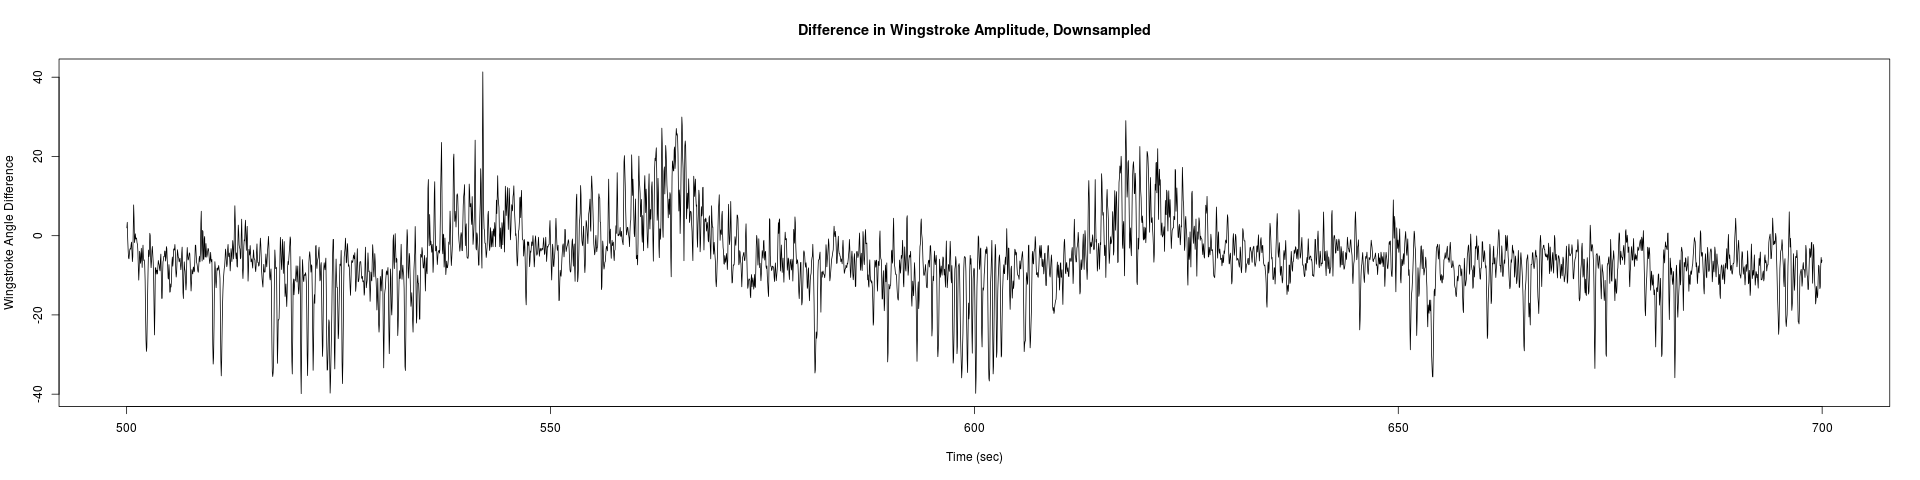
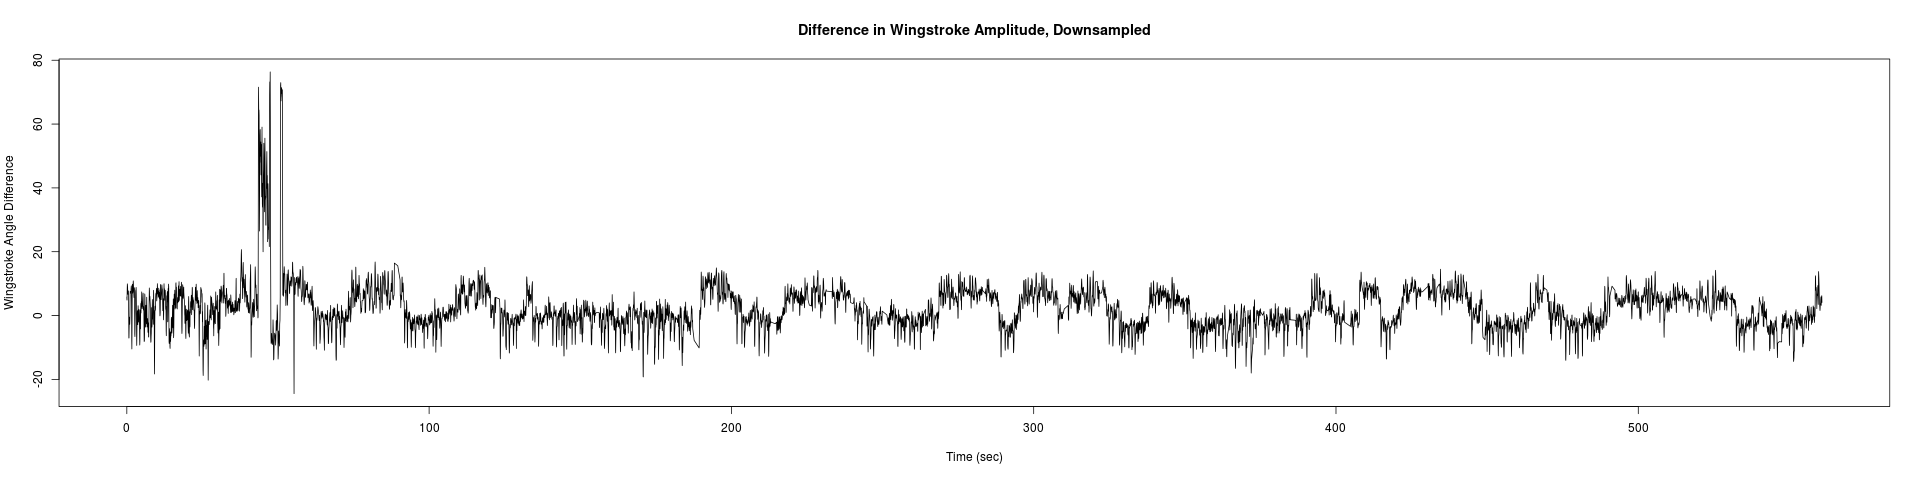
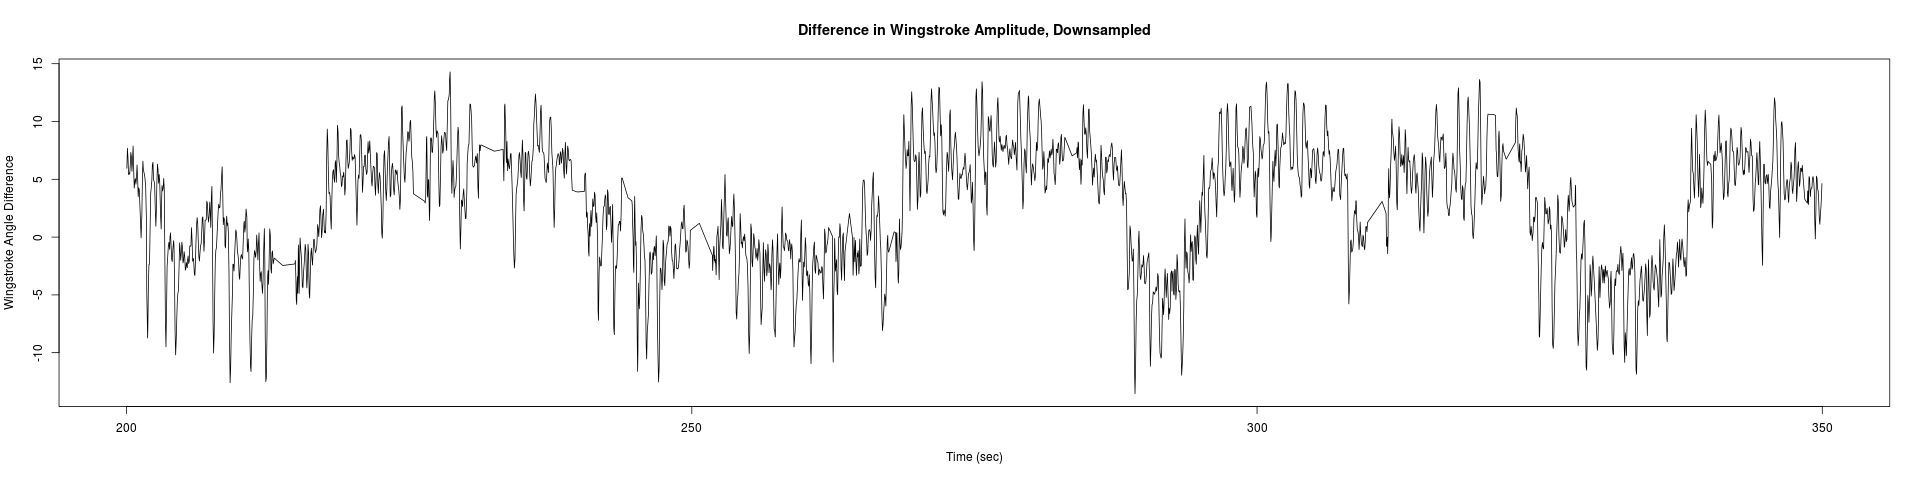
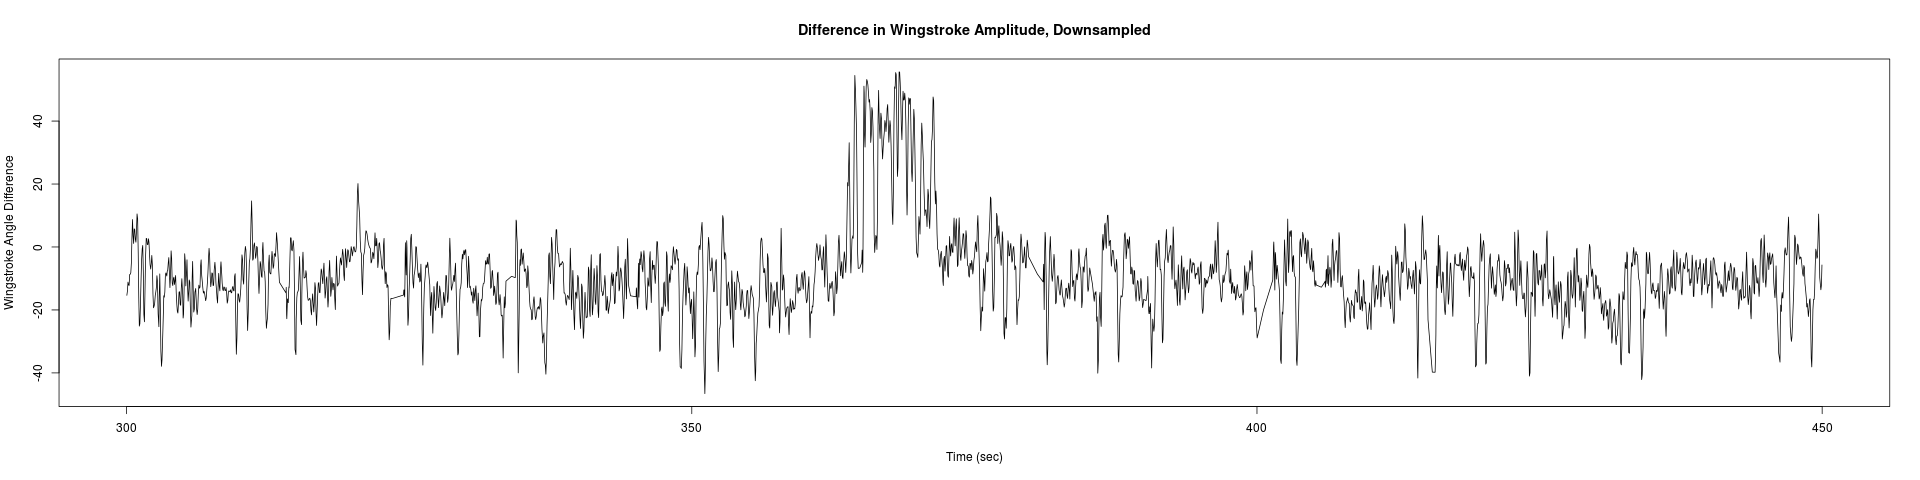
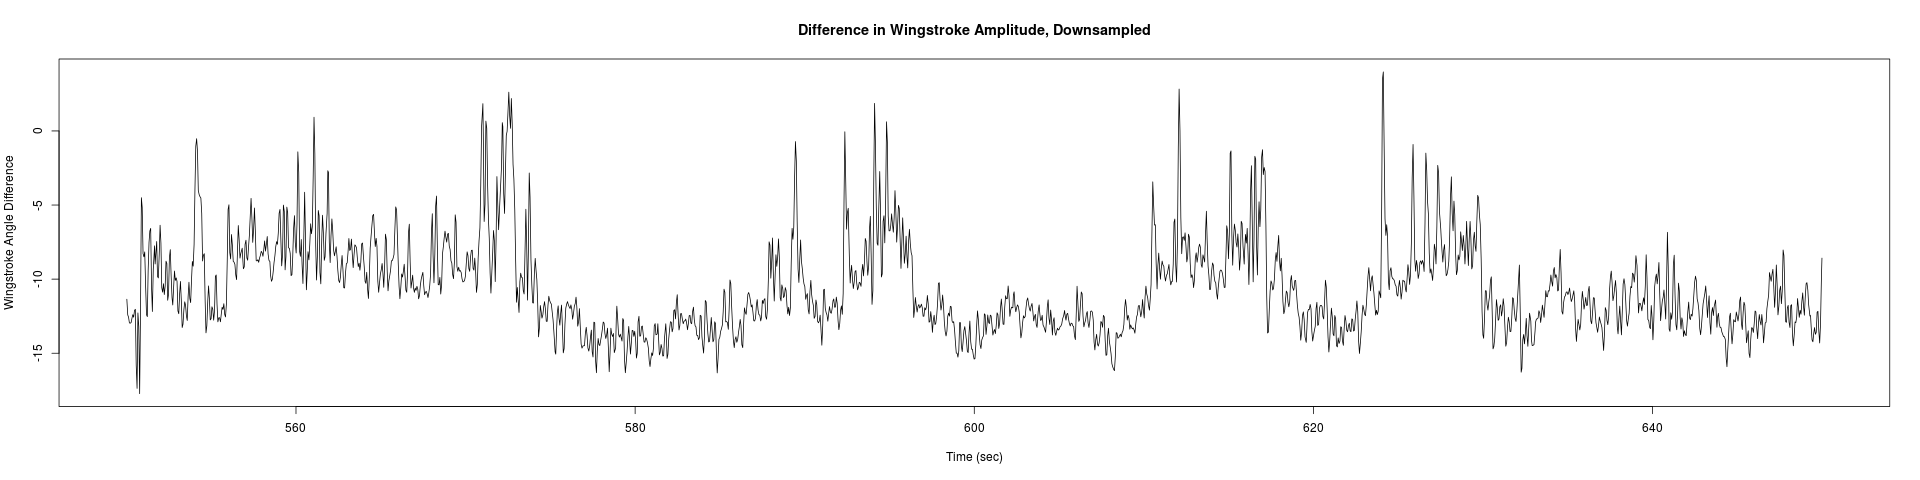
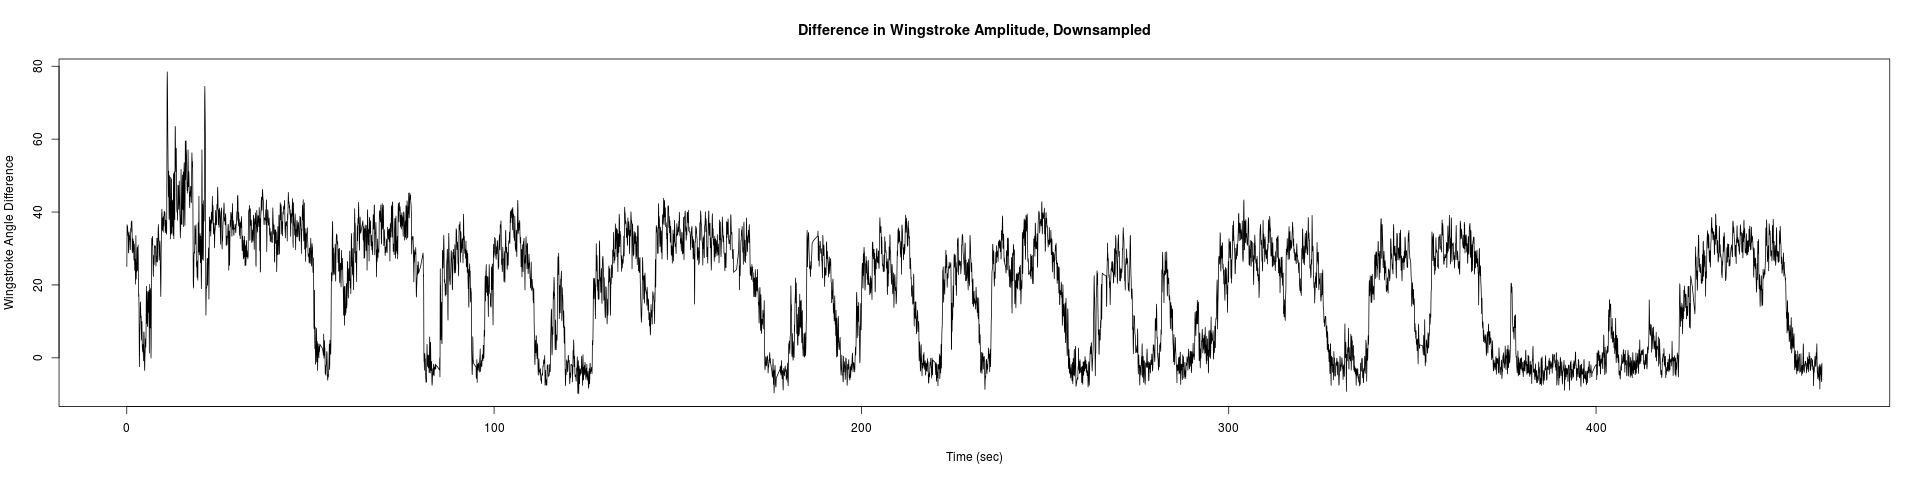
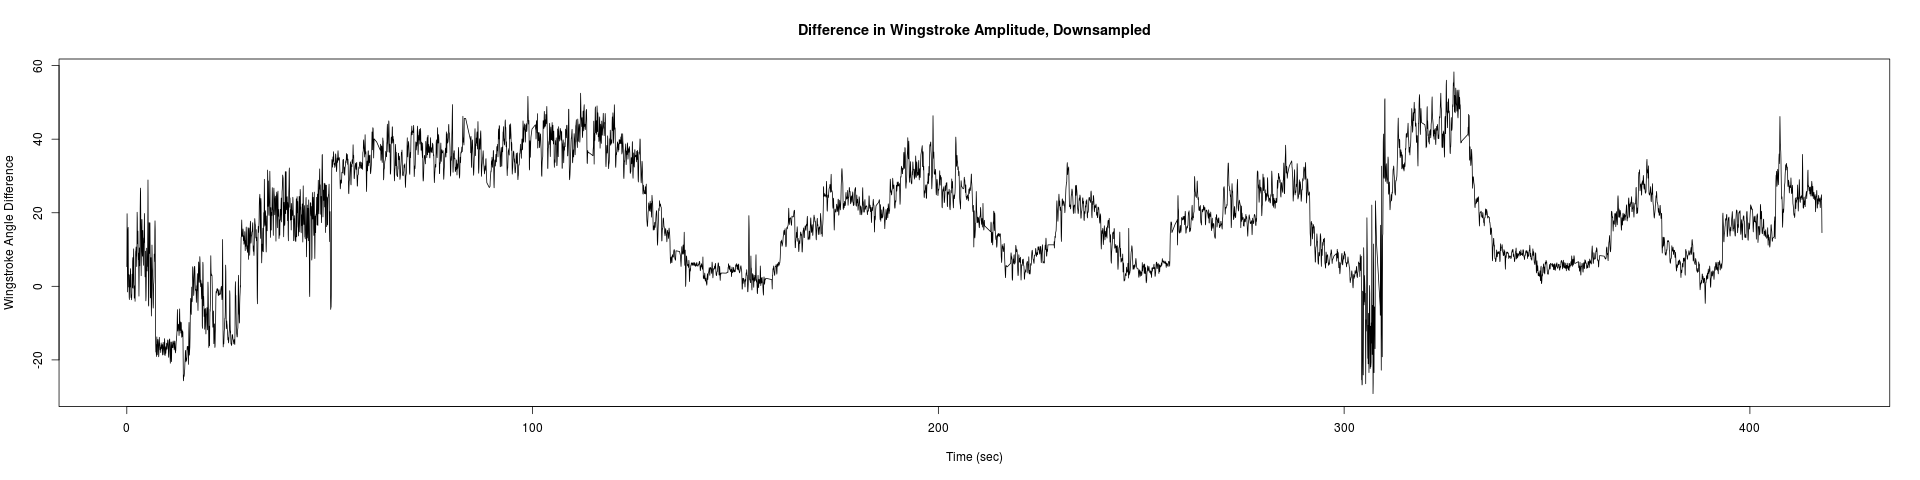
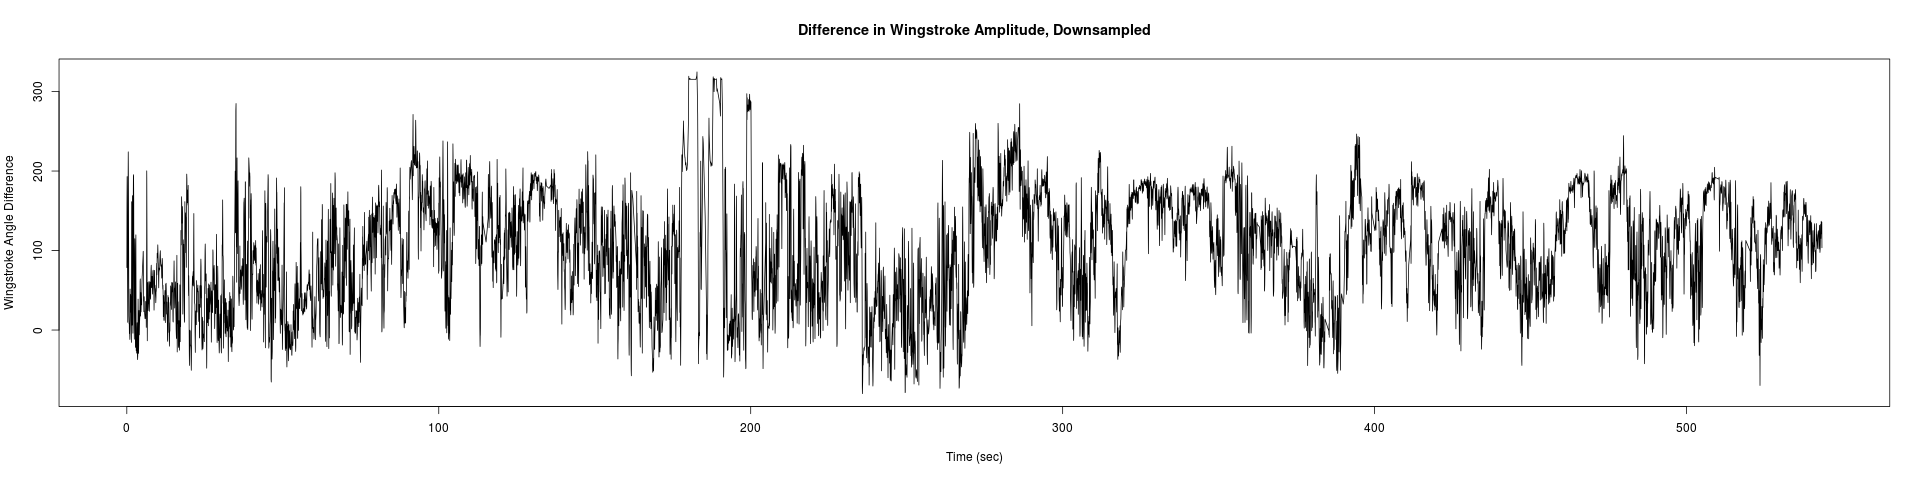
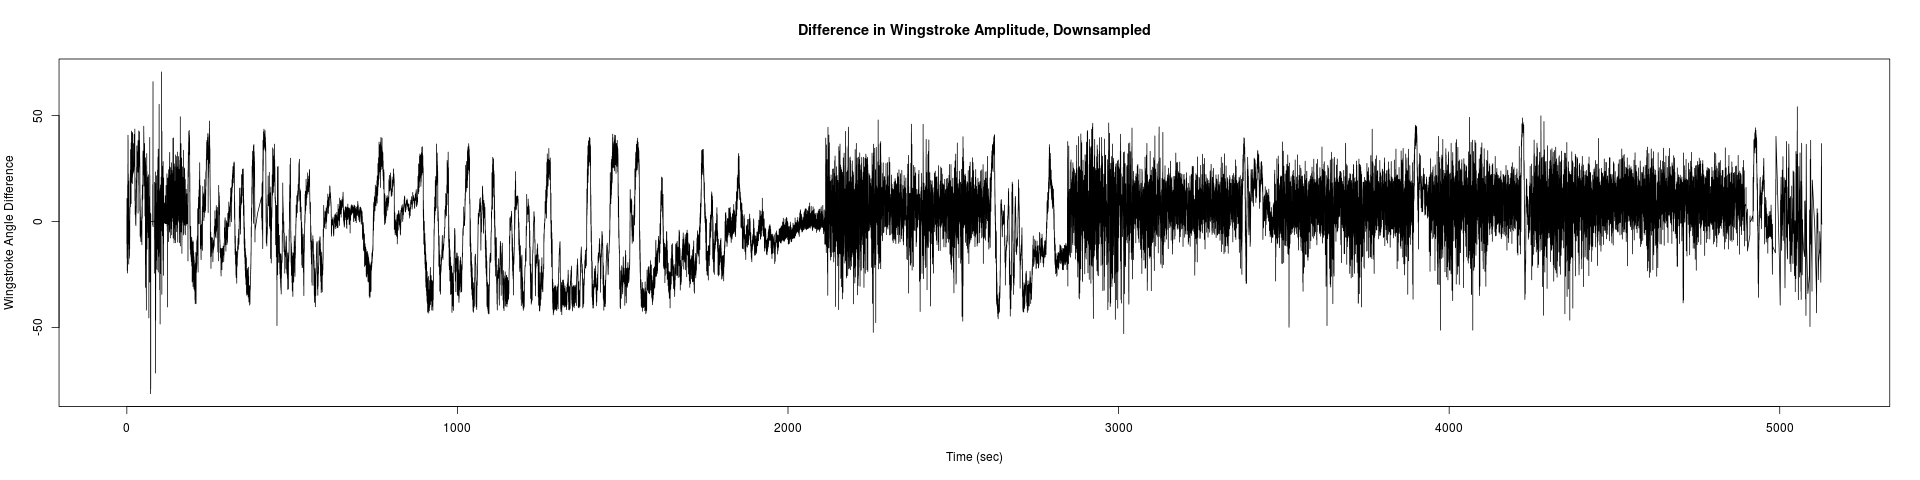
After the results in tracing of the flies from last wee. This week I’ve improved detection of the wings and the care of the flies. The results seem similar to the flight of a fly. Attached we find the trace Downsampled of the best four flies I got:
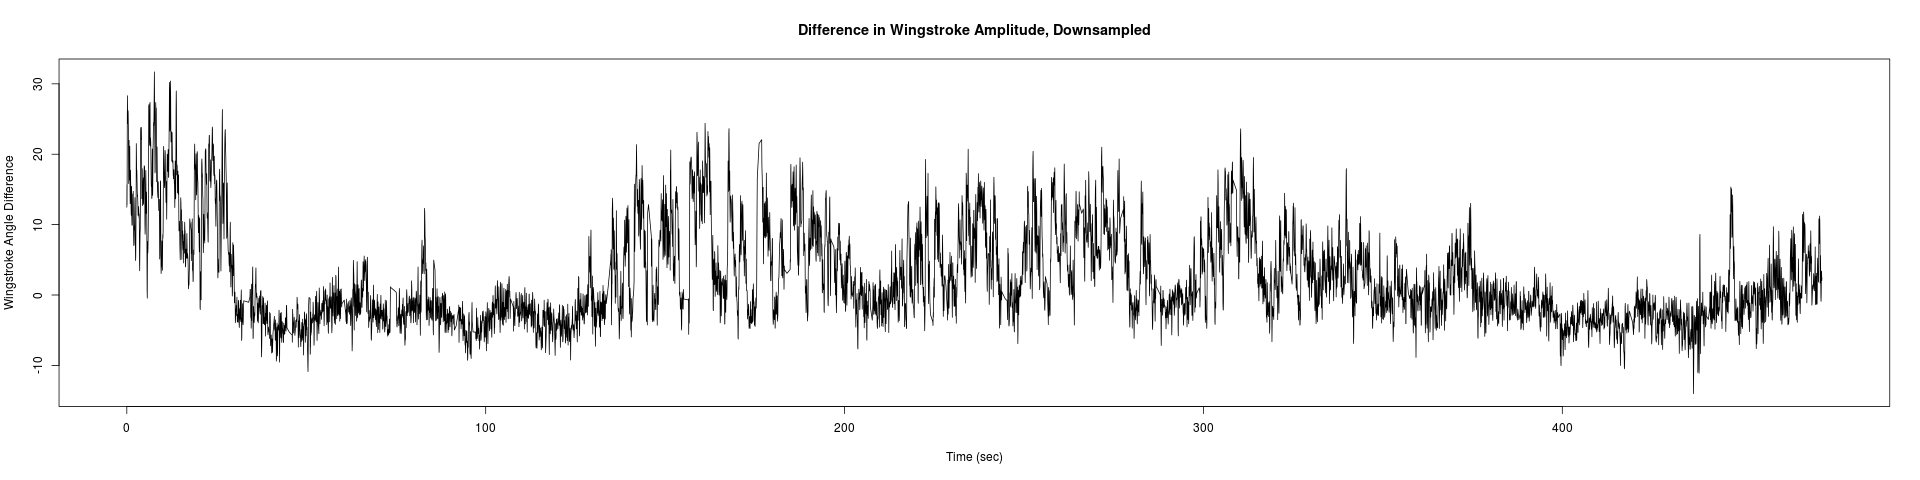
Spontaneity: Measuring Wingstroke Amplitude with Strokelitude
Those are the results of measuring the wingstroke amplitude with Strokelitude and “The ping pong ball machine”. And analysed with R studio and the scripts written by an student.
The results are not too good, comparing them with the result obtained in other experiments.
Two pictures of the trace down-sampled of my flies:
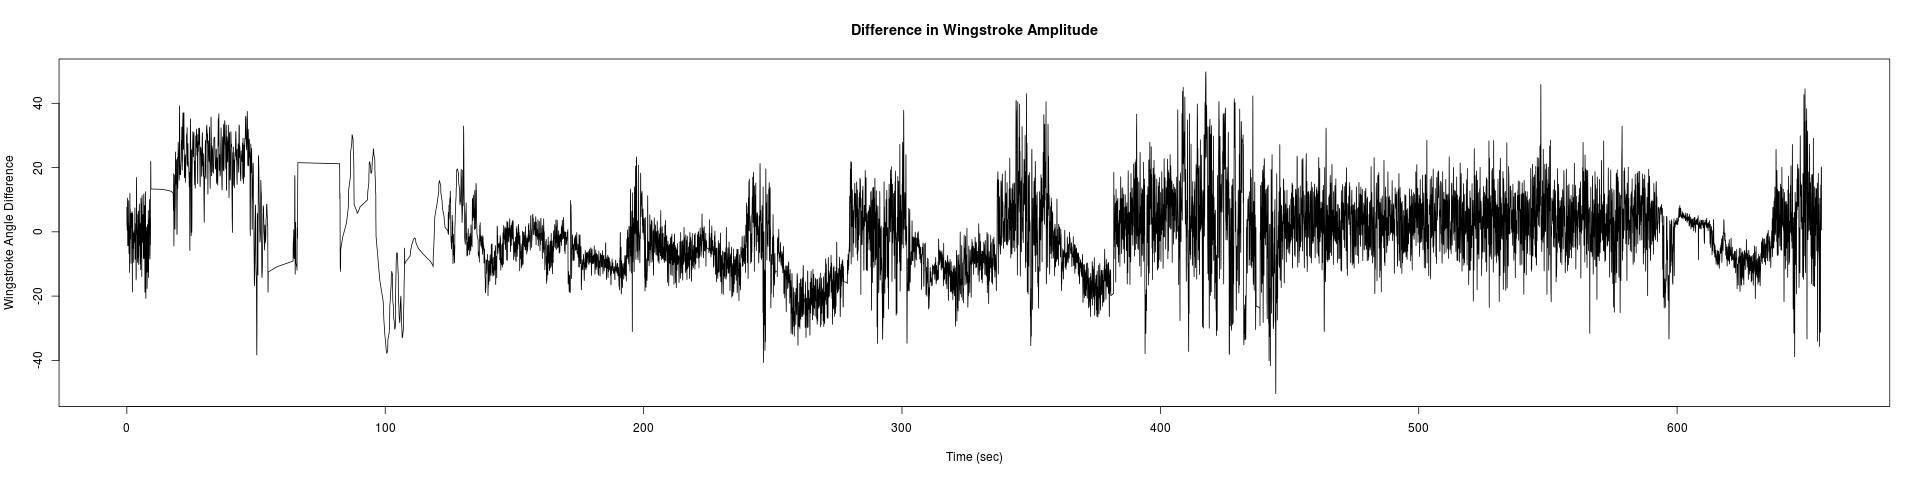
and in the next picture is how it should be plotted: