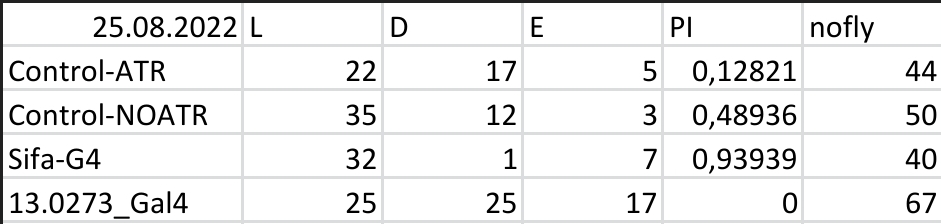
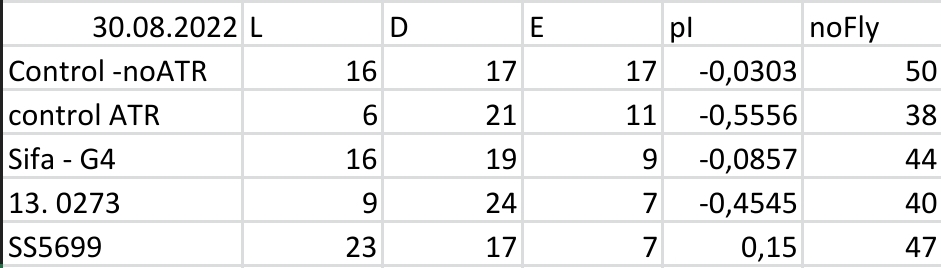
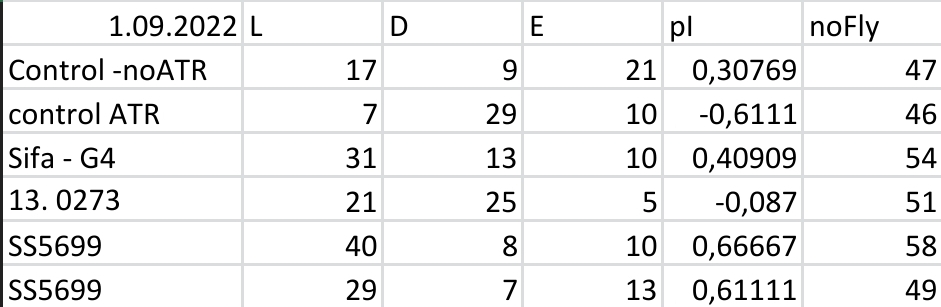
JoyStick results for re-testing PPM2 flies
on Monday, June 2nd, 2025 1:58 | by Daniel Döringer
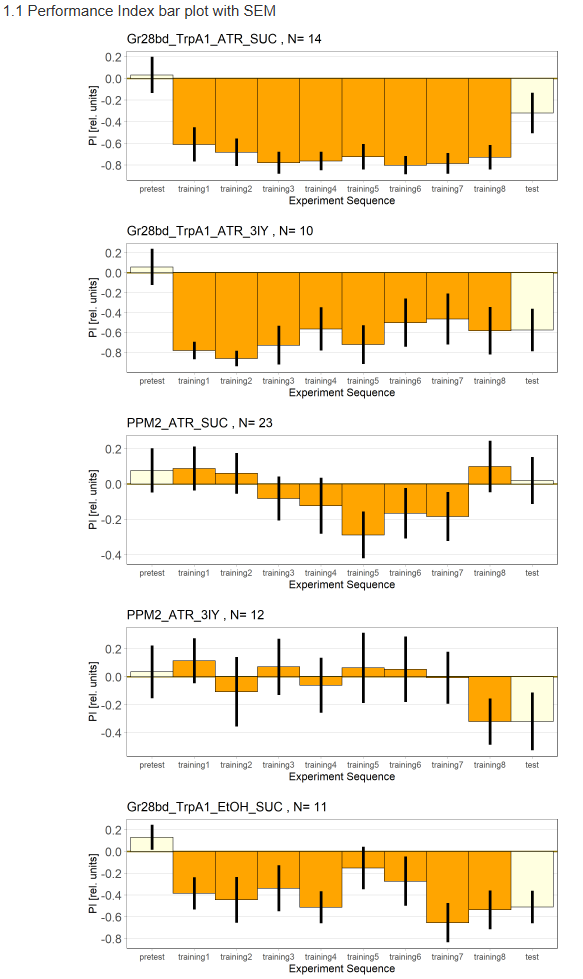
It’s not yet confirmed, that the 3IY treatment is working
Category: Optogenetics, Uncategorized | No Comments
T-Maze CIs and JoyStick Last Training PIs for yellow and red light.
on Tuesday, January 7th, 2025 1:45 | by Daniel Döringer
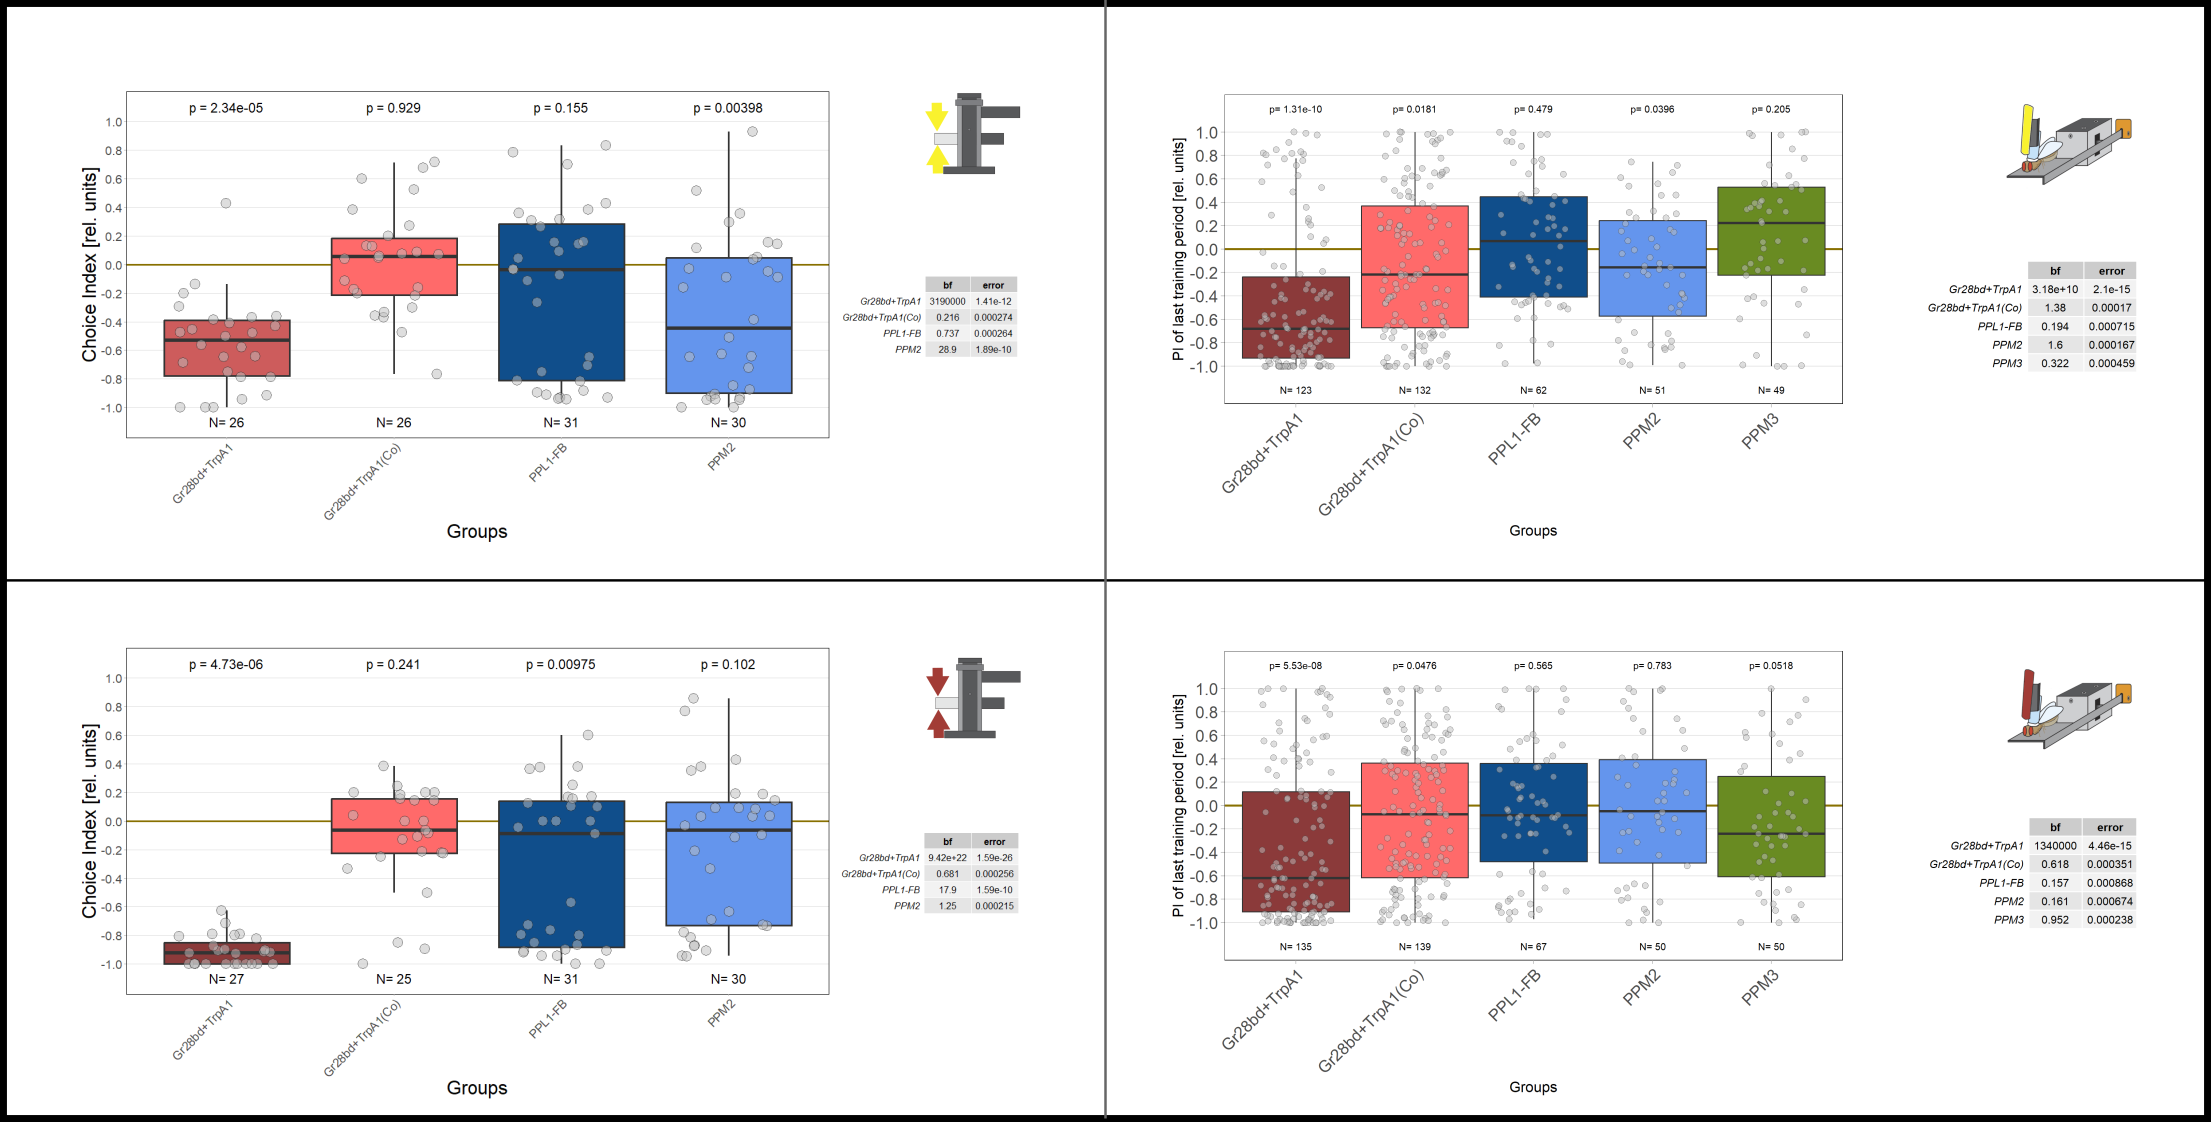
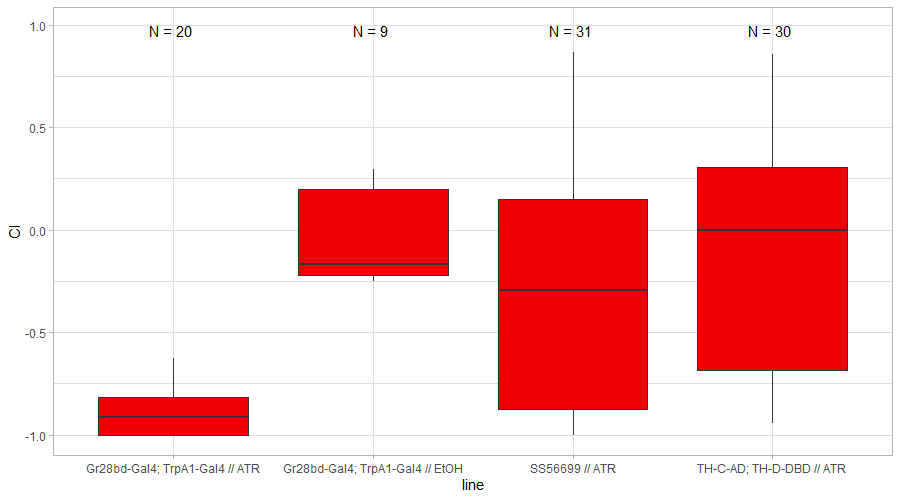
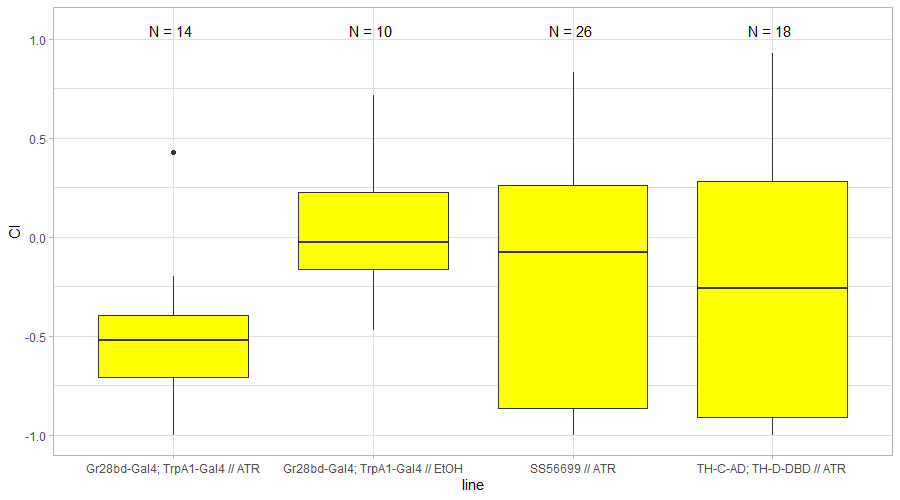
| Strain | DA neurons | Reference |
| SS56699 | PPL1-FB | Hulse et al. eLife 2021 |
| TH-D-DBD; TH-C-AD | PPM2 | Xie et al. Cell Reports 2018 |
| TH-FLP-p10; 64H06 | PPM3 | Xie et al. Cell Reports 2018 |
The left-hand side of the figure displays the choice indices (CIs) for the different groups tested for 1 minute in the T-Maze setting. On the right-hand side, the preference indices (PIs) for the final training period in the JoyStick setting are shown. Since flies of the TH_Flp_p10;64H06 line were not blind, they could not be tested in the T-Maze setting. The upper part of the figure refers to experiments conducted with yellow light, while the bottom part to experiments with red light, as indicated by the graphics.
In previous posts I referred to the different dopaminergic neurons (DA neurons) with the names of the driver lines used for the crossings. The table below the figure connects the fly strains to the targeted neurons and gives the reference. Gr28bd+TrpA1 target heat sensing neurons and acted as a control, since flies expressing the chrisom channel in these heat sensing neurons would avoid light activation. Flies were fed with all-trans retinal (ATR) for 2 days before the experiments, to enable light activation of the targeted neurons. For the negative control ethanol was used.
In the T-Maze experiments, flies were tested for 1 minute without prior exposure to light, whereas the JoyStick results reflect preferences after nine 1-minute training periods. Therefore, the T-Maze experiments should be repeated using longer testing periods. Additionally, PIs from the initial training periods in the JoyStick experiments will be included to allow for better comparison.
Hulse et al. eLife 2021: https://doi.org/10.7554/eLife.66039
Xie et al. Cell Reports 2018: https://doi.org/10.1016/j.celrep.2018.03.068
Category: Optogenetics | No Comments
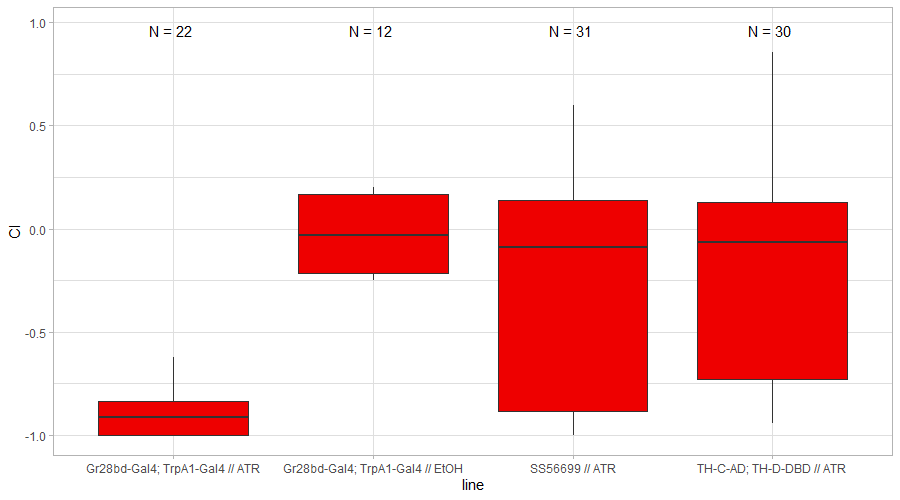
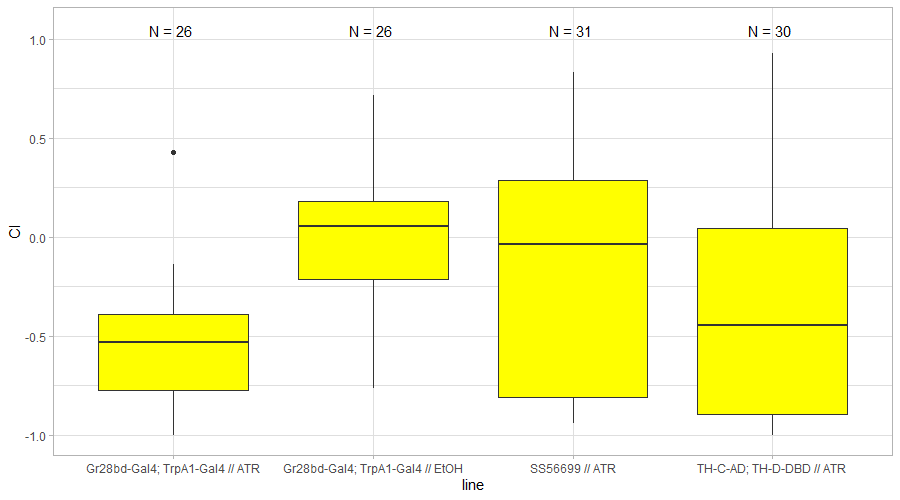
Update: T-Maze results after QC
on Sunday, September 15th, 2024 1:33 | by Daniel Döringer
For all experiments 30 or more flies were introduced to the T-Maze.
Results for red light
Results for yellow light
Category: Optogenetics | No Comments
Updated (and visually more appealing) pre-vacation results
on Sunday, September 15th, 2024 1:26 | by Daniel Döringer
Results for red light
Results for yellow light
Category: Uncategorized | No Comments
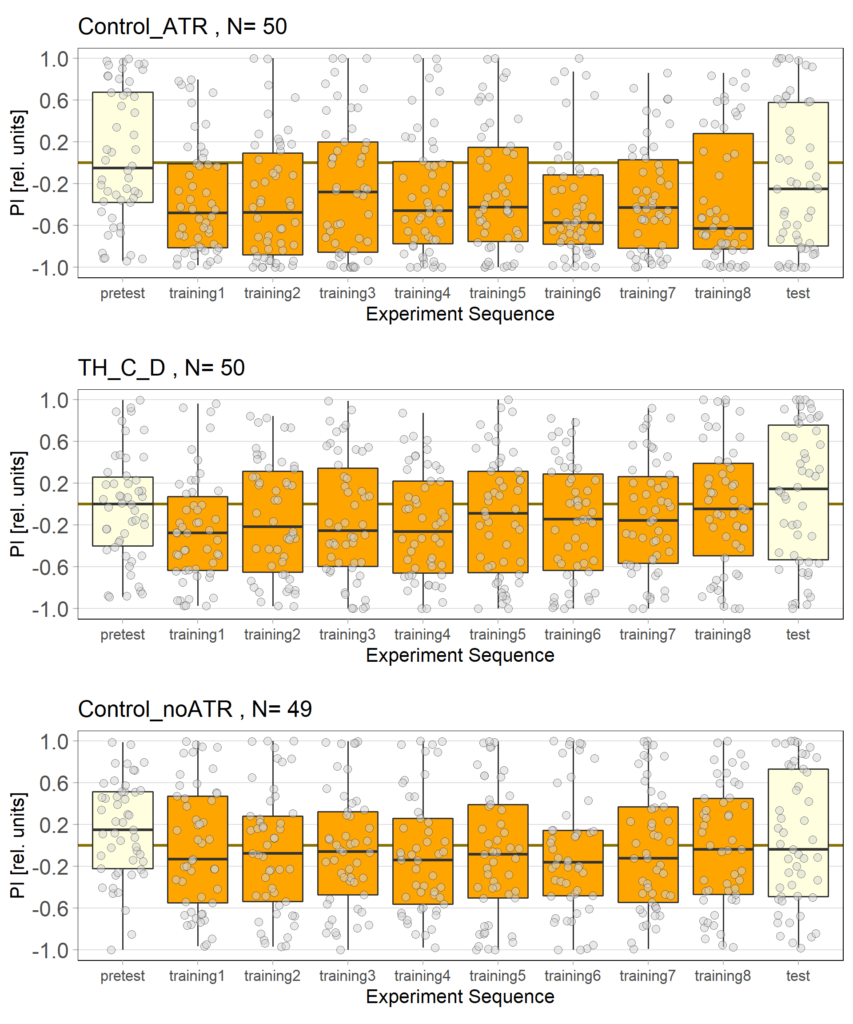
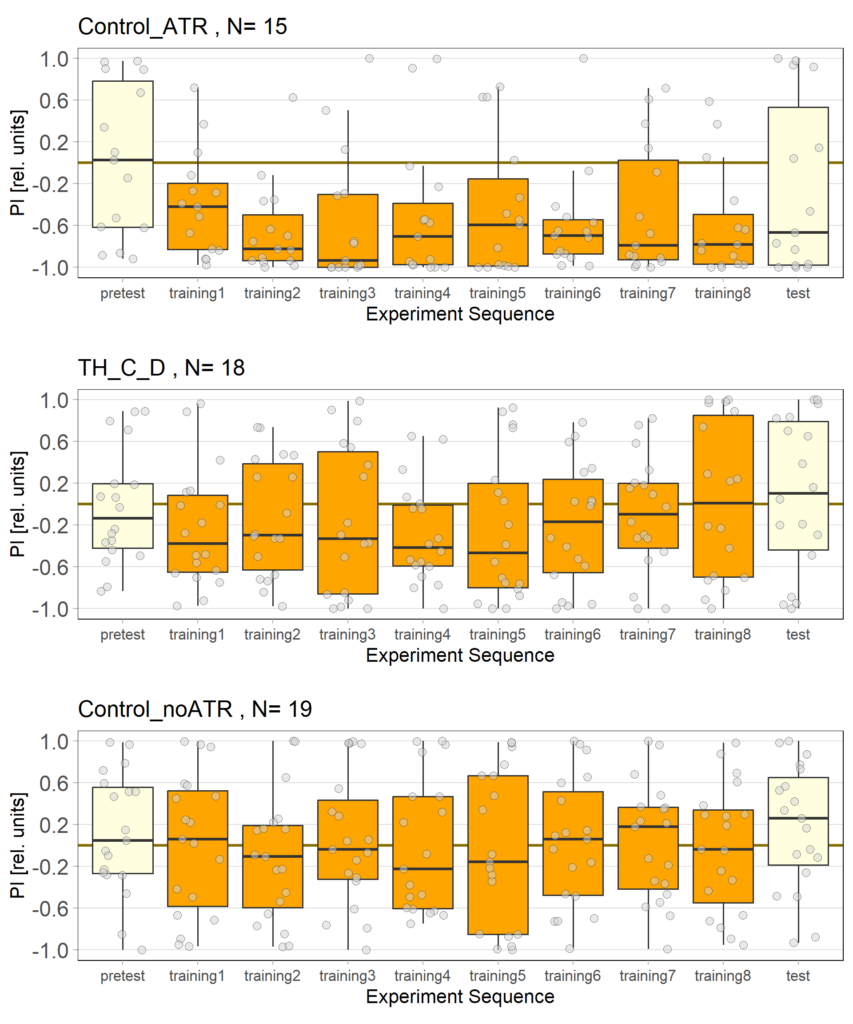
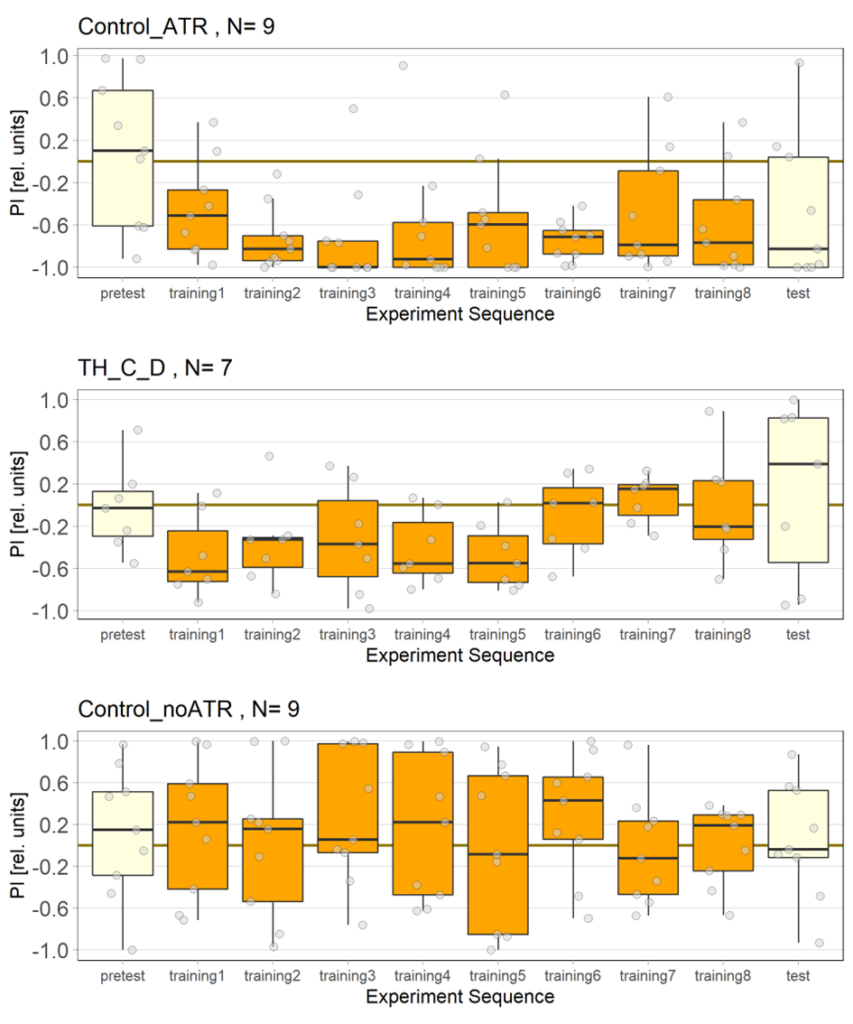
Joystick Results for 2-minute-testing
on Tuesday, May 30th, 2023 1:31 | by Luisa Guyton
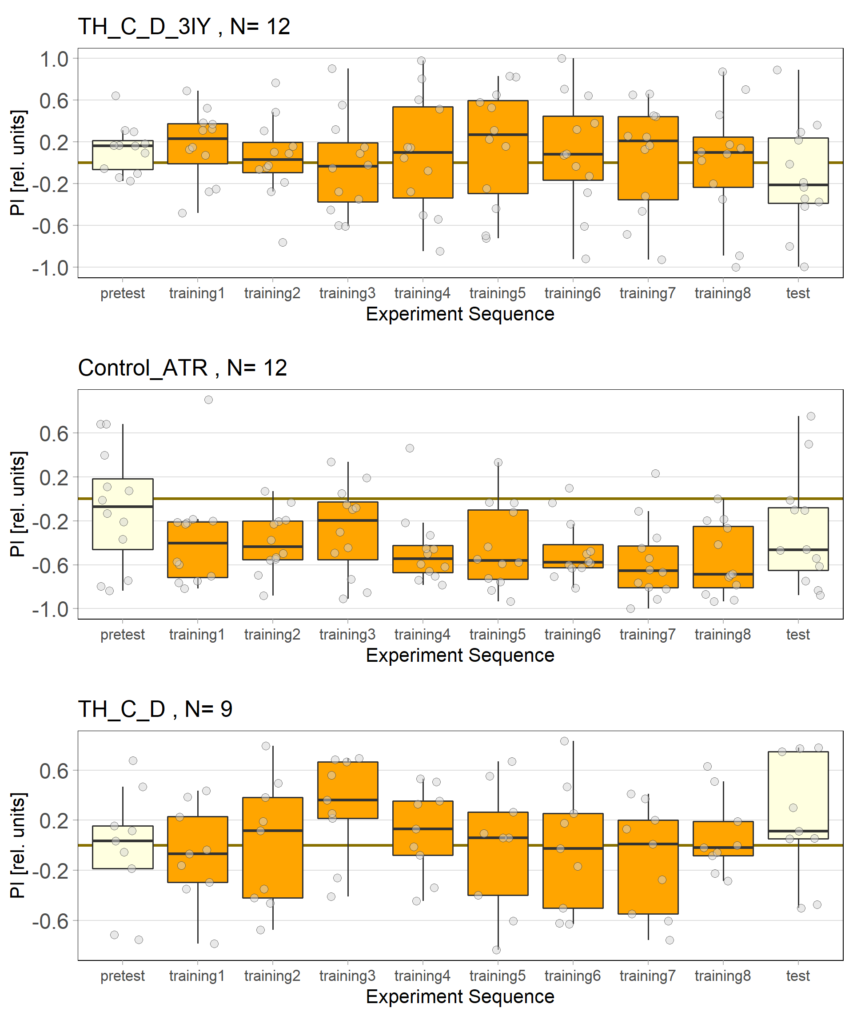
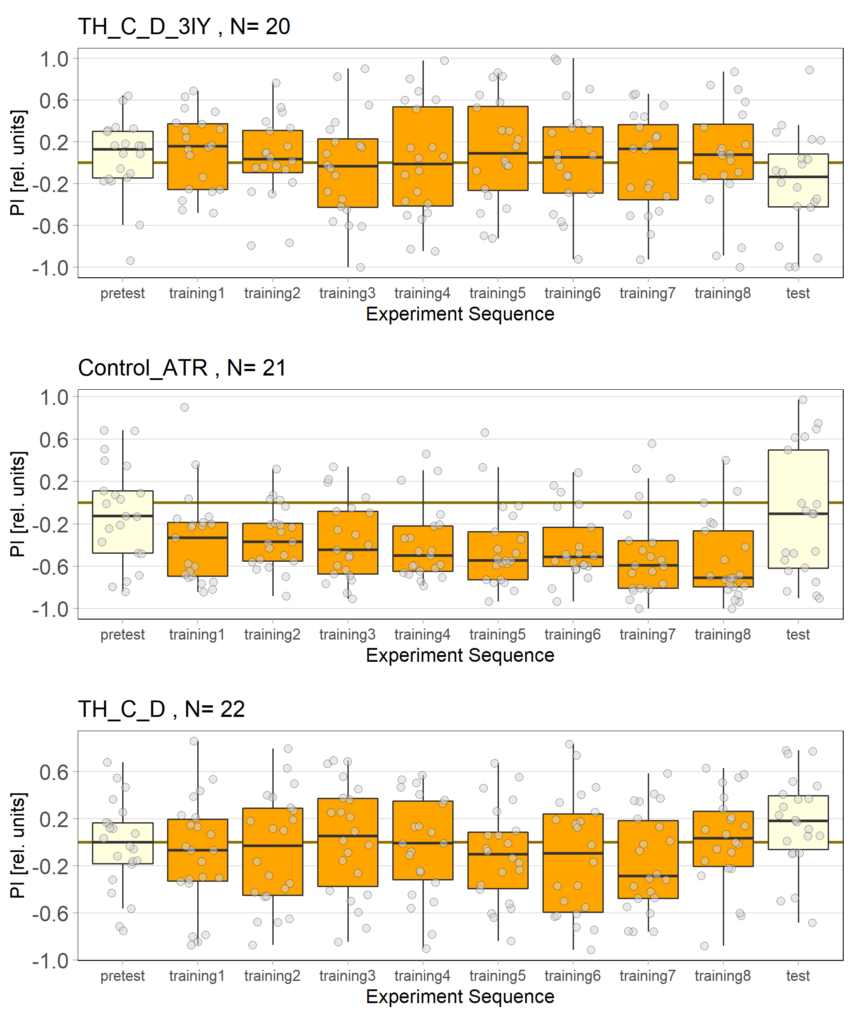
The following figures show the results of the joystick test using the same test line as before. In addition, the flies were fed not only ATR but also 3IY (3-iodo-L-tyrosine), an inhibitor of dopamine synthesis. This was done to determine whether the previously observed effect was due to dopamine alone and could therefore be suppressed by the inhibitor, or whether other factors also influenced the flies’ behaviour in the joystick test.
Category: Optogenetics | No Comments
Red light Joystick Results
on Monday, April 3rd, 2023 12:33 | by Luisa Guyton
Category: Optogenetics | No Comments
Yellow light Joystick Results
on Monday, March 27th, 2023 11:57 | by Luisa Guyton

Category: Optogenetics | No Comments
Update: Red light Joystick results
on Saturday, March 18th, 2023 1:28 | by Florian Hierstetter
After the first full week of testing the three different fly lines with red light, we have analyzed the results. We are now able to provide a further update on our findings.
While the effect for the control groups seems to stay consistent with our previous findings, the effect for the positive control has weakened and is closer to the strength measured in previous experiments. We utilized the norpAP24;Gr28bd+TrpA1>Chrimson line for both our positive and negative controls.
Furthermore, the experimental group, which previously favored red light in the post-test, showed a more varied and inconclusive profile. We will need to conduct further testing to determine whether the previously observed effect was simply caused by the small sample size.
Another important discovery was the necessity of feeding the flies sugar water 5-10 minutes before the experiment in order to maintain their activity levels. This way the flies will be identified as a valid data point by the R-script and will ensure more and more accurate data. It is important to note that we will implement this feeding process in all future experiments to ensure consistency and accuracy of the data collected.
Category: Optogenetics | No Comments
Red light Joystick Results
on Tuesday, March 14th, 2023 8:57 | by Luisa Guyton
The light used is red and has an intensity of 400 to 470 lux, the LEDs have a voltage of 7.5 volts. The control flies observed seem to show a stronger effect than in previous tests, which could be due to the use of a thinner fishing line (0.6 mm), which is easier to place correctly in the clamp of the joystick machine.
For the negative and positive control we used the line norpAP24;Gr28bd+TrpA1>Chrimson.
Category: Optogenetics | No Comments
Aslıhan Enes Red Light T-Maze Results
on Monday, September 5th, 2022 10:15 | by Aslihan Dilara Gülay
Results for Red Light T-Maze experiments.
Category: Optogenetics | 1 Comment