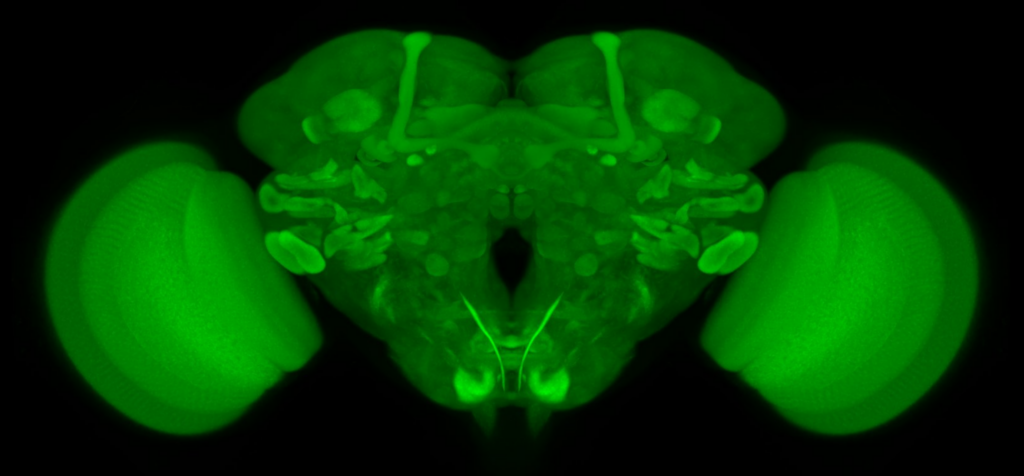
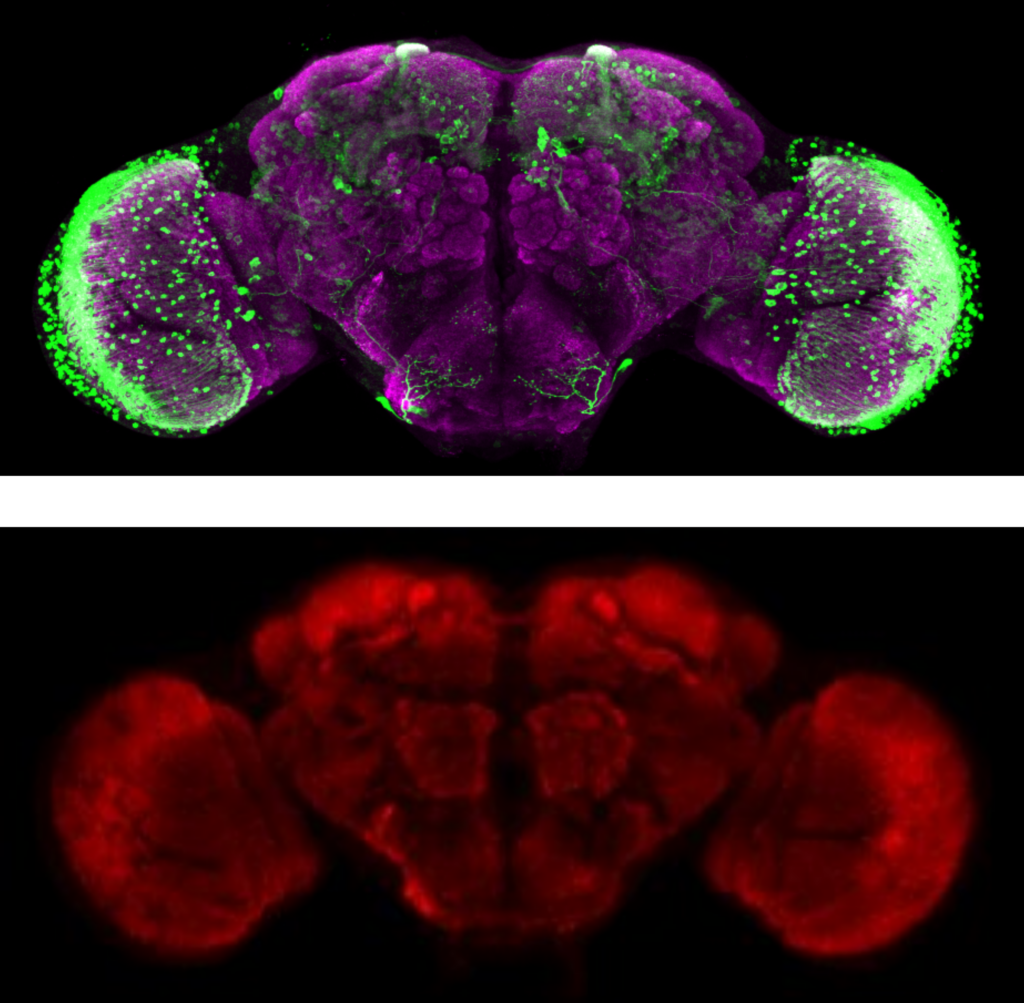
Registration of confocal images to brain template
Brain1 :
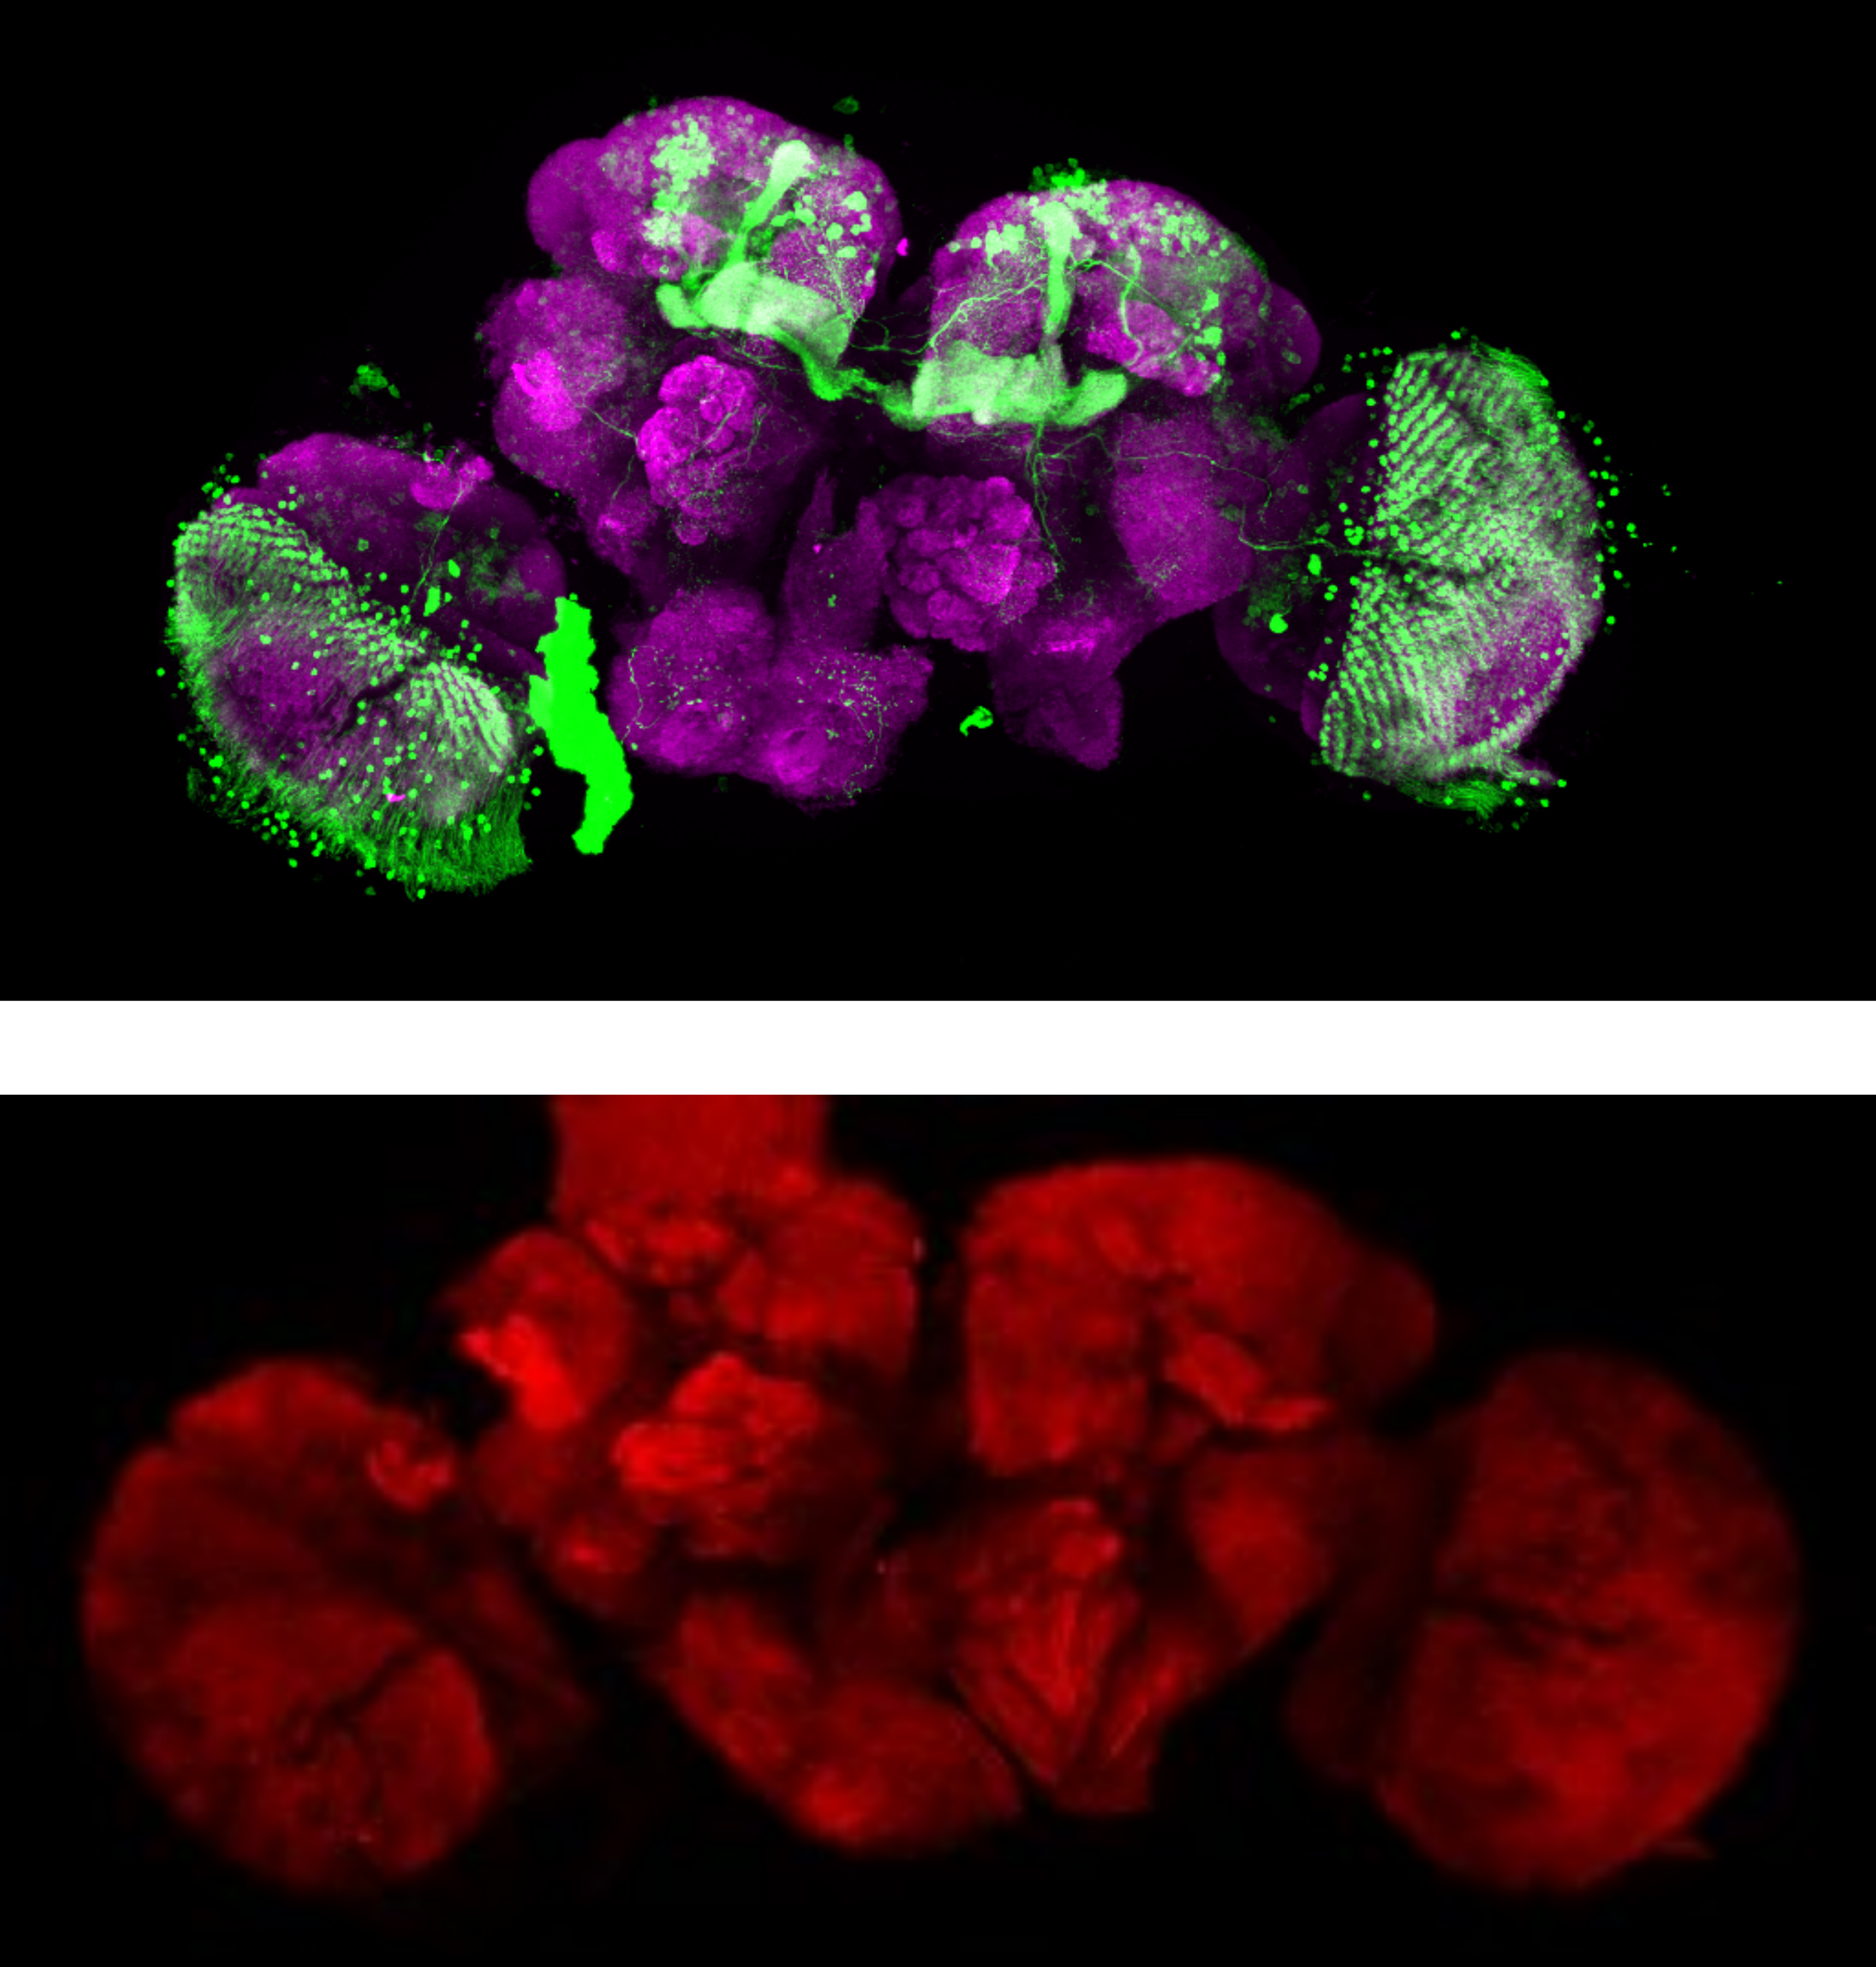
Brain 3:
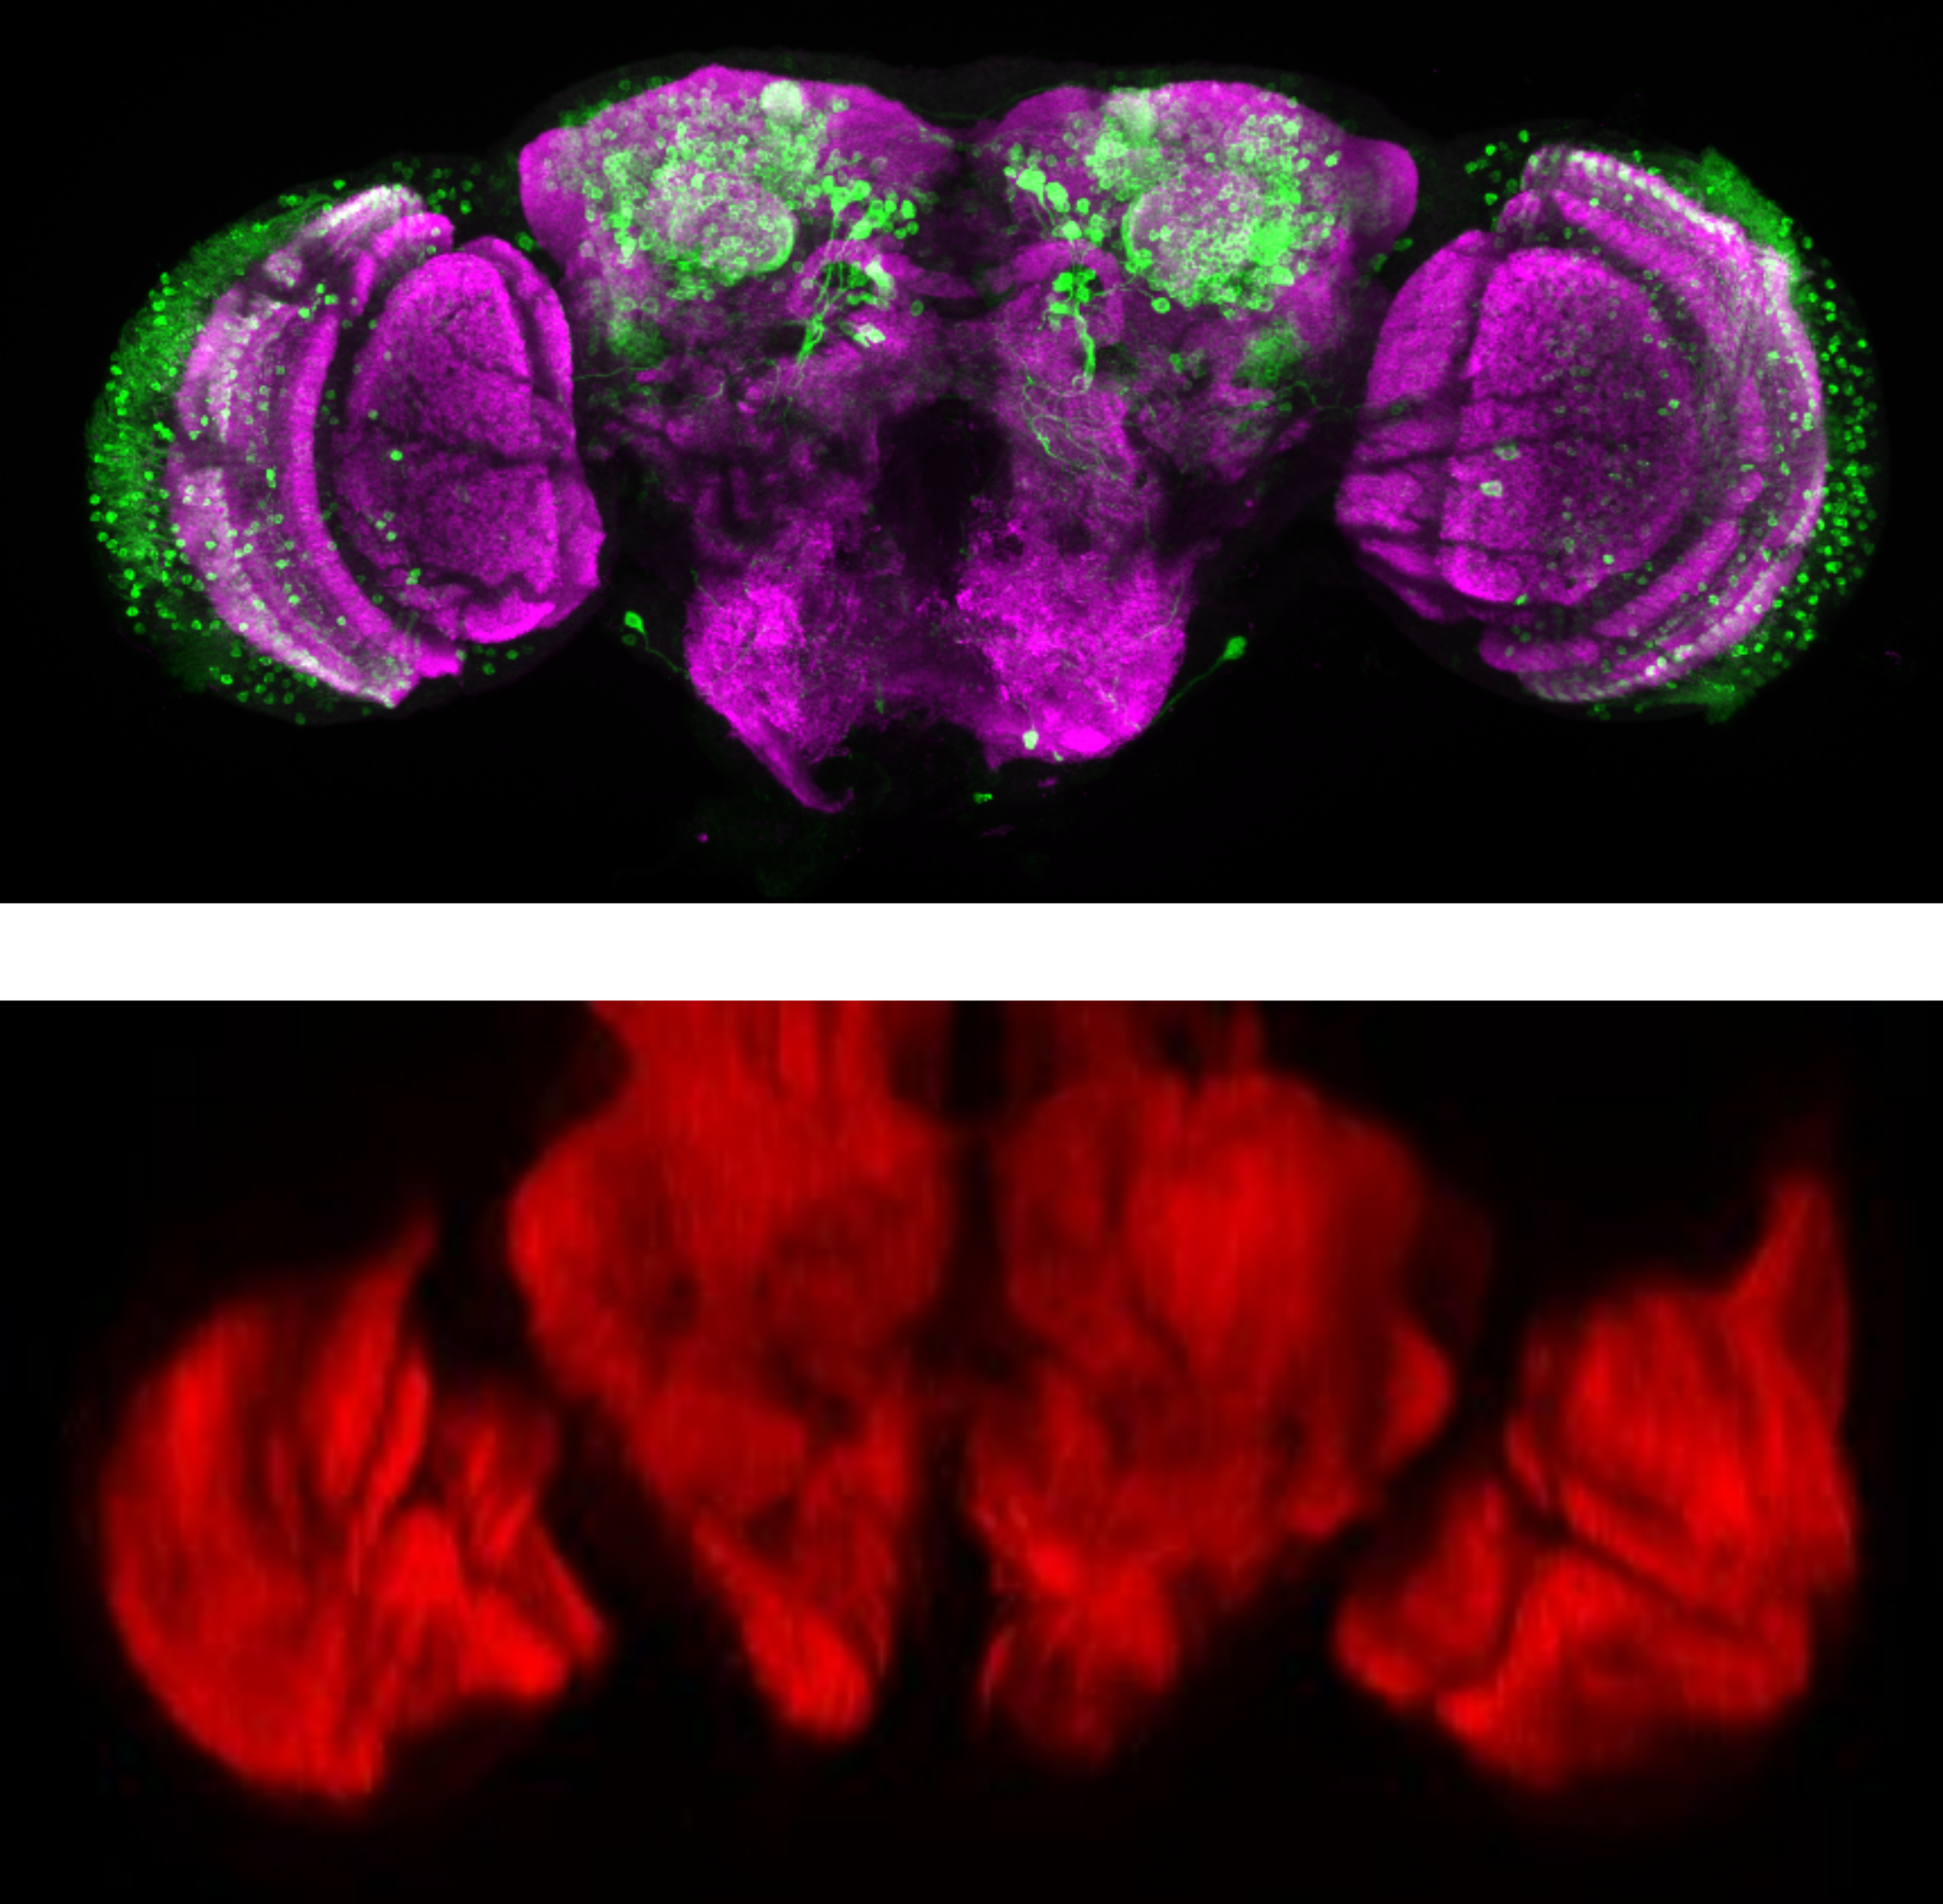
Brain 8:
To Do:
- Verify transformation via QC (Overlay etc.)
- Capture brains at higher resolution
- Apply transformation to GFP channel > identify PPL1 neurons?
Flexible Valence Coding by Dopaminergic PPM2 Neurons in Drosophila
Dopaminergic systems are involved in various physiological processes including motivation and valuation. Studies on Drosophila melanogaster imply that certain insect dopaminergic neurons (DANs) are central for the mediation of valuation, as activity in these neurons can substitute for teaching signals in classical conditioning. This view may oversimplify the complex circuitry of the fly’s dopaminergic system. We focus on an understudied population of DANs and their involvement in valence coding. Using a combination of optogenetics and different operant self-stimulating paradigms, we investigated whether flies expressing an optogenetic channel in DANs of the posterior protocerebral posterior medial cluster (PPM2) would approach or avoid optogenetic stimulation. Flies’ choice was not consistent over the course of our experiments: Initially, animals avoided the stimulating light but this avoidance weakened over time and shifted to mild approach behavior in the final stages. Pharmacologically impairing DA synthesis abolished both effects. Actively exposing flies to the stimulating light aimed to identify whether the valence shift was due to accumulating neural signaling/dopamine release during the experiments. However, exposing flies to light before testing did not induce any preference changes in one-minute choice, hinting that the behavioral change does not occur from prolonged signaling in these neurons. The observation that the very same dopaminergic neurons can mediate both, avoidance and approach behavior in our self stimulating experiments, challenges a central, dopamine-mediated valuation system. Additional findings from flies that express the optogenetic channel in heat-sensing neurons further weaken the claim of centralized dopaminergic punishment neurons, as heat-punishment was independent of dopamine.


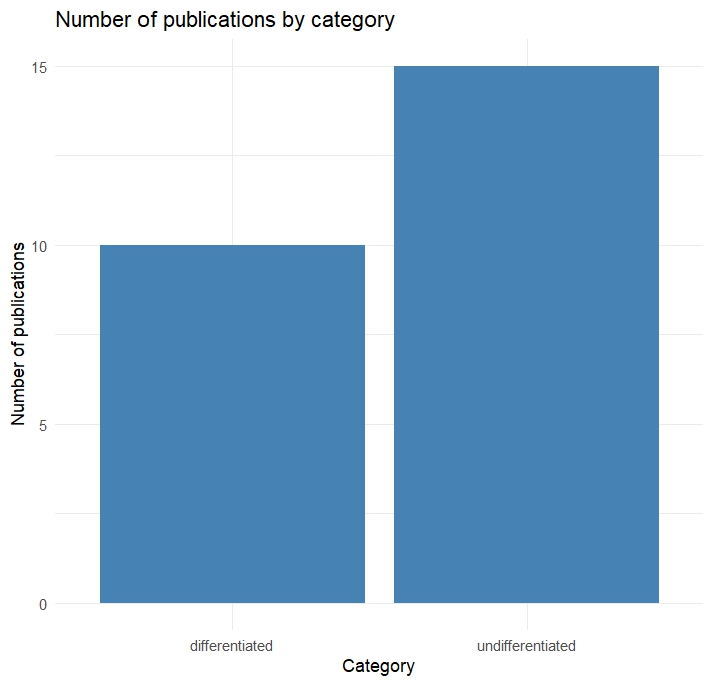
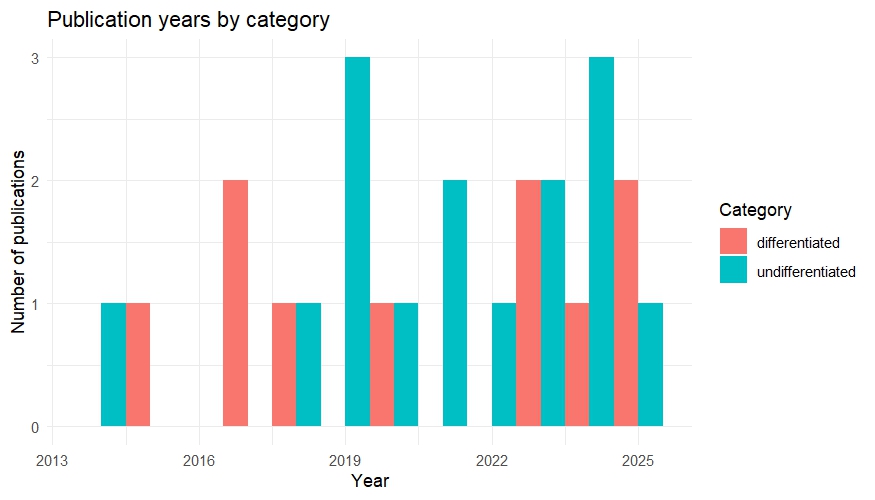
Overview PubMed literature analysis for Query “Drosophila optogenetic dopamine neurons behavior”
Since this will be a main focus of my master thesis I started a literature analysis to check how the idea of a possible “reward system” in Drosophila is addressed. Based on how authors address this topic, I categorized the results by either “differentiated” or “undifferentiated”. In this case undifferentiated means the authors were addressed certain sets of neurons as “reward neurons” or “punishment neurons”, although they could never be classified in this broad sense. For example a lot of papers of the “undifferentiated” category address dopaminergic neurons from the PAM cluster as “reward” neurons, since flies formed appetitive olfactory associative memories, when the CS (odors) were paired with optogenetic activation these neurons. Since PAM neurons are activated during sugar detection it makes sense that they can substitute for reward, but that doesn’t make them “reward neurons”. Real “reward neurons” would activated in any instance of reward, independent of whether it is sugar, mating or water. Many authors do not address this issue properly. Although this analysis is not finished yet I created two plots to visualize the general trends:
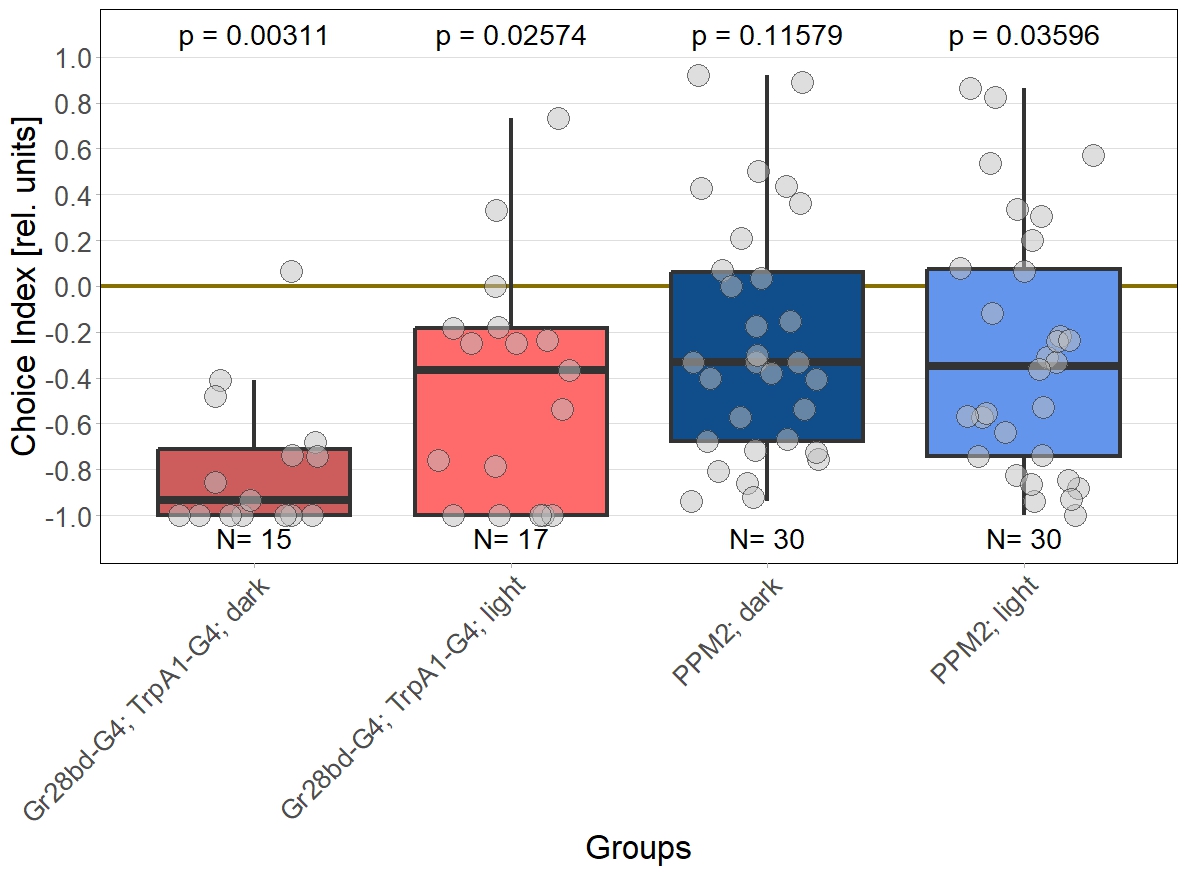
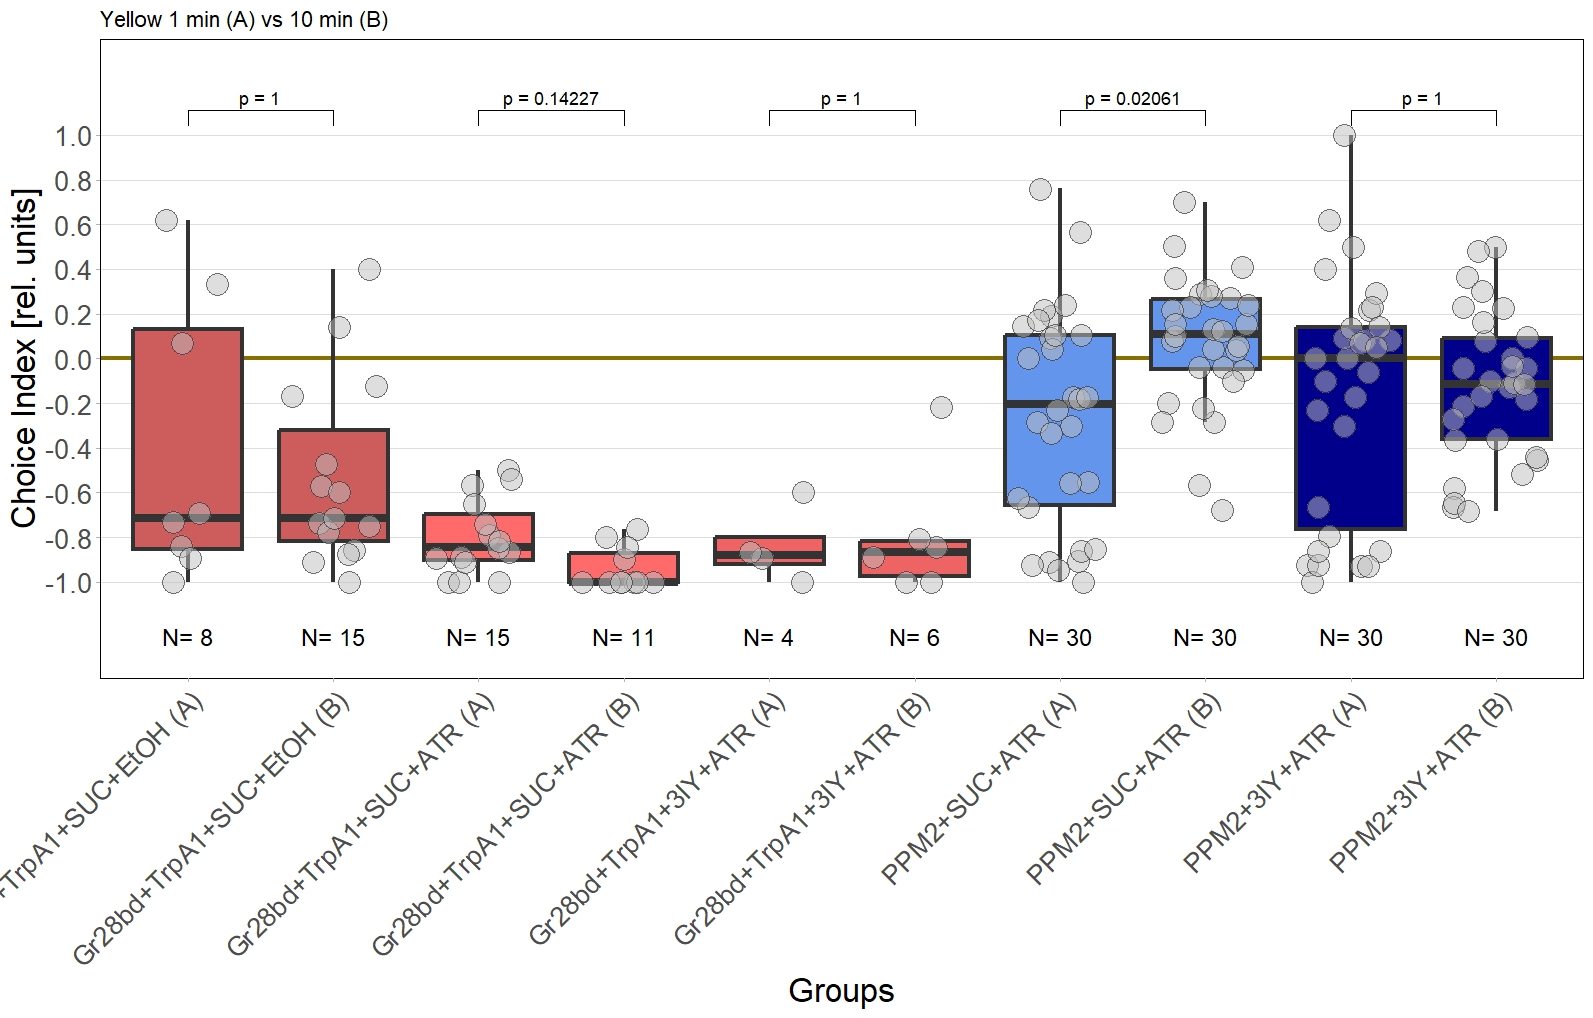
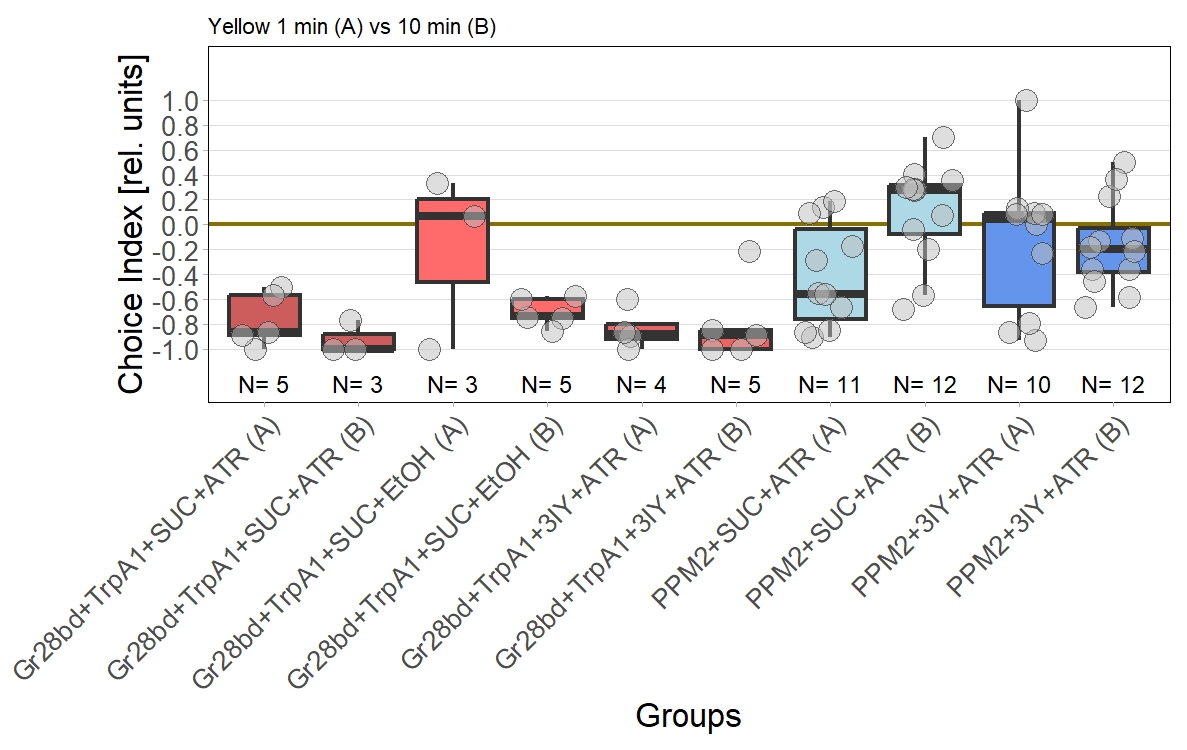
Final results of yellow light T-Maze experiments with dopamine depletion using 3IY
In previous experiments we tested flies expressing the optogenetic CsChrimson channel in PPM2 neurons. We observed mild avoidance at 1 minute, which decreased over the time course of 10 minutes, even leading to positive choice indices. To verify whether the observed effect was instructed by dopaminergic signaling, I depleted flies of dopamine using the competitive tyrosine-hydroxylase inhibtor 3-Iodo-L-Tyrosine, and tested flies again in red and yellow light T-Maze, for 1 and 10 minutes. The figure below shows the results for the yellow light T-Maze. Although we can see the same trend from avoidance in the beginning to mild approach after 10 minutes, this effect was not significant. For the 3IY treated experimental groups, we can assume that the general effect mediated by these neurons seems to be absent, when animals are depleted of dopamine.
Although I could not observe a significant effect here, I plan to follow up these experiments with yet another set of T-Maze experiments. This time I plan to actively activate the neurons prior to testing. I hypothesize, that prolonged activation of the neurons might affect their valence for the animal and therefore expect animals which experienced this activation to show differences in 1 minute testing.
Current T-Maze results and power analysis
I am currently still performing T-Maze experiment with red light, to check for dopamine dependency of the effect I observed in the original 1 vs. 10 minute T-Maze experiments using yellow light and PPM2 flies.
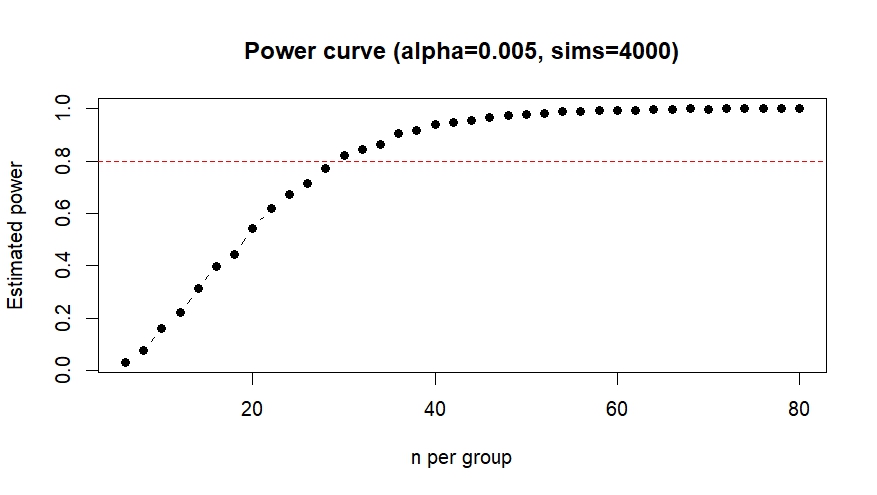
For now I planned to aim for a sample size of 30 experiments per experimental group, with the justification that this was also was I aimed for in the original screen. To see whether this sample size is sufficient to verify the effect (or it’s absence) I performed a power analysis and based it on the previously observed effect size.
Cohen’s d (from original screen) = -1.023 (large effect)
I used the power.np.wilcoxon() function from the pwrss package to calculate the sample size needed to achieve 80% statistical power with an alpha level of 0.005.
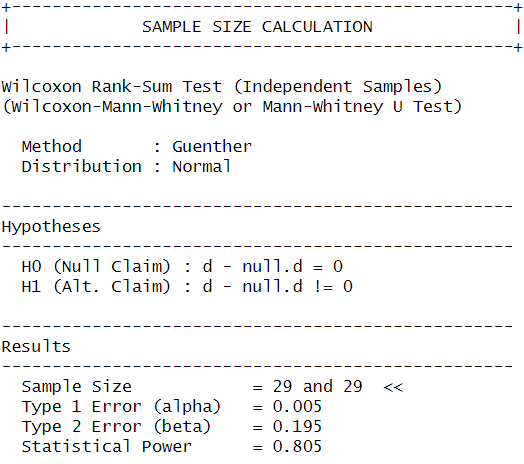
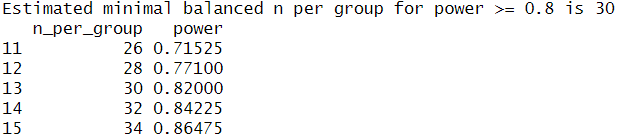
This confirmed that I would need at least 29 observations per group to detect the same effect as observed before, so I will keep aiming for a sample size of 30. Since I was unsure whether my analysis was correct I performed a second power analysis in R with an analysis script provided by ChatGPT, which calculated the sample size using simulated drawings from my original data. This analysis also resulted in a target sample size of 30 so I am fairly confident my calculations were correct.
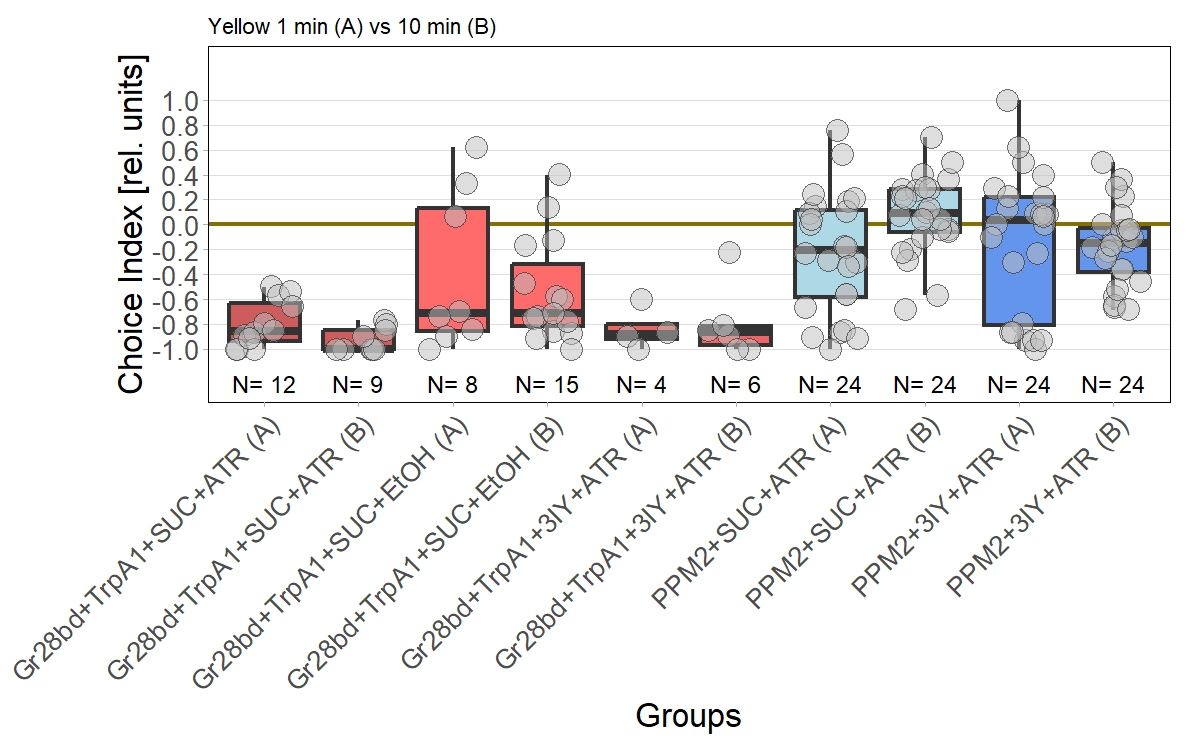
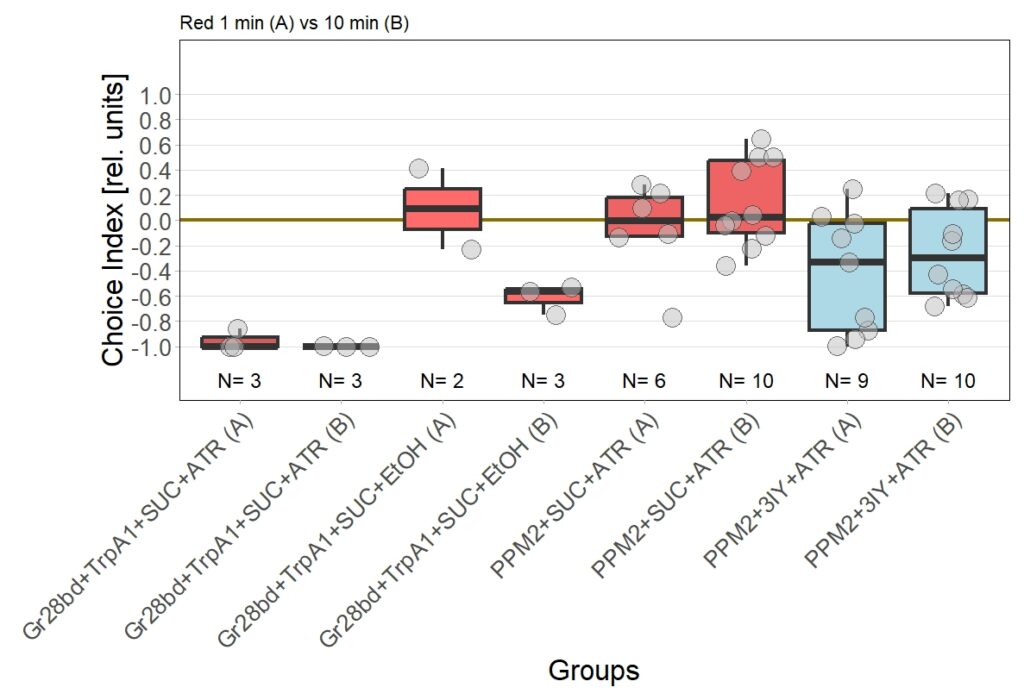
Yellow T-Maze Results
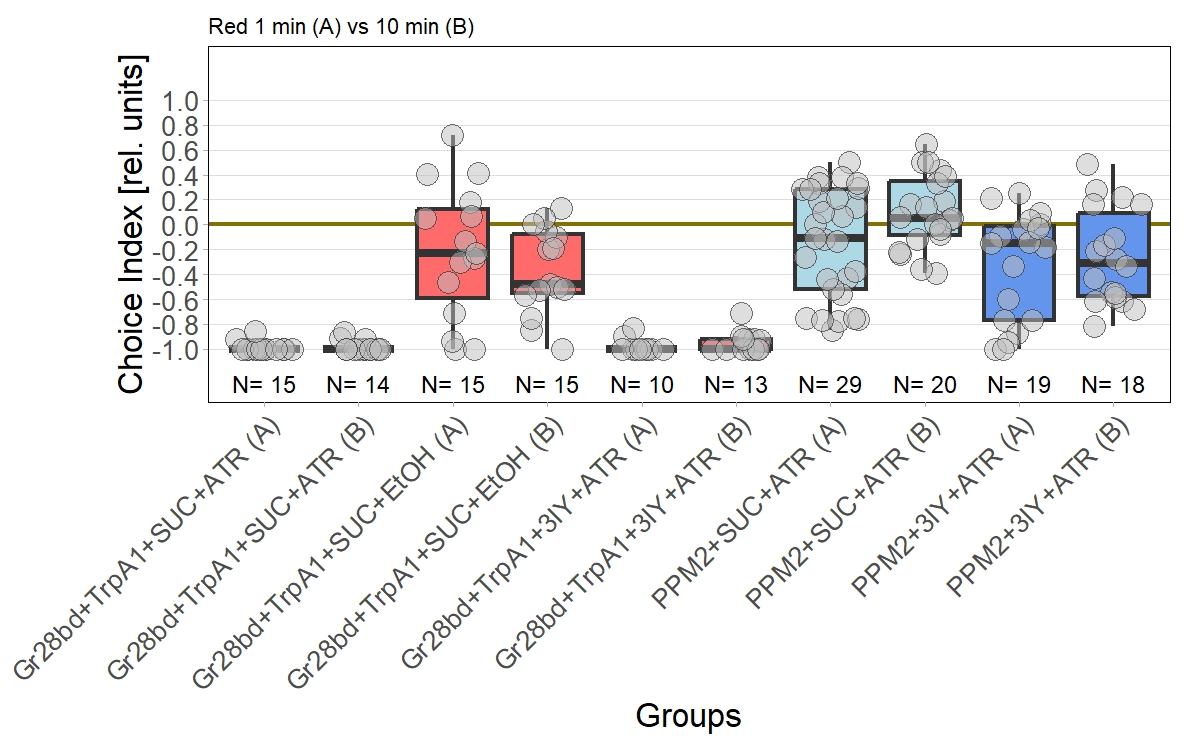
I performed the first set of T-Maze experiments, which included 3IY treated flies, with red light. In this experiment I could nicely reproduce earlier results in PPM2 flies only treated with ATR. Flies initially showed weak avoidance of optogenetic stimulation, and developed a weak approach-behavior over the time course of ten minutes. In the 3IY treated flies I found similar avoidance after 1 minute of testing but, interestingly, flies kept the same level of avoidance also for a choice time of 10 minutes. This indicates that initial avoidance might be independent of dopamine, but prolonged or repeated release of the neurotransmitter from PPM2 neurons might lead to circuit changes, weakening avoidance behavior, potentially even changing it to approach.
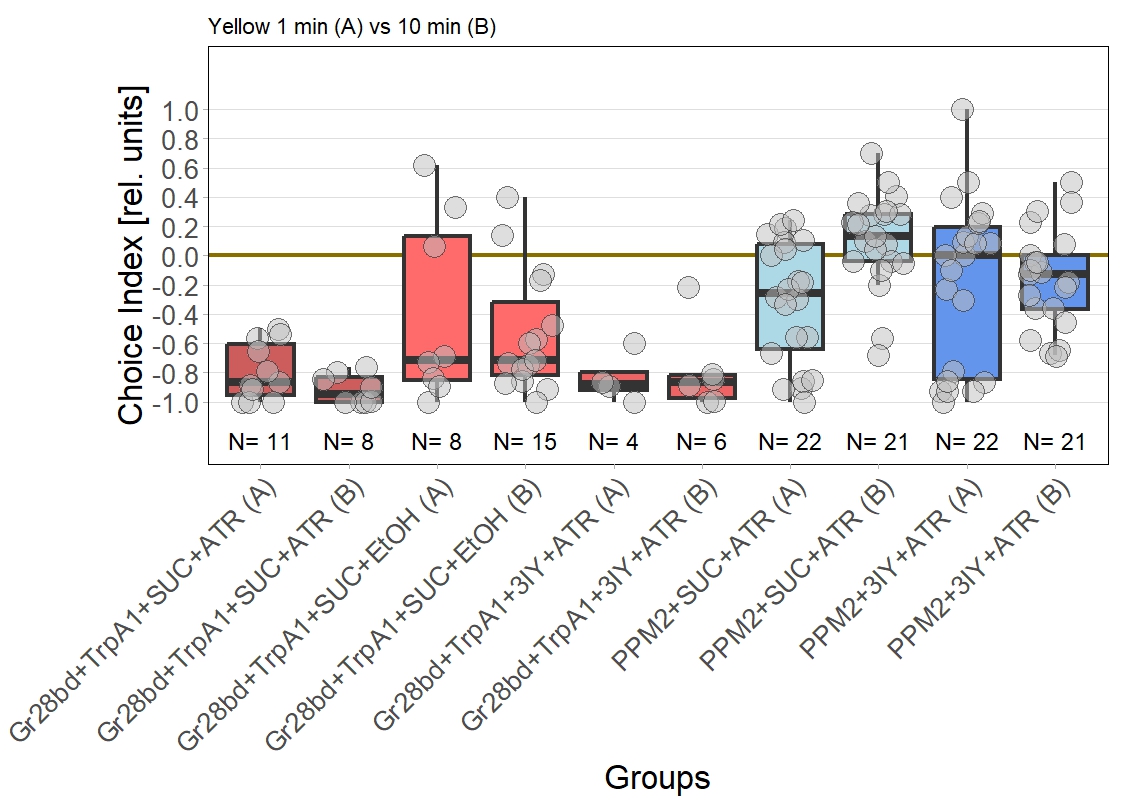
The new set of experiments uses yellow light instead of red light. This experiments are especially interesting, as I observed stronger effects for the experimental group for yellow light.
There are two main points to discuss about the data.
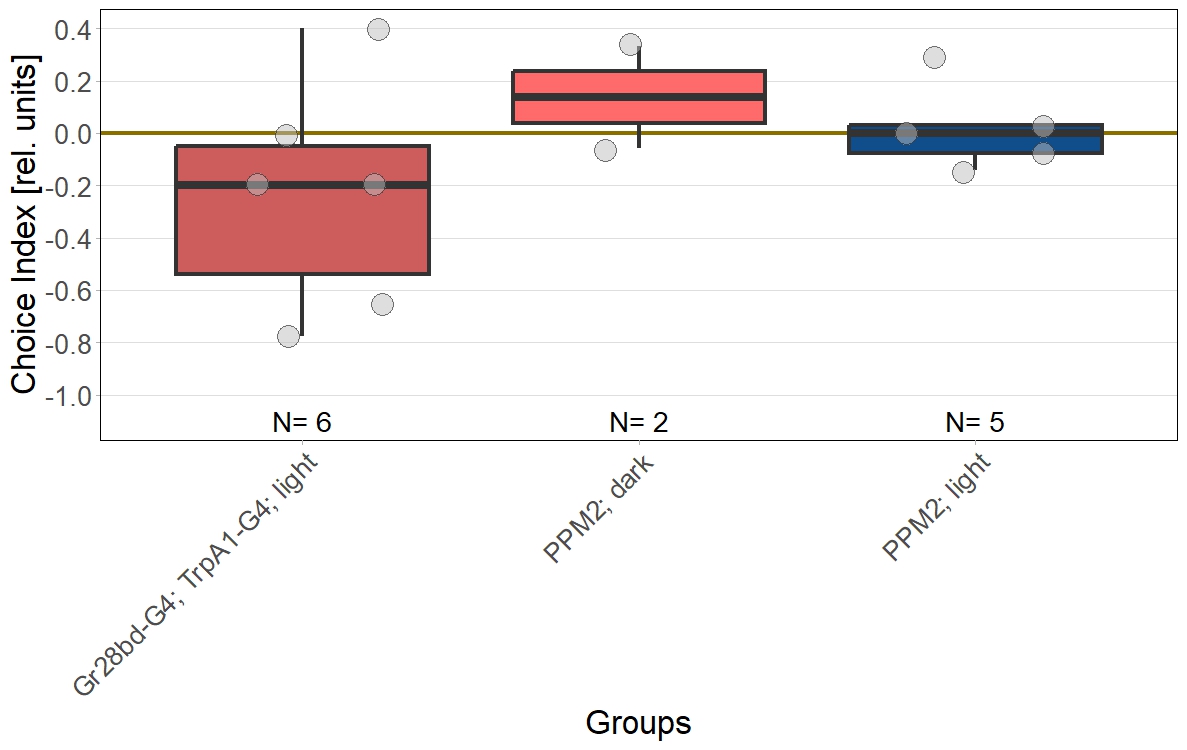
First, the negative control (Gr28bd+SUC+EtOH) … I was hoping that I solved the problem with the avoidance in flies that were not treated with ATR. These flies should not avoid optogenetic stimulation since without the chromophore, there should be no, or at least very weak, activation of the CsChrimson channel. Even if the sample size of 5 is rather low, it is a bit worrying that when these flies were tested for 10 minutes ((Gr28bd+SUC+EtOH (B)), they show avoidance comparable to control flies that were treated with ATR and tested for 1 minute ((Gr28bd+SUC/3IY+ATR (A)).
On the other hand, the experimental groups look pretty good. For now, I was not only able to reproduce results from the first 1 vs. 10 minute T-Maze testing with yellow light, it also seems that 3IY-treated PPM2 flies show the same phenotype as when tested in red light.
For the next few weeks I will have to increase sample sizes, aiming for 30 for each of the experimental groups. I will only include a few control groups treated with ATR, as the effect size here seems to allow for a lower N. Presumably, I will include more untreated control flies, to see whether the avoidance will persist or if the current results simply arise from the low sample size.
Update 28/11/25
Proceeding with T-Maze experiments
After pausing T-Maze experiments because of the issues with my negative control, I should now be abled to proceed.
Since it’s been a bit more than 2 months since the last results, this was the state of the experiments back then:
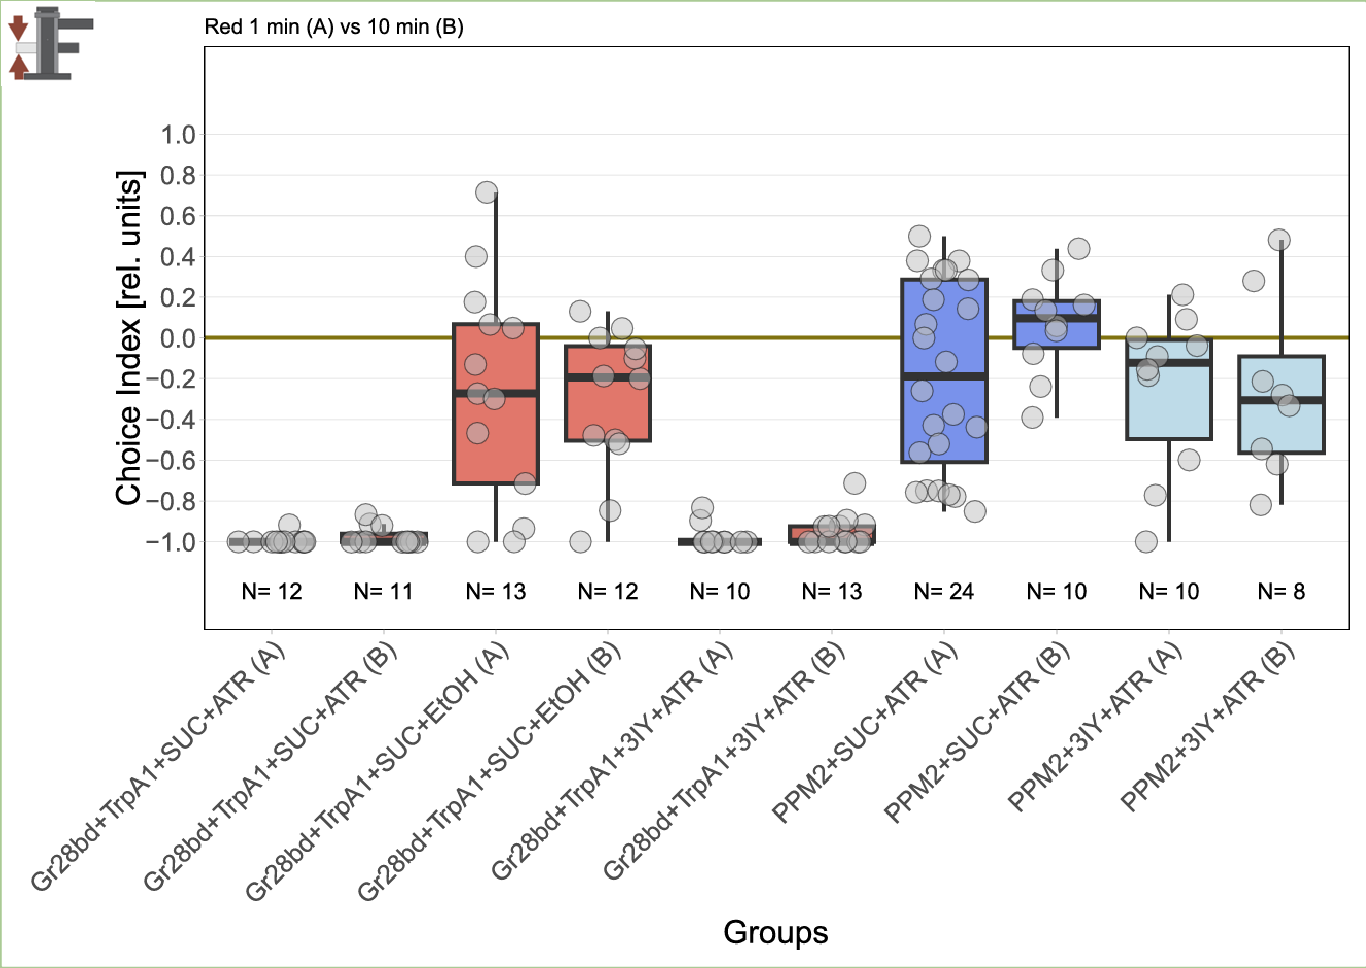
Now I added the following results:
Leading to an updated version of all results:
