Recurrence quantitative analysis
on Monday, October 30th, 2017 11:43 | by Christian Rohrsen
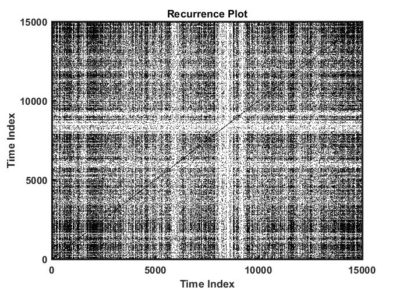
This is an example of a recurrence plot analysis. In the first graph is shown in single point in time in the optimal embedding dimension and the distance to the other points. For the recurrence plot analysis it is needed to put a threshold to make it binary. This is the second graph. From this second graph one can count many parameters like determinism, laminarity and so on. From what I see, the plots from the Strokelitude as well as Bjoern´s flight simulator in Maye et al 2007 show similar pattern (kind of crosses with vertical and horizontal lines).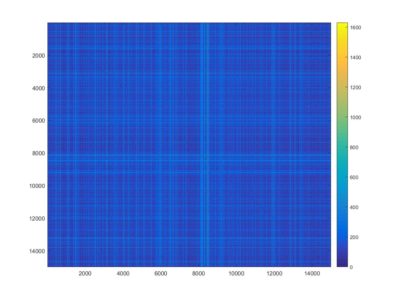
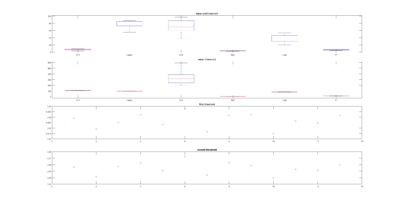
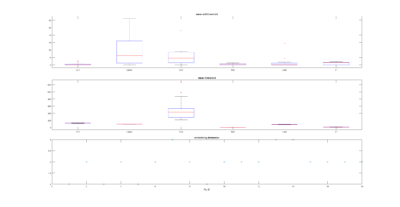
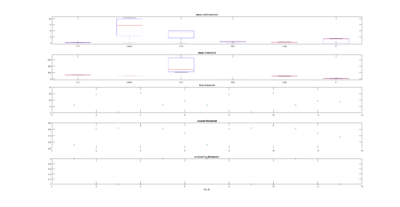
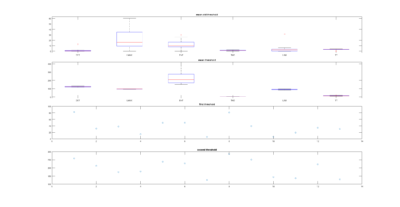
This is a measure of the Recurrence Quantitative Analysis of different groups. Recurrence threshold is a tricky and to some extent subjective measure, so this is why I tried two different ones.
DET: recurrence points that form a diagonal line of minimal length, the more diagonal, the more deterministic.
LMAX: Max diagonal line length or divergence. Sometimes considered as an estimator of max. Lyapunov exponent
ENT: Shannon entropy reflects the complexity of the system
TND: info about stationarity (trend)
LAM: Laminarity is related to laminar phases in the system (intermittency). It is tallied as vertical lines over a threshold.
TT: Trapping time, measuring the average length of vertical lines. Related to laminarity.
Automat
Openloop
Uniform
Category: flight, Spontaneous Behavior, strokelitude, Uncategorized, WingStroke

Leave a Reply