Yellow Joystick Results
on Sunday, September 18th, 2022 6:37 | by Enes Seker
Yellow joystick results of all strains. By Enes, Aslıhan, Vivi.

Category: Optogenetics | No Comments
Comparison of T-maze and Joystick Results
on Sunday, September 18th, 2022 11:26 | by Vivi Samara
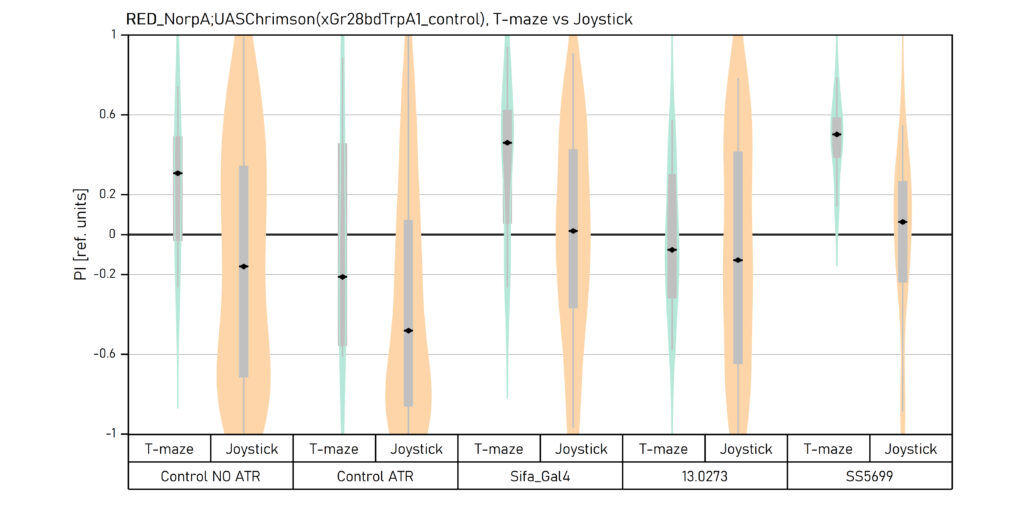
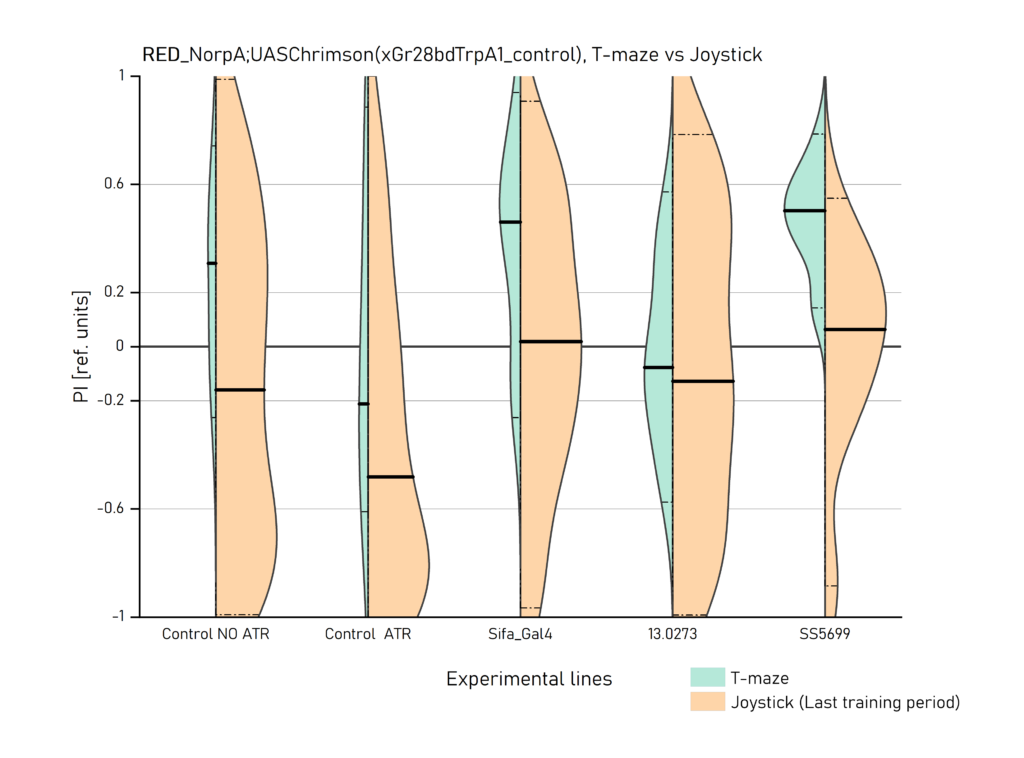
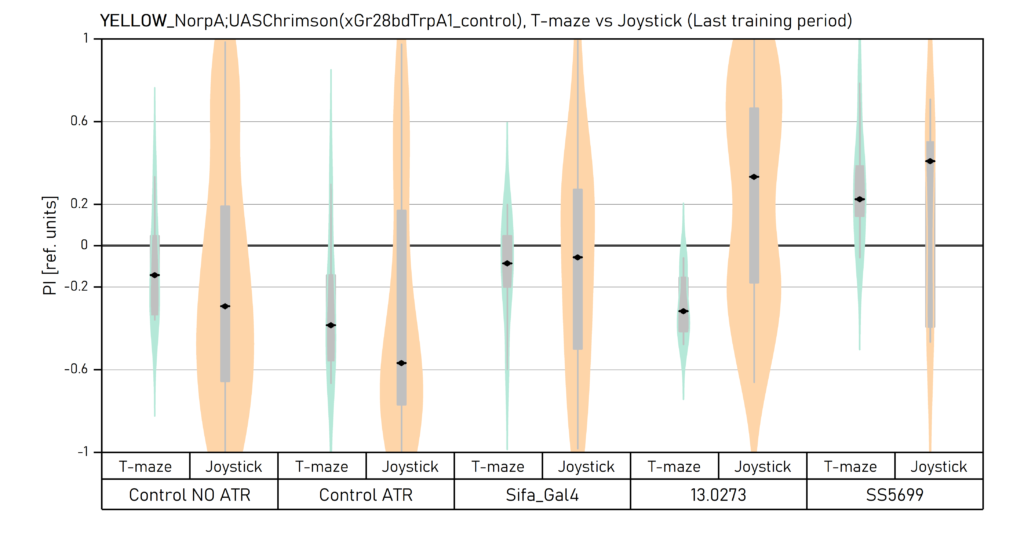
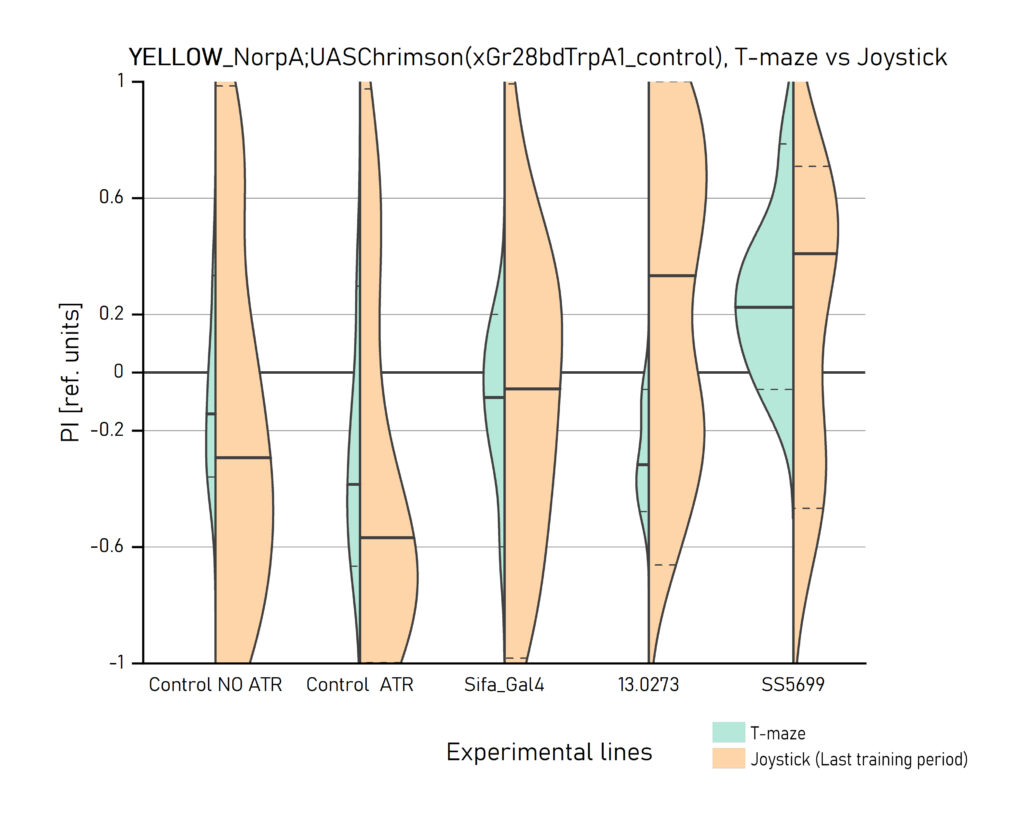
Two different ways of presentation for red and yellow light. With the term Joystick here, the data collected for the last training period of each line are represented. Results obtained from Enes, Aslihan and Vivi.
Category: Optogenetics | No Comments
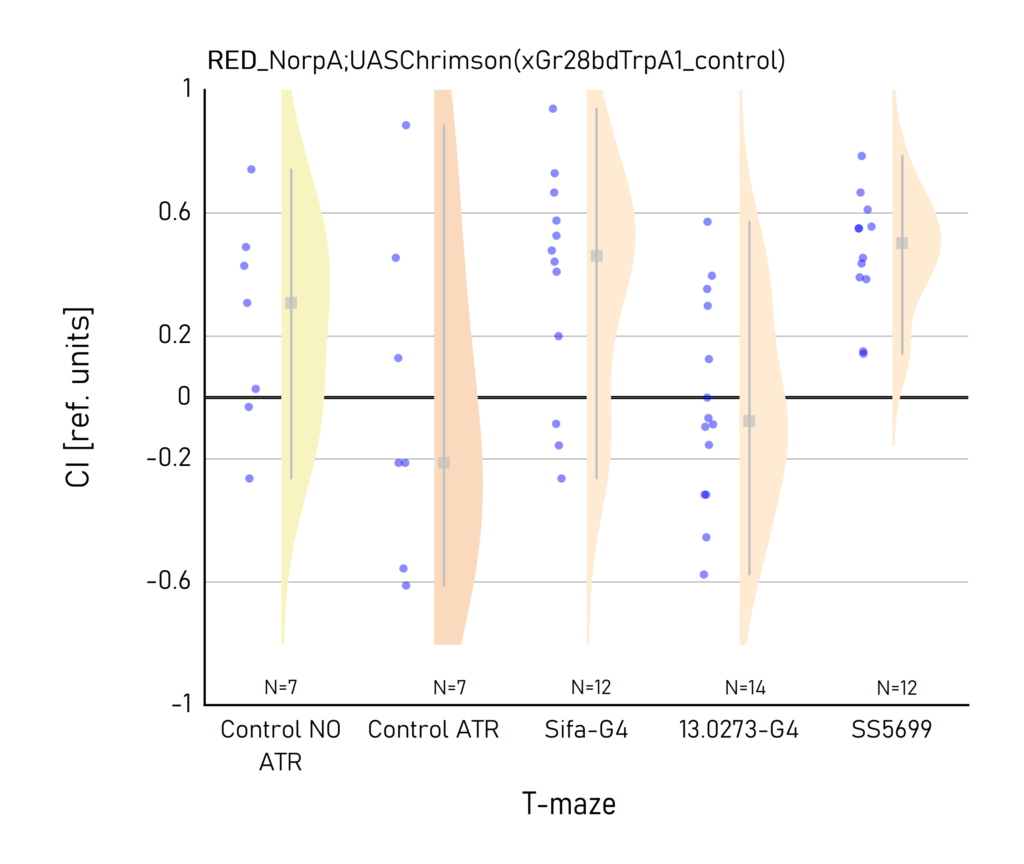
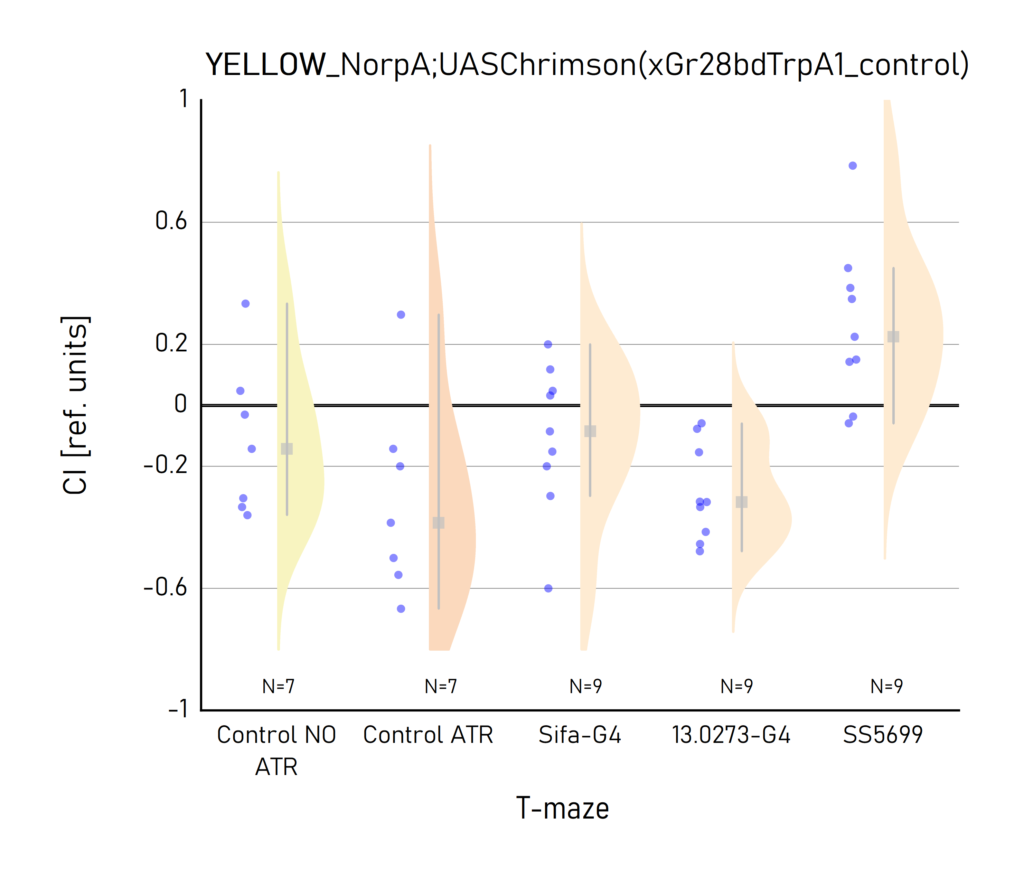
Red and Yellow light T-maze results
on Sunday, September 18th, 2022 10:45 | by Vivi Samara
Category: Optogenetics | No Comments
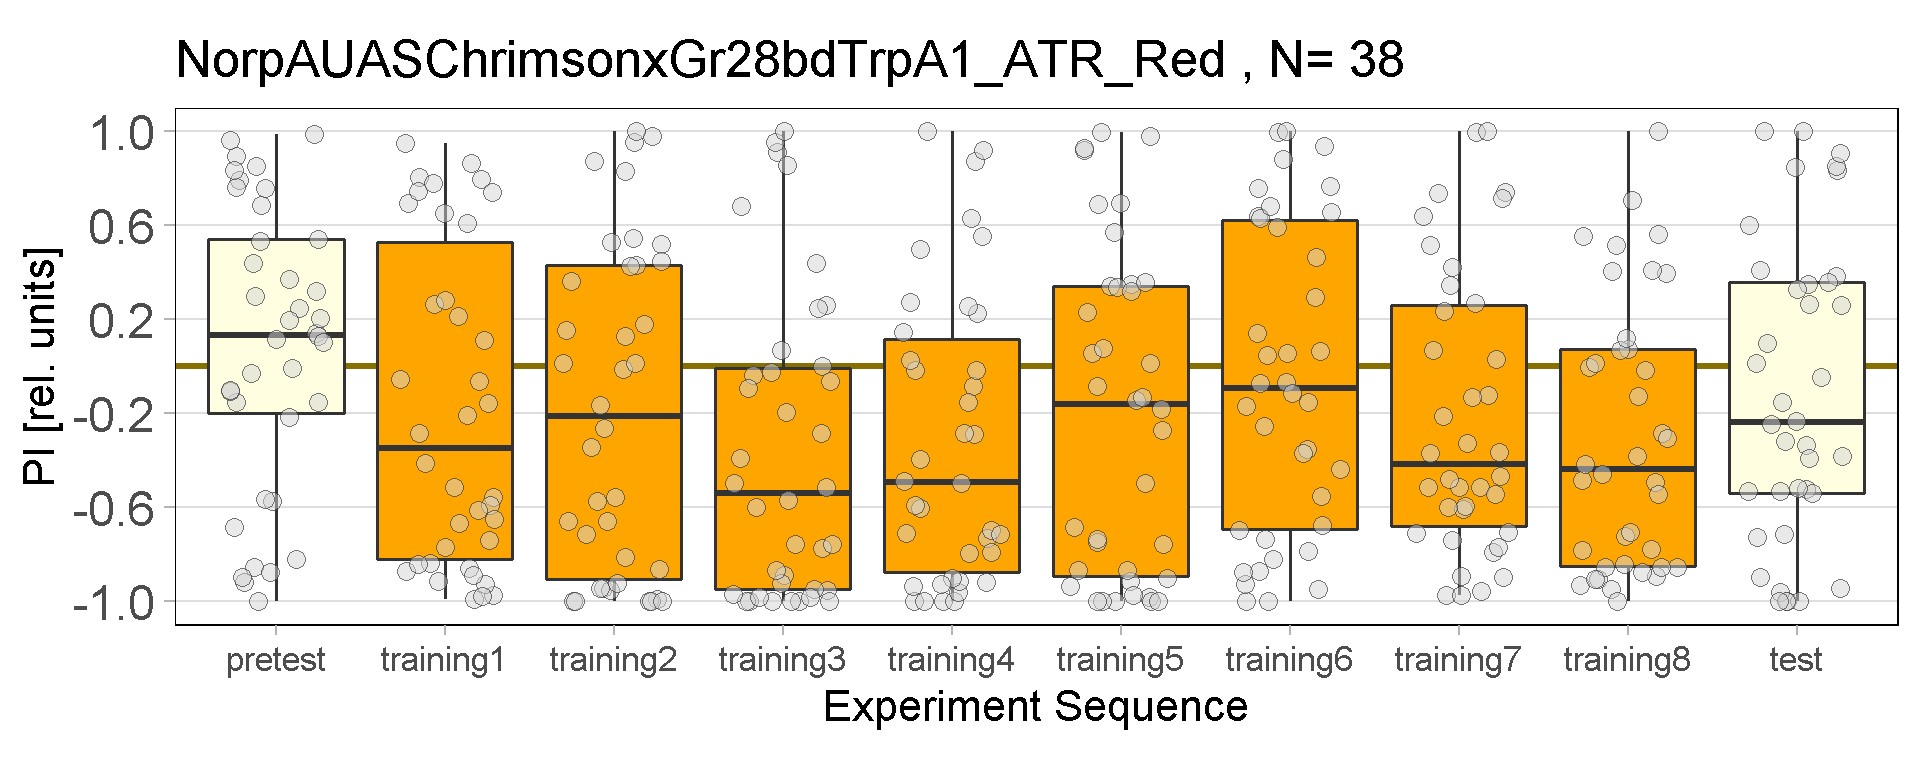
Joystick Red Results of All Strains; Enes Aslıhan Vivi
on Saturday, September 17th, 2022 12:38 | by Enes Seker
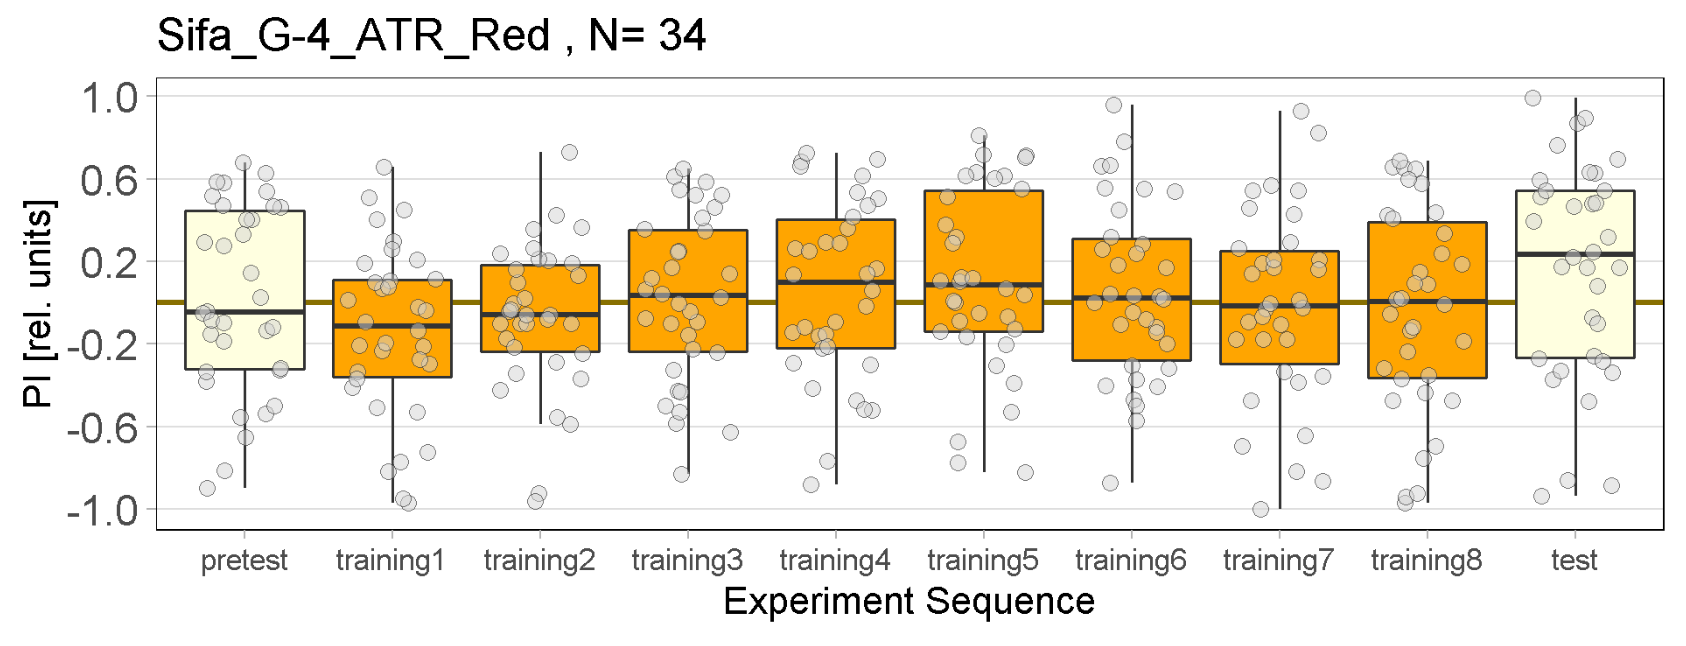

These are results of red joystick experiments of all strains.
Category: Optogenetics | No Comments
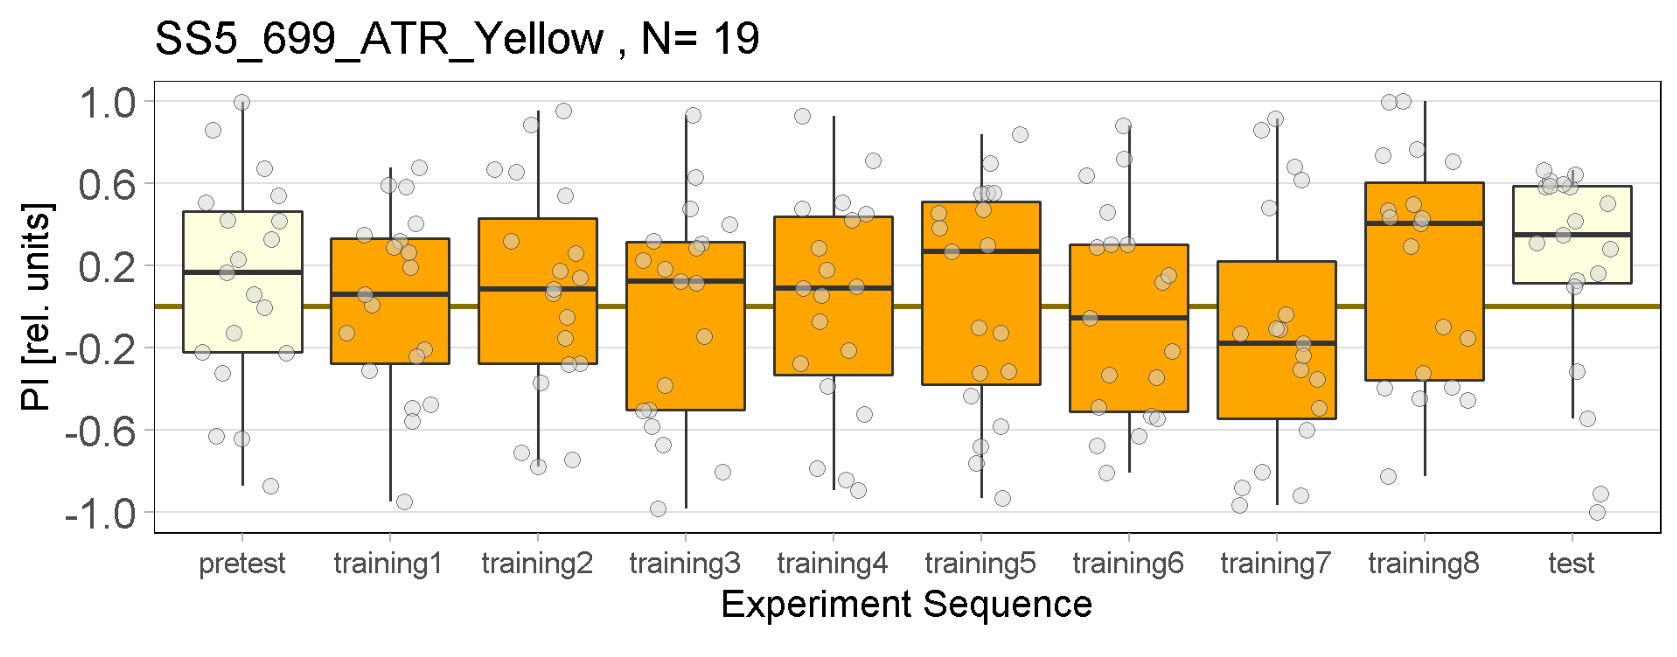
Joystick Yellow Results of All Strains; Enes Aslıhan Vivi
on Friday, September 16th, 2022 11:59 | by Enes Seker
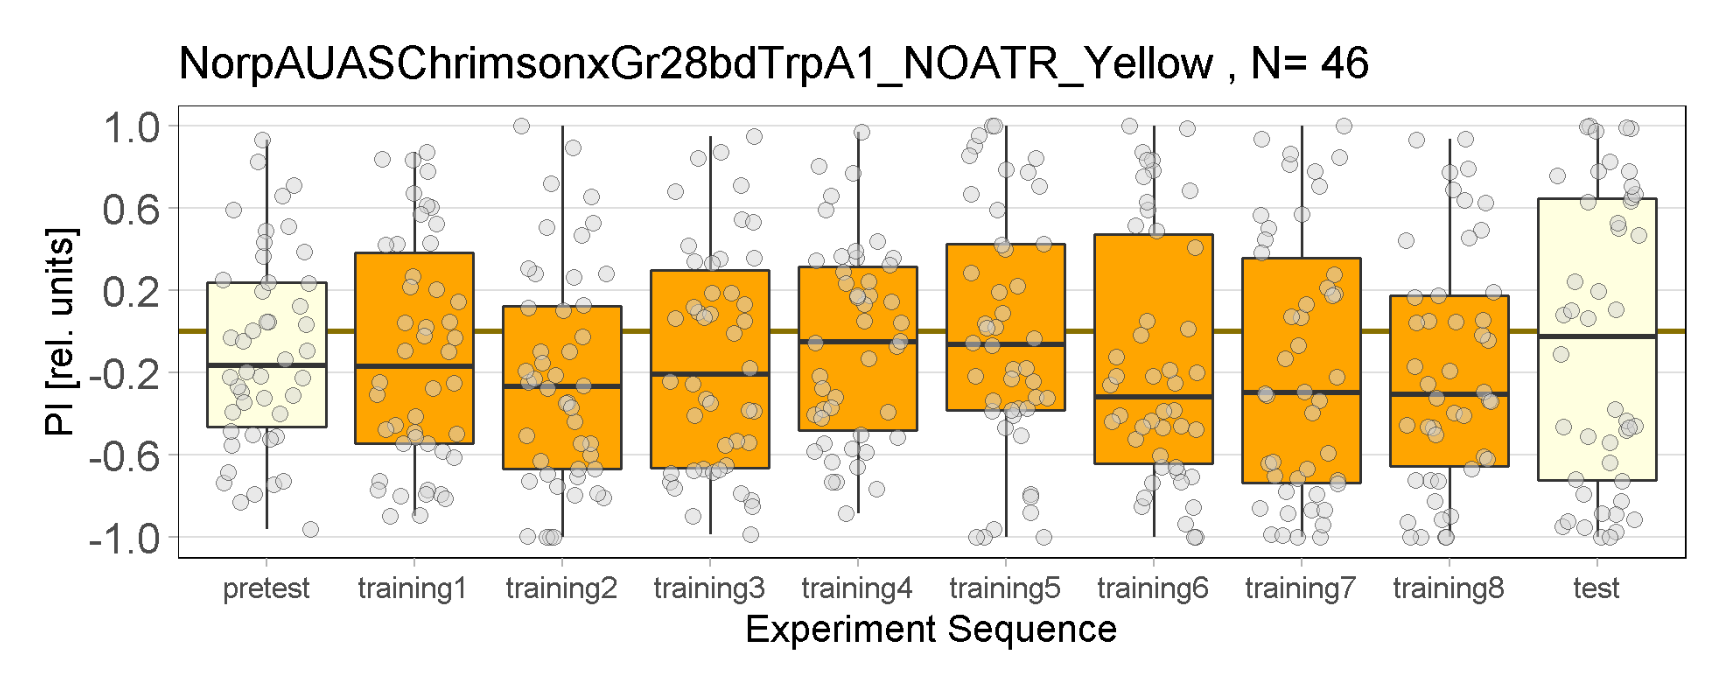

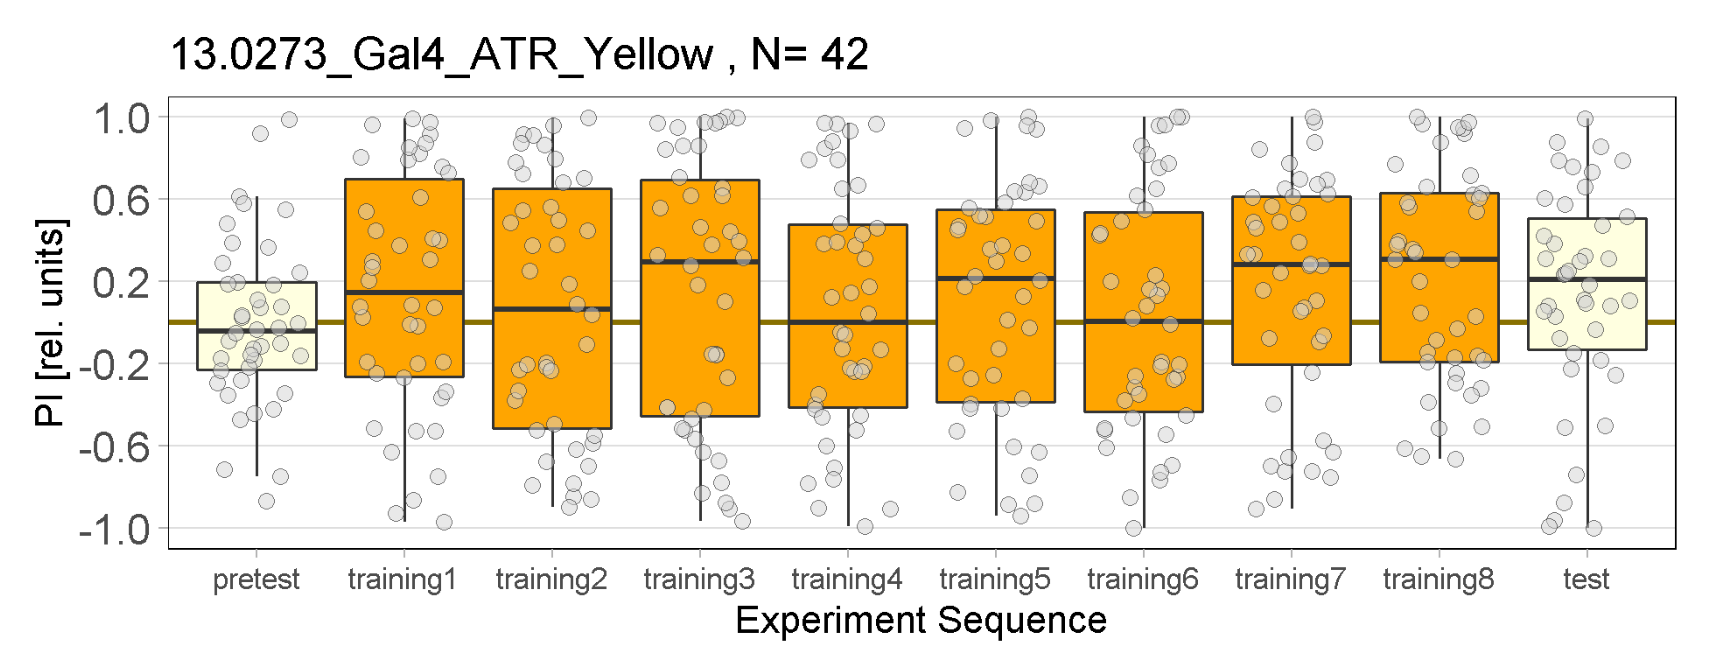
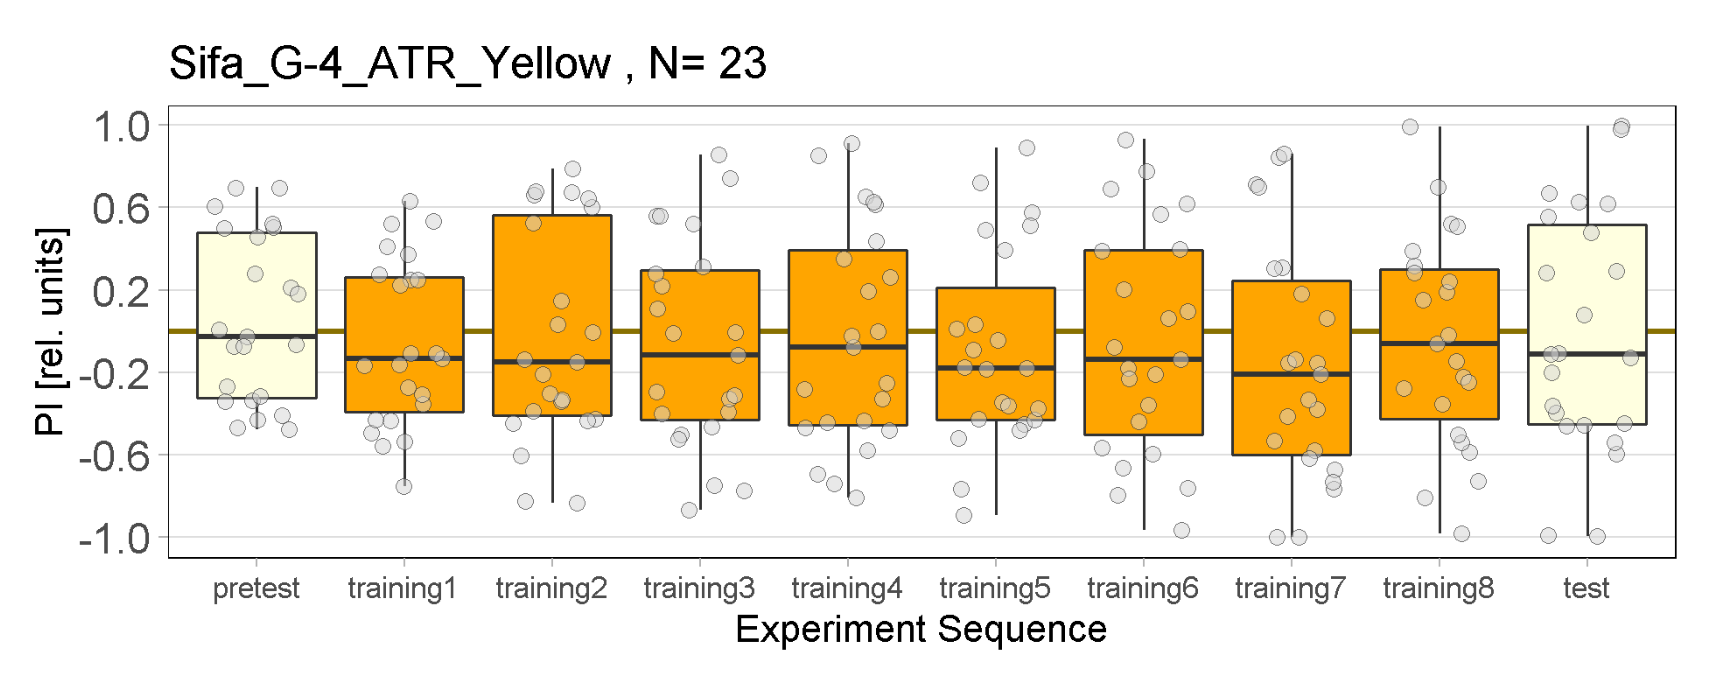
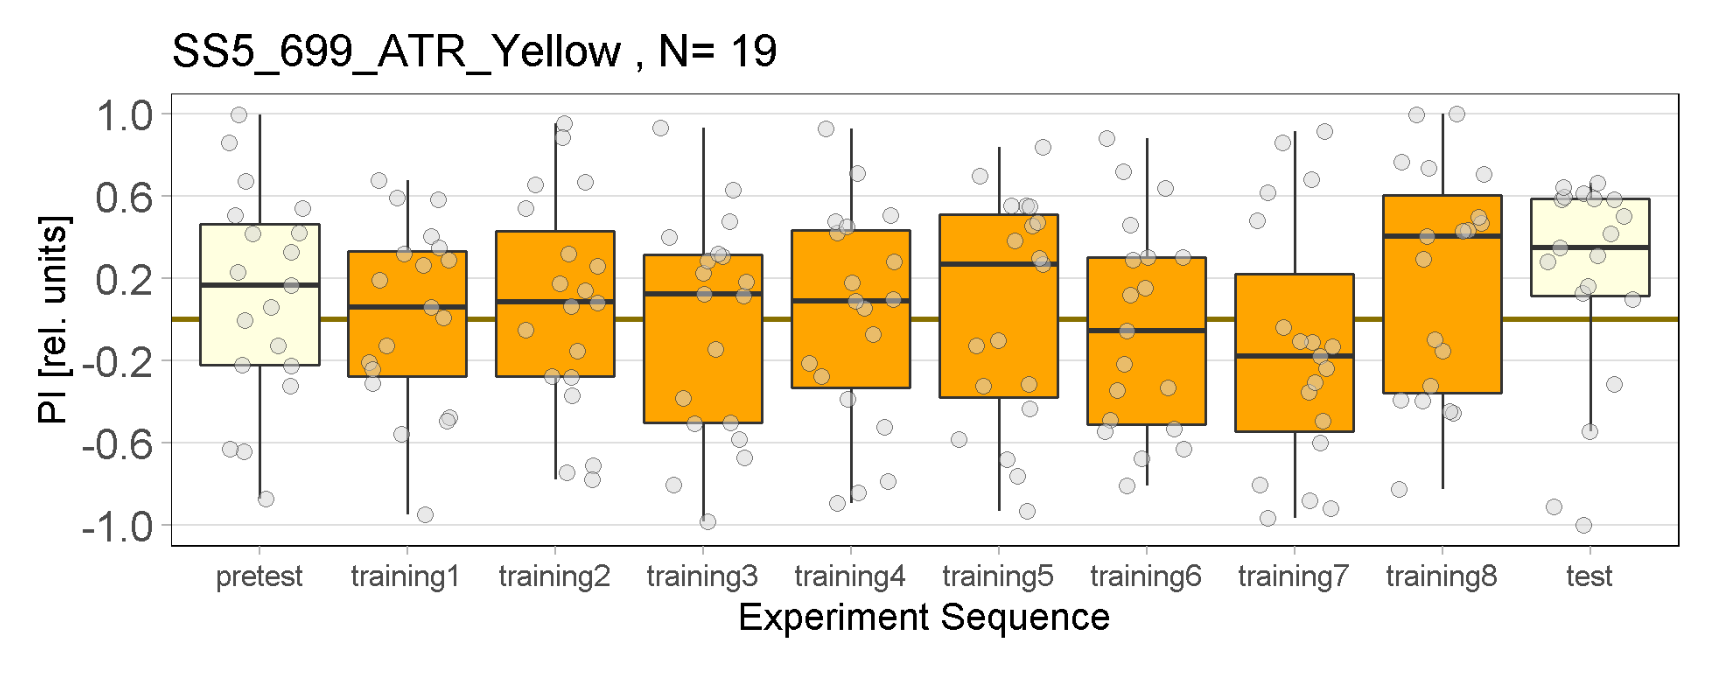
These are results of yellow joysticks experiments of all strains.
Category: Optogenetics | No Comments
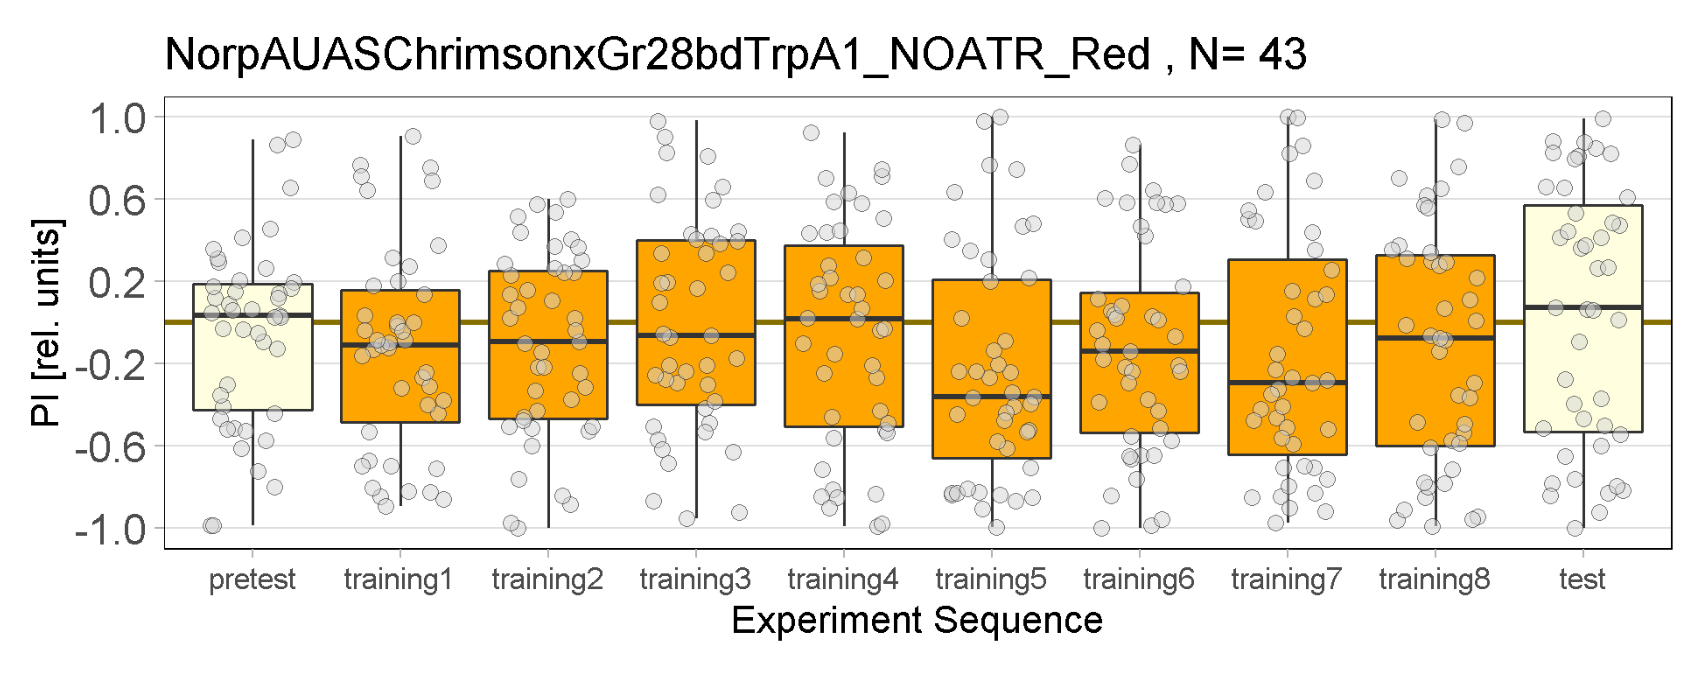
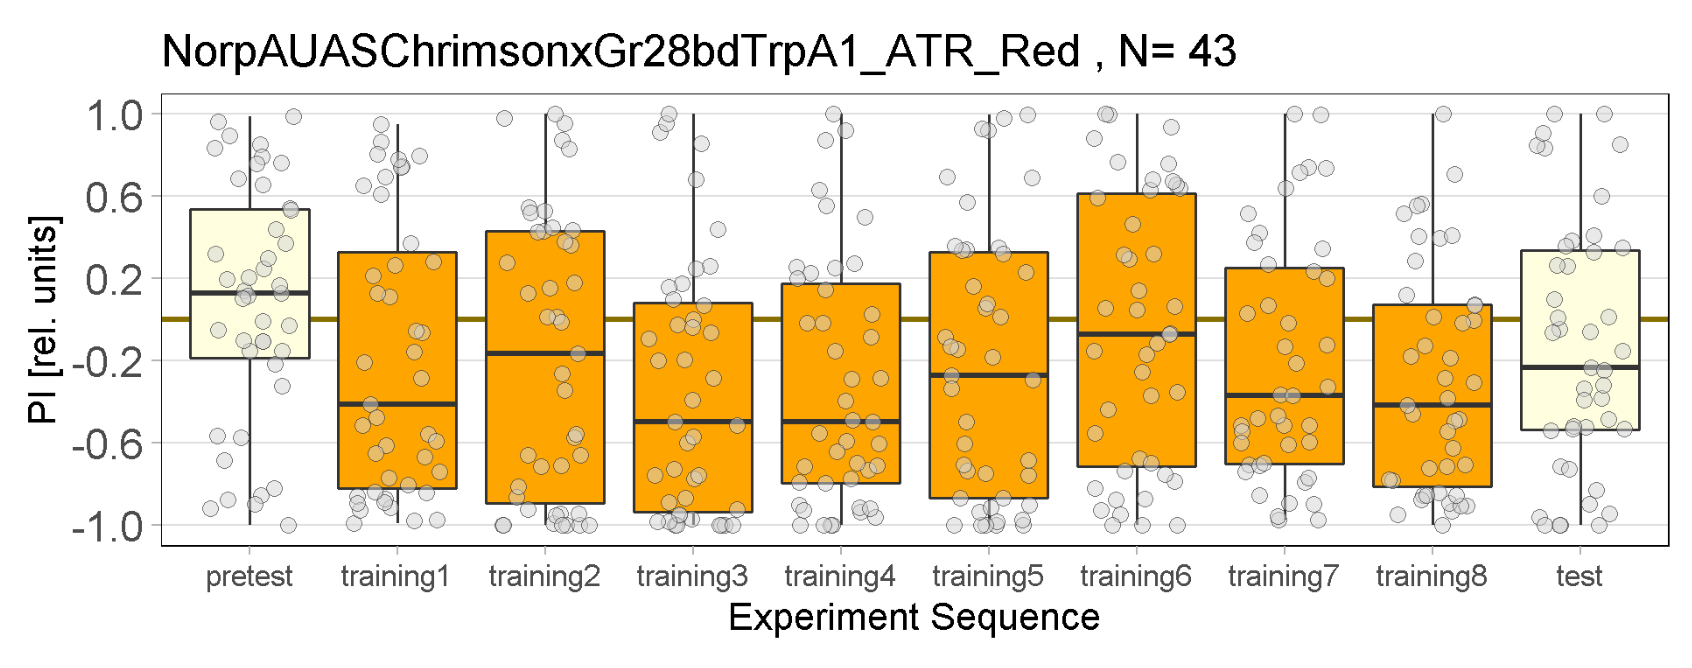
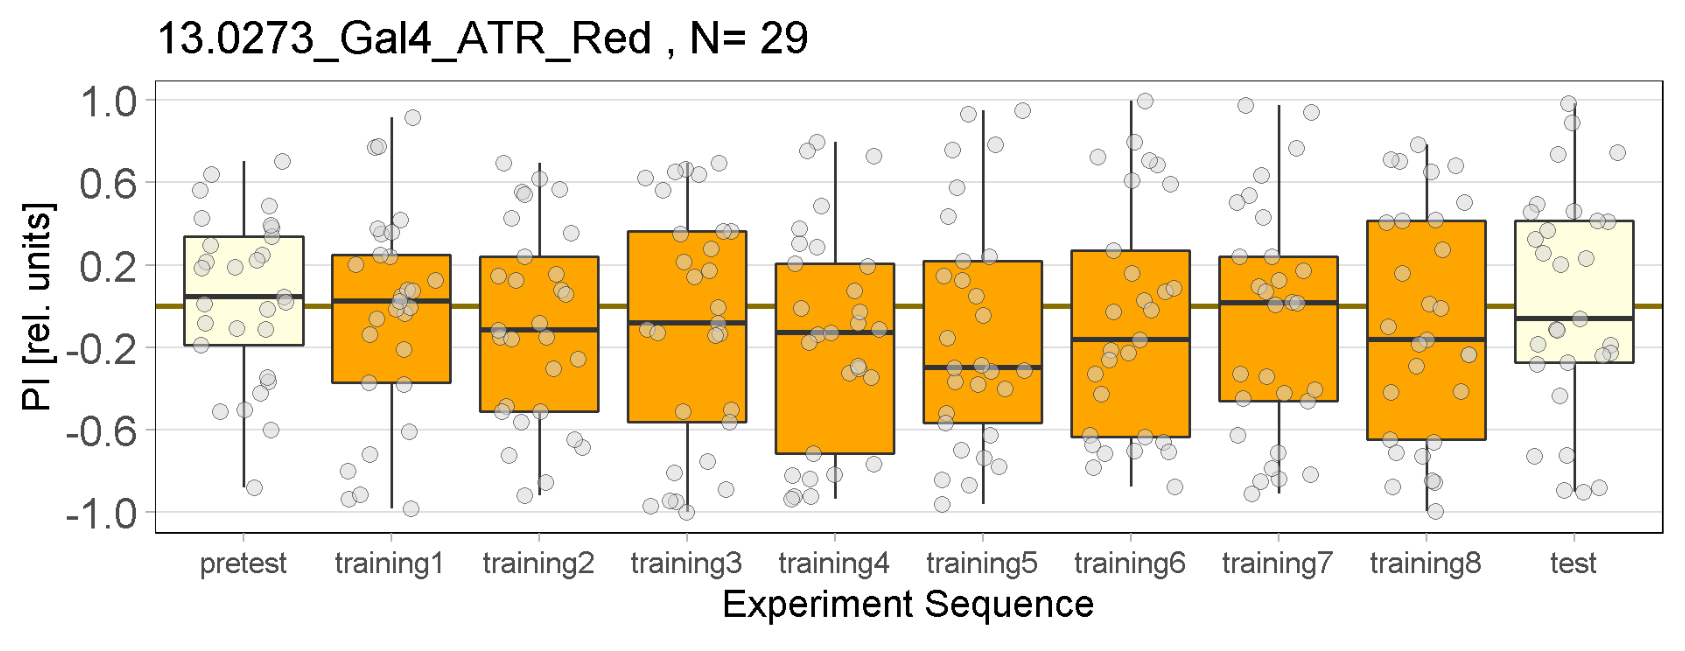
Joystick results of NOATR, ATR Control and 13.0273, SS5699 for RED light Enes Aslıhan Vivi
on Wednesday, September 14th, 2022 11:15 | by Enes Seker
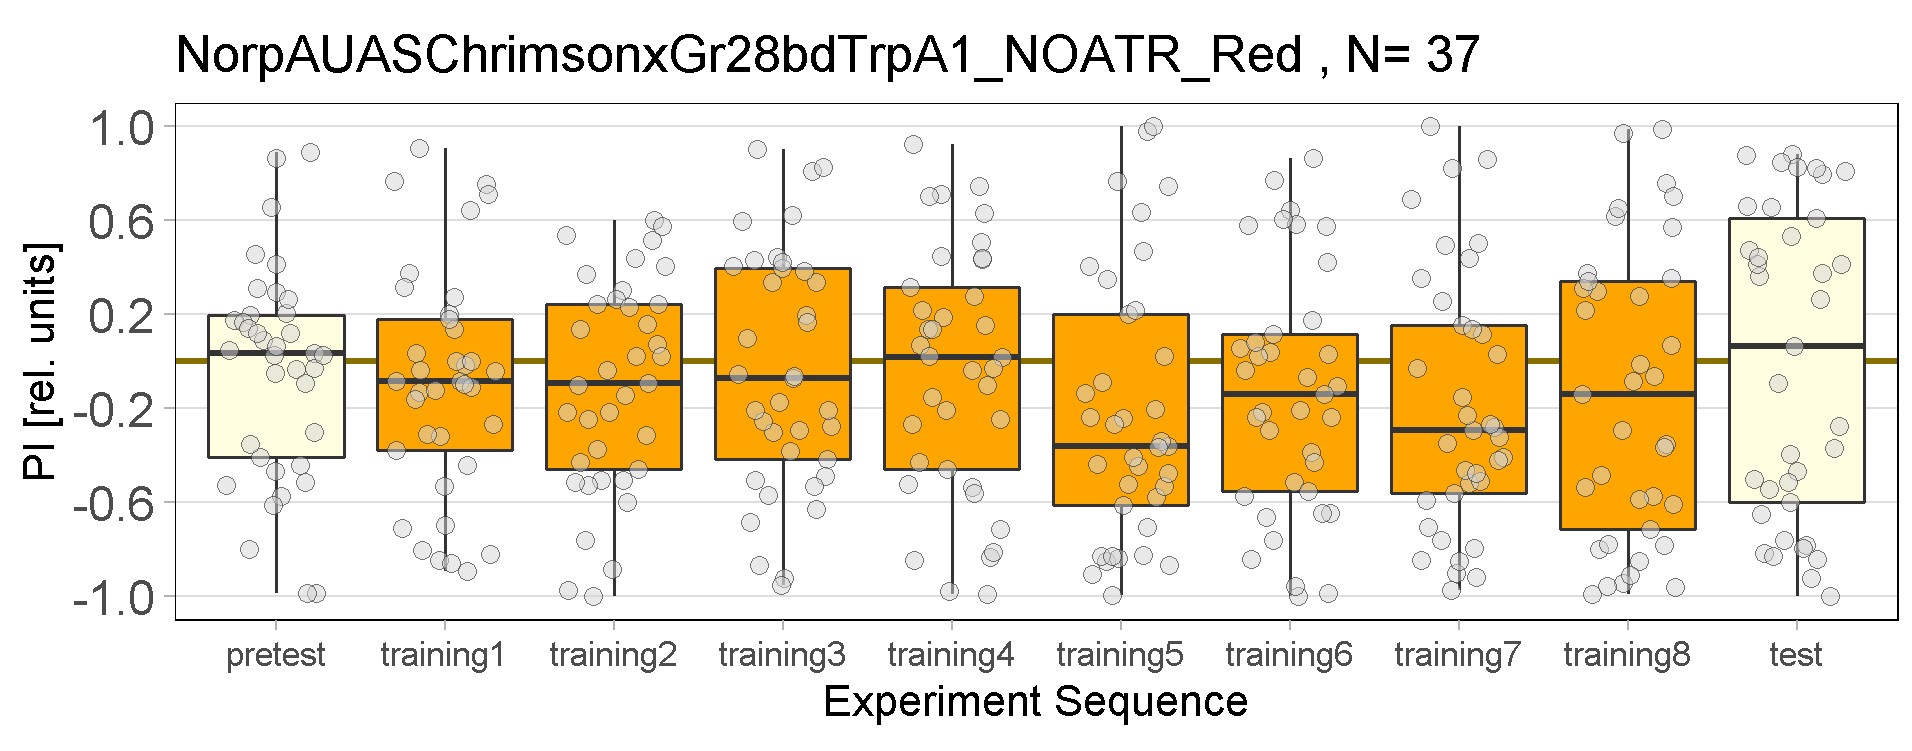
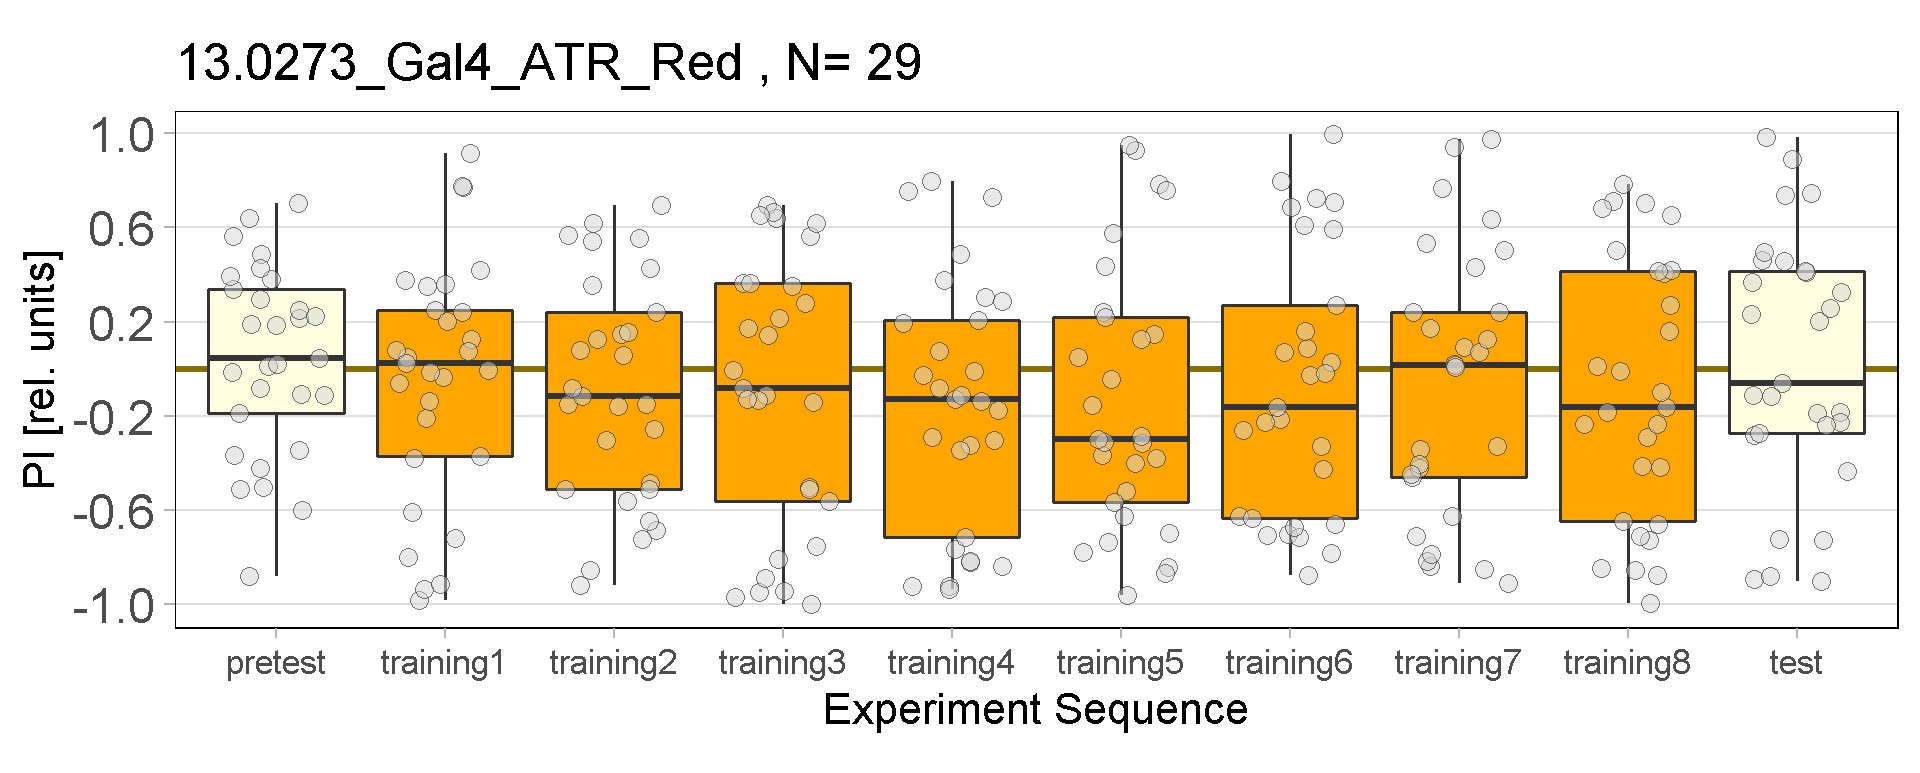
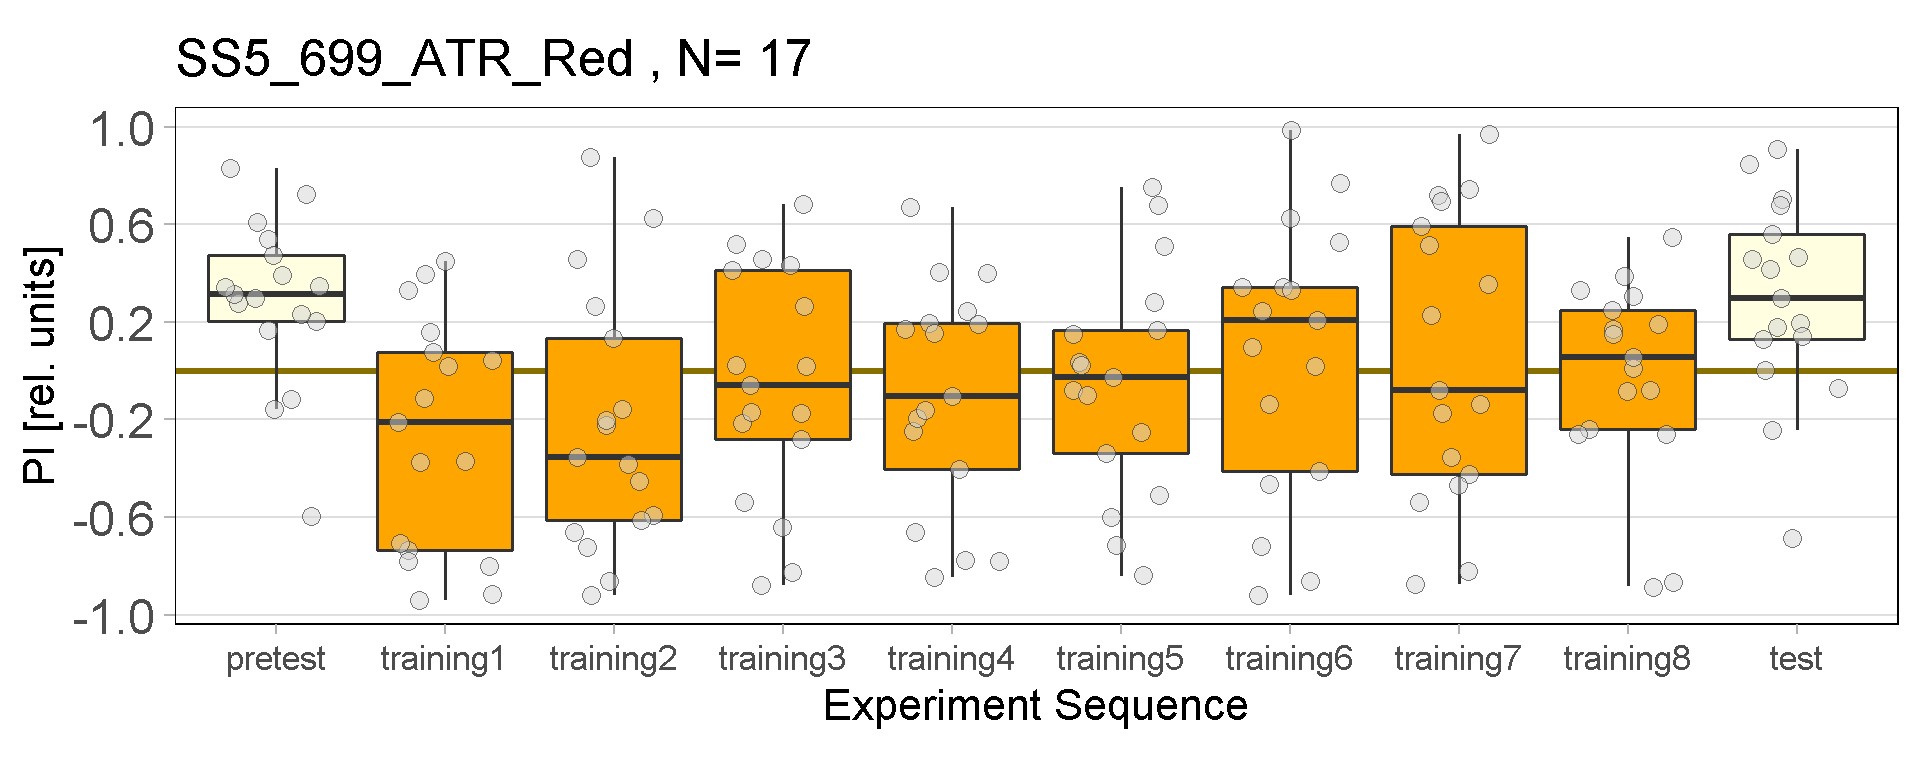
Joystick results of NOATR, ATR Control and ATR 013.0273, ATR SS5699 for RED light.
Category: Optogenetics | No Comments
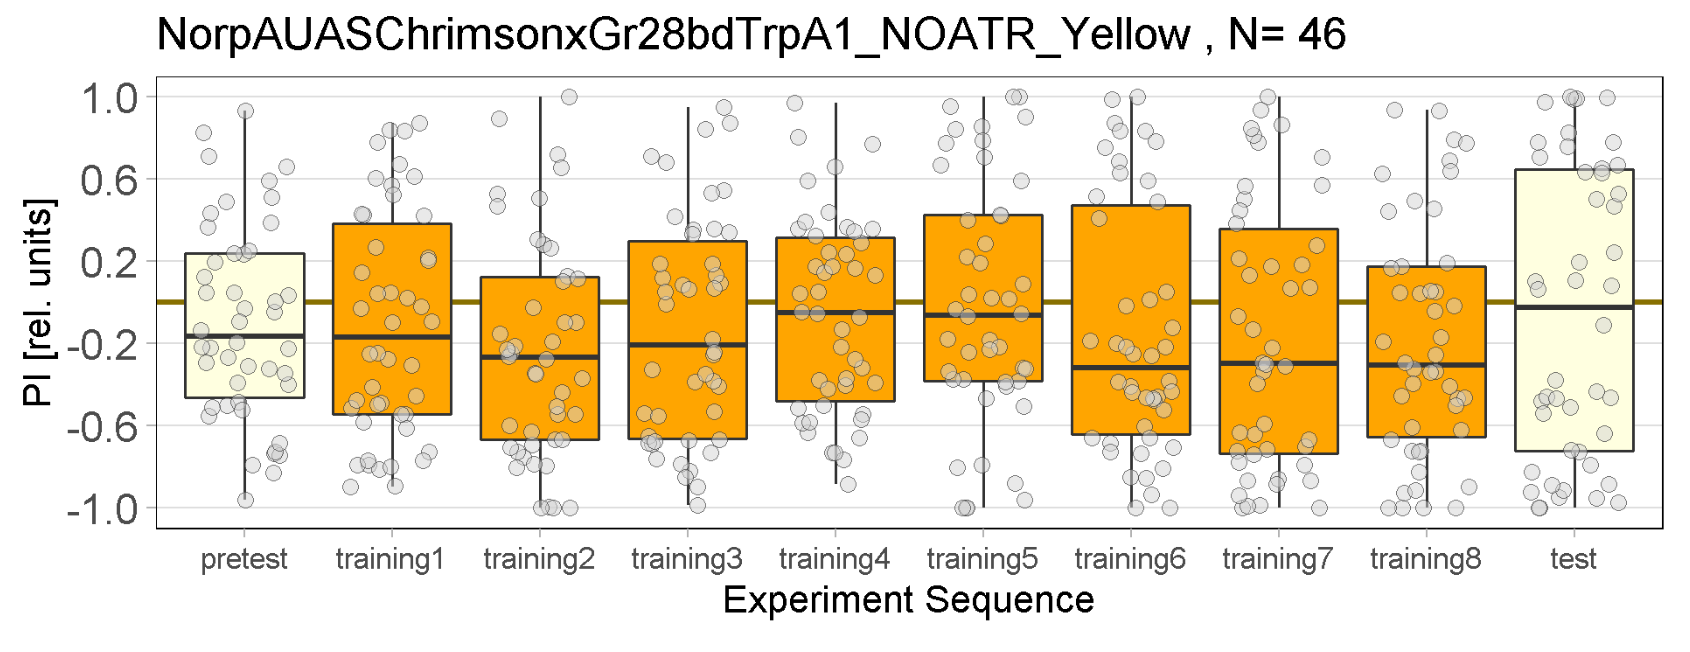
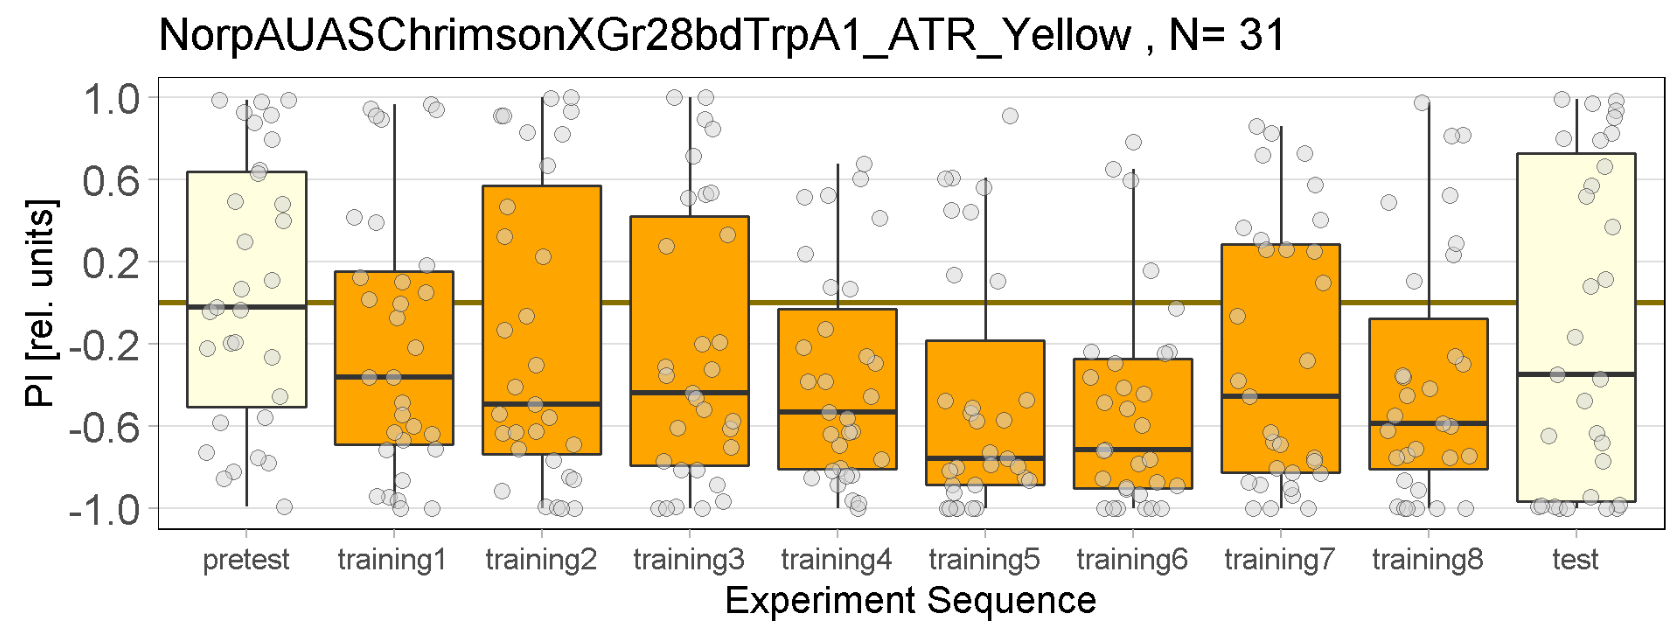
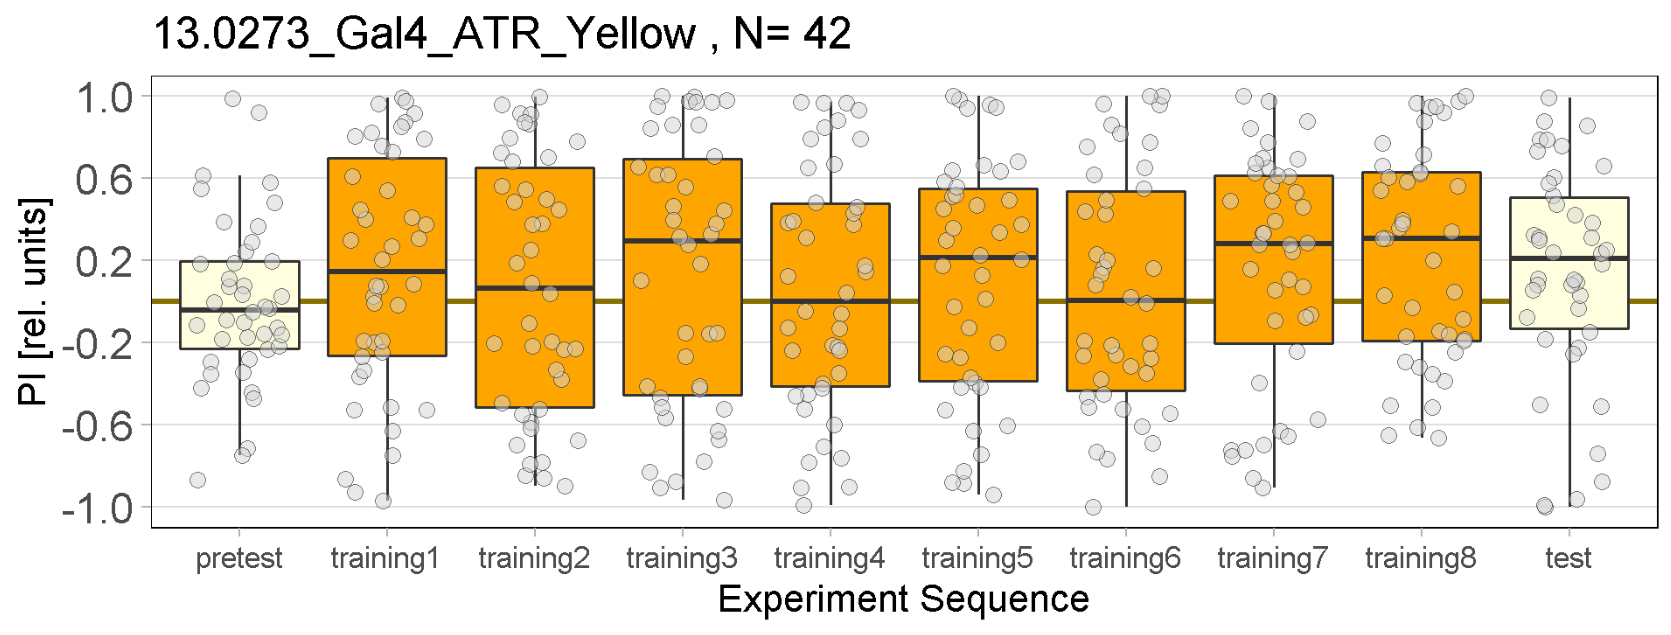
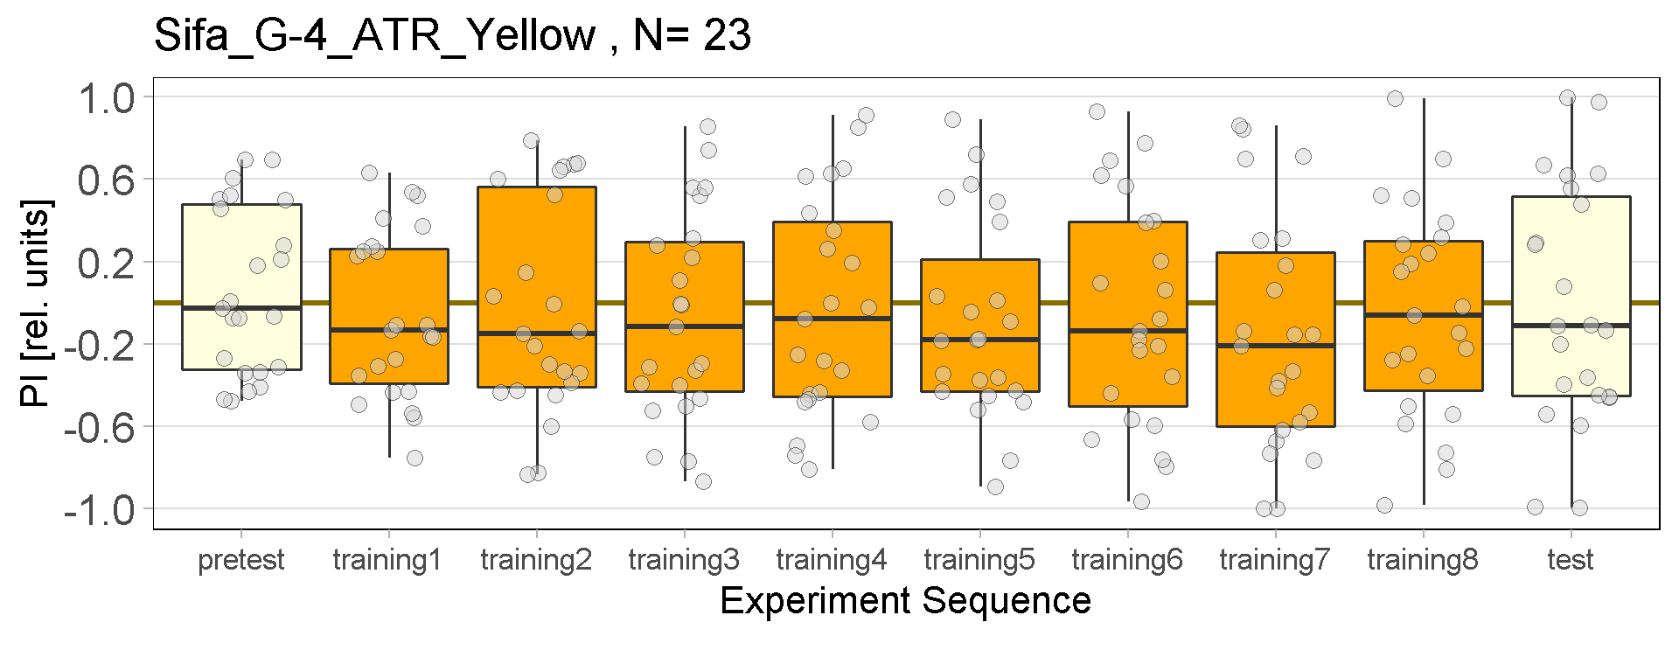
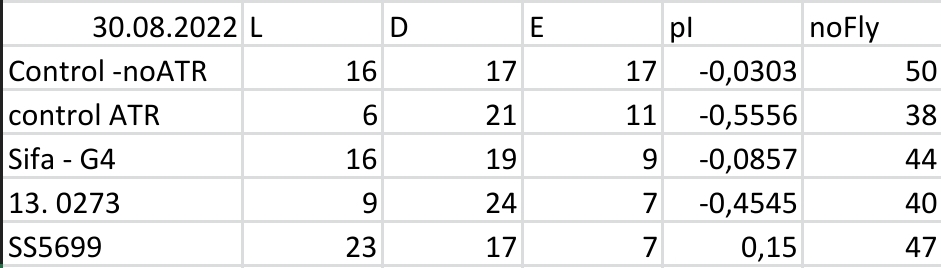
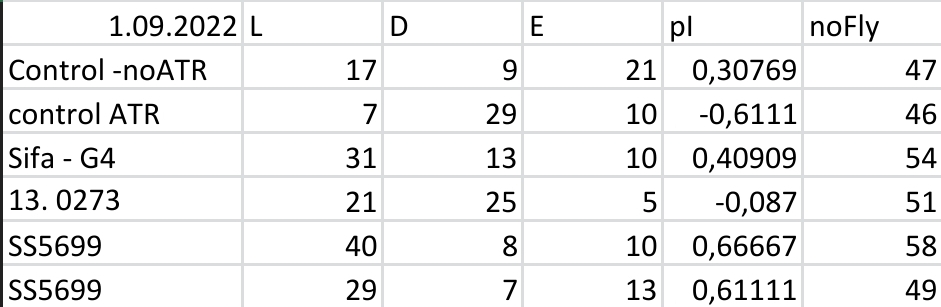
Joystick results of ATR, NOATR Control, 13,1273, Sifa for Yellow Light by Enes, Aslıhan, Vivi
on Monday, September 12th, 2022 11:40 | by Enes Seker
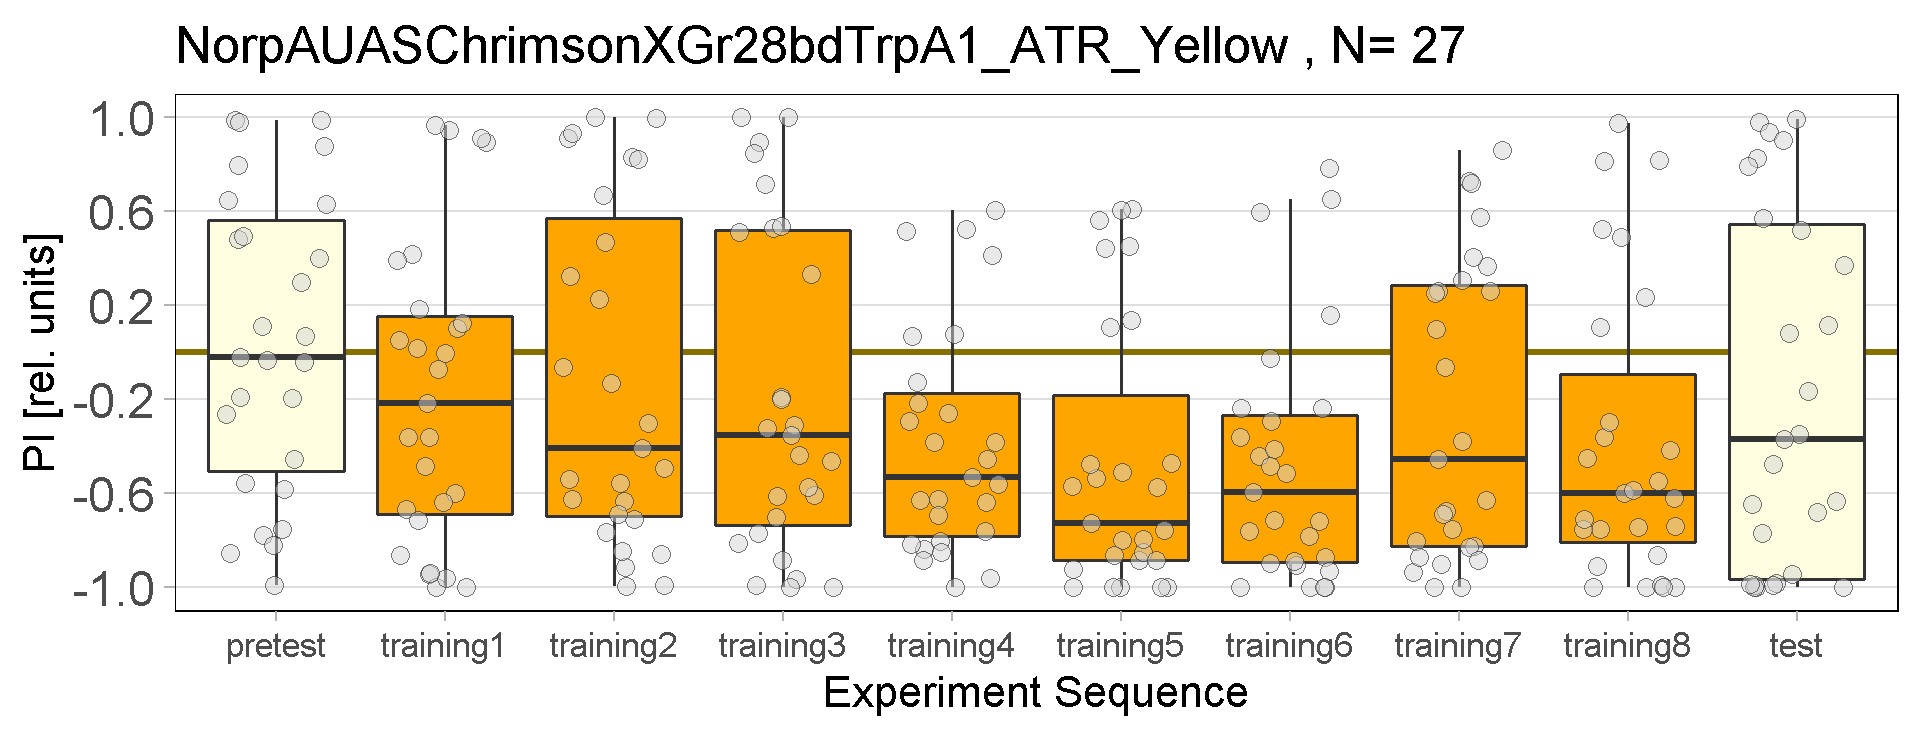
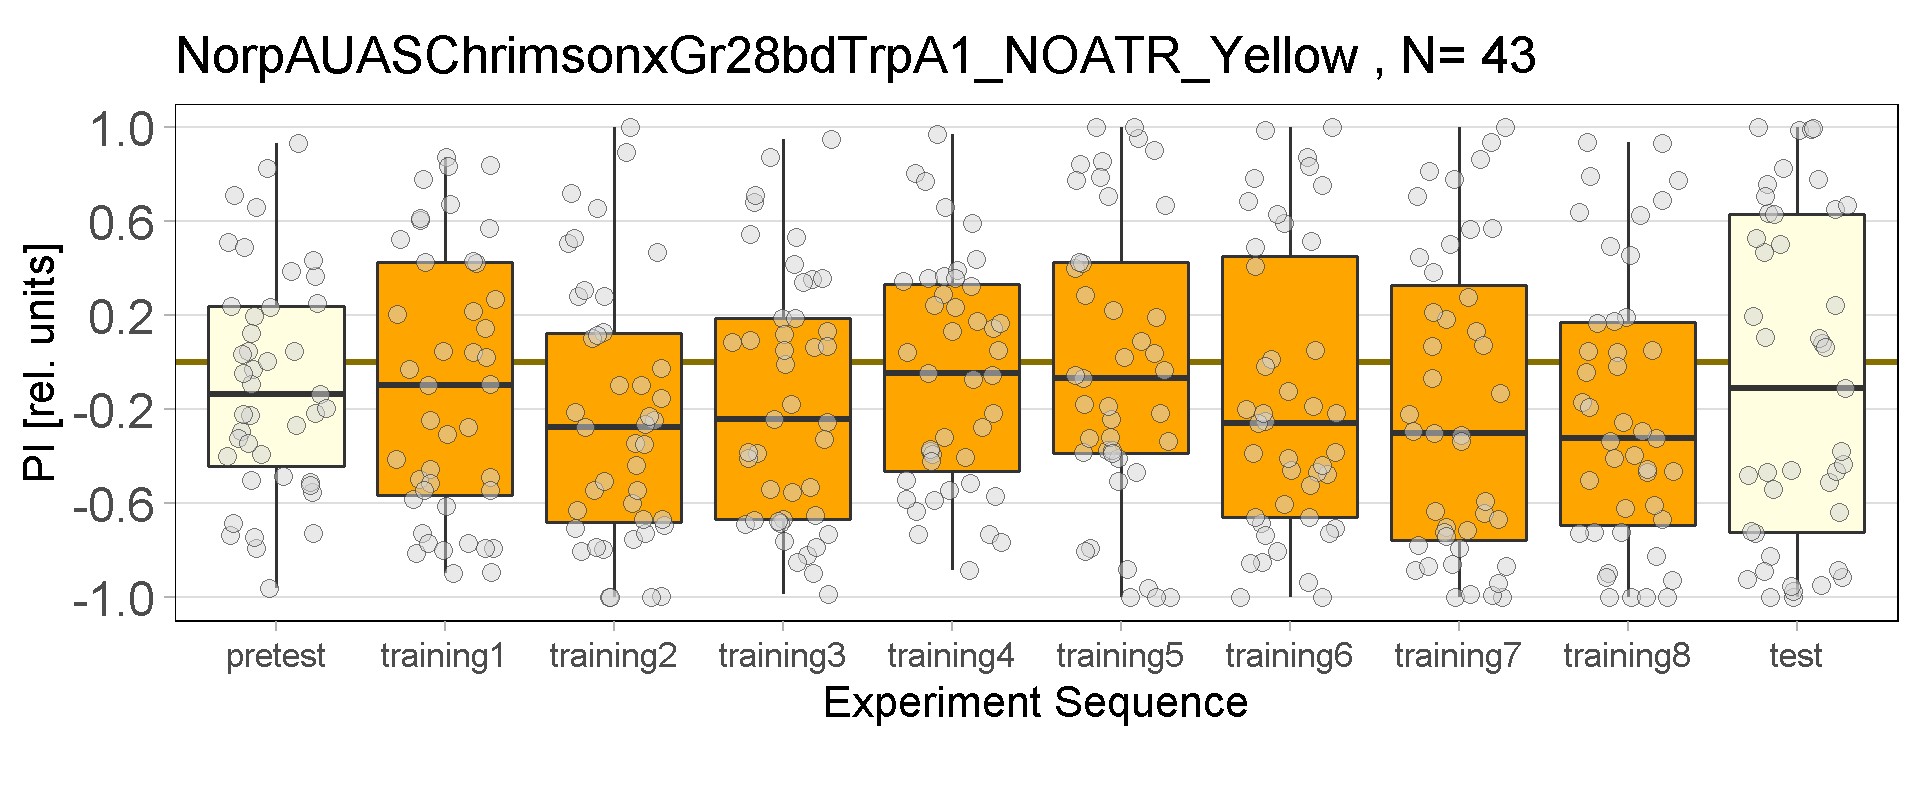
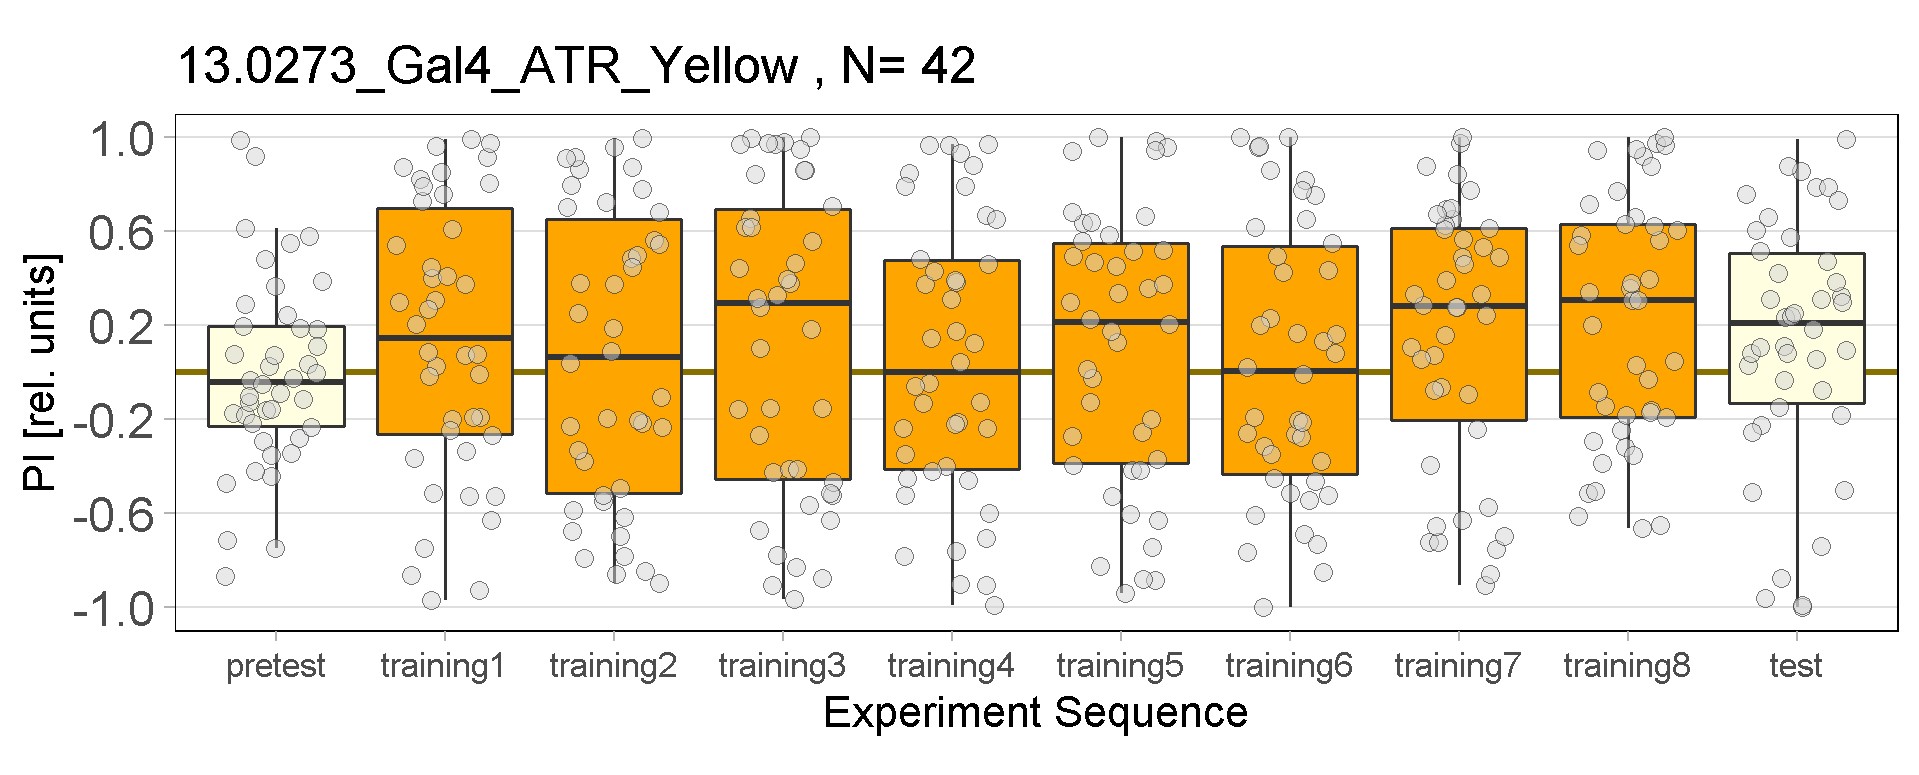
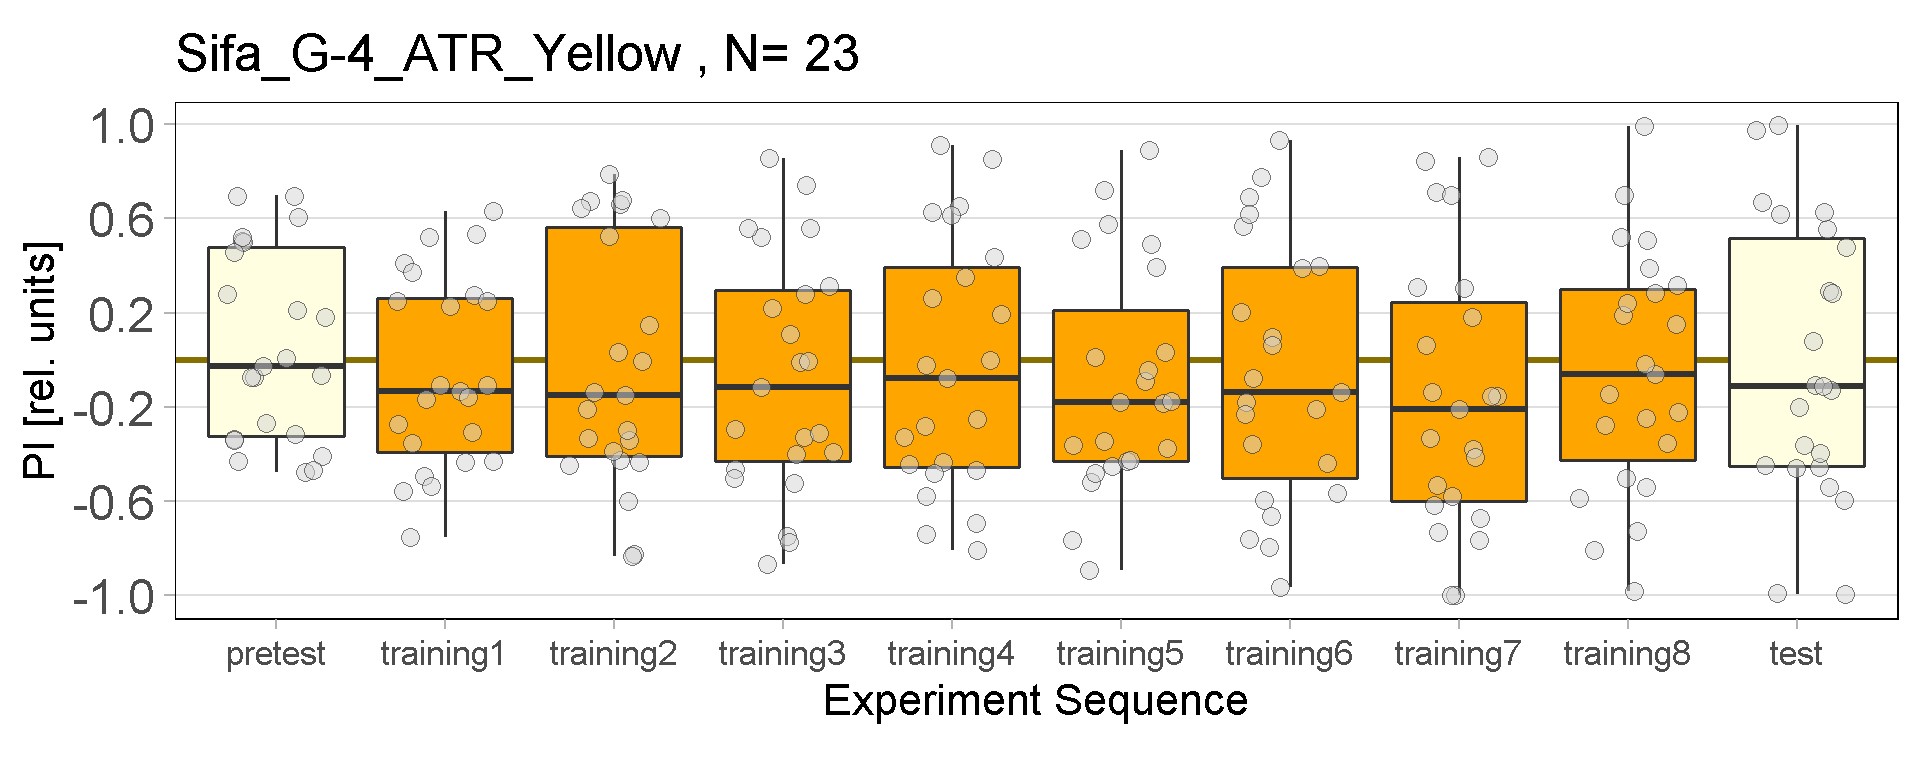
Joystick results of ATR, NOATR Control, 13,1273, Sifa for Yellow Light by Enes, Aslıhan, Vivi. Yellow light NOATR Control and 13.0273 experiments reached to the maximum but they will continue.
Category: Optogenetics | No Comments
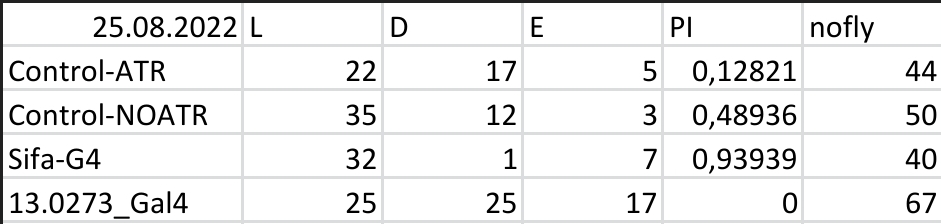
Red and Yellow light T-maze results
on Saturday, September 10th, 2022 12:13 | by Vivi Samara
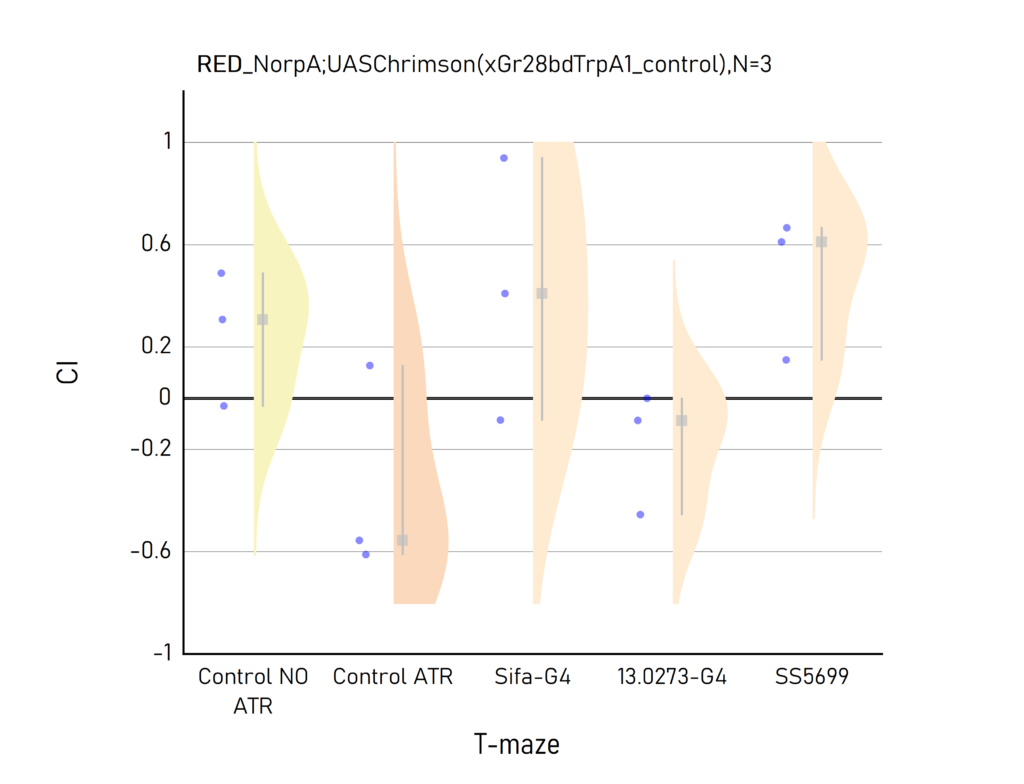

Plots created from the results of Aslıhan. CI: Choice index of preference towards the lit (1) or dark (-1) arm. Population of approximately 50 flies per dot.
Category: Optogenetics | No Comments
Enes Aslıhan joystick results of ATR and NOATR Control and ATR 13.0273 Gal-4 for red light
on Wednesday, September 7th, 2022 10:59 | by Enes Seker
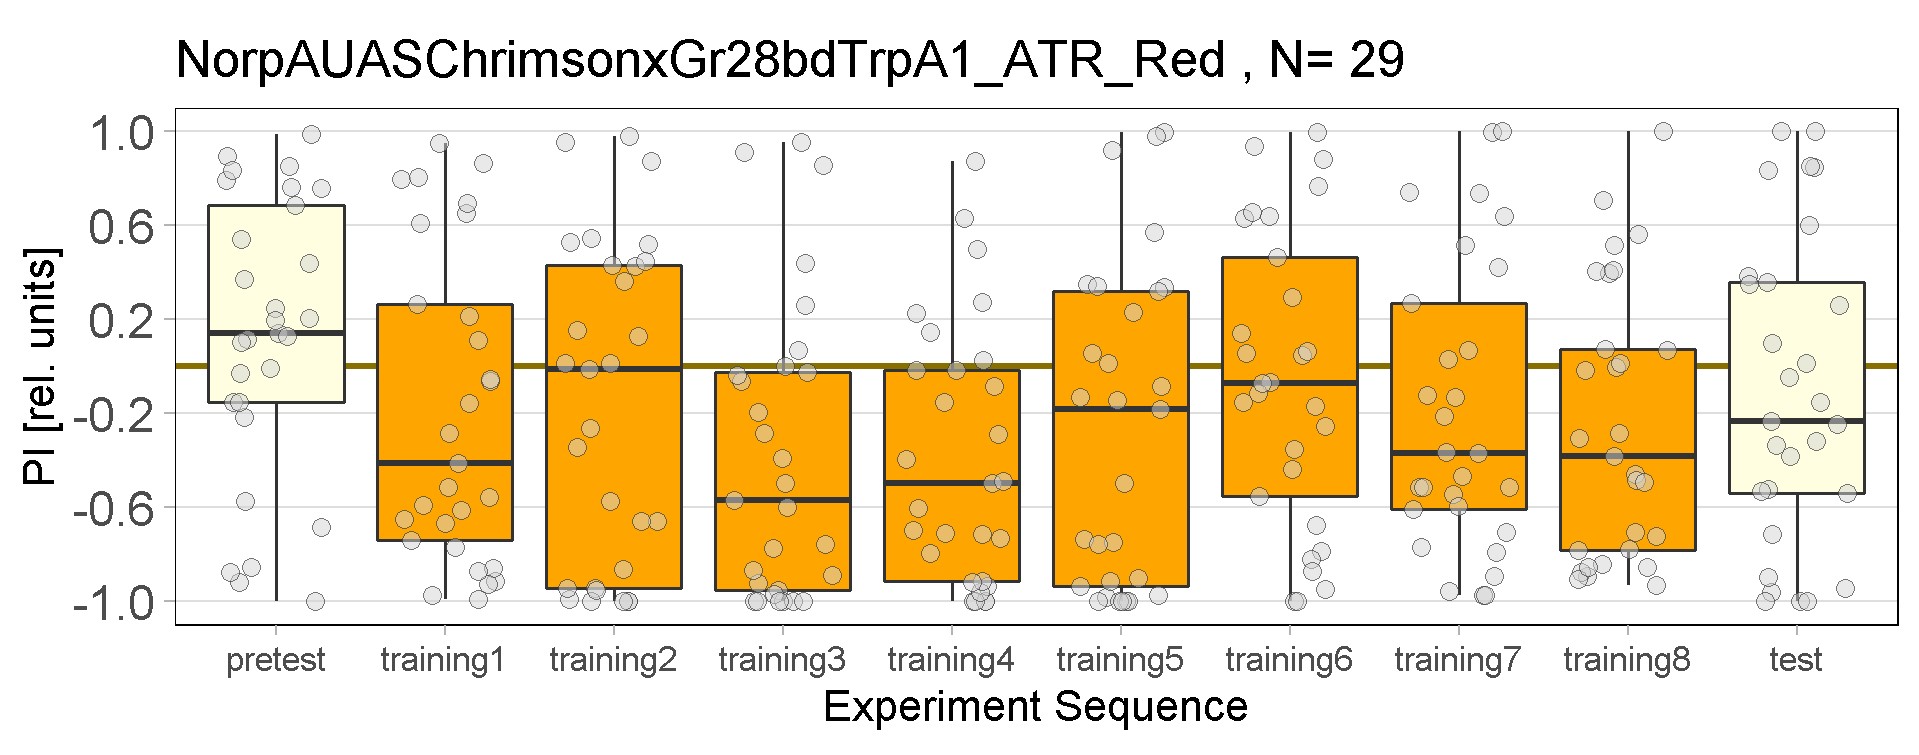
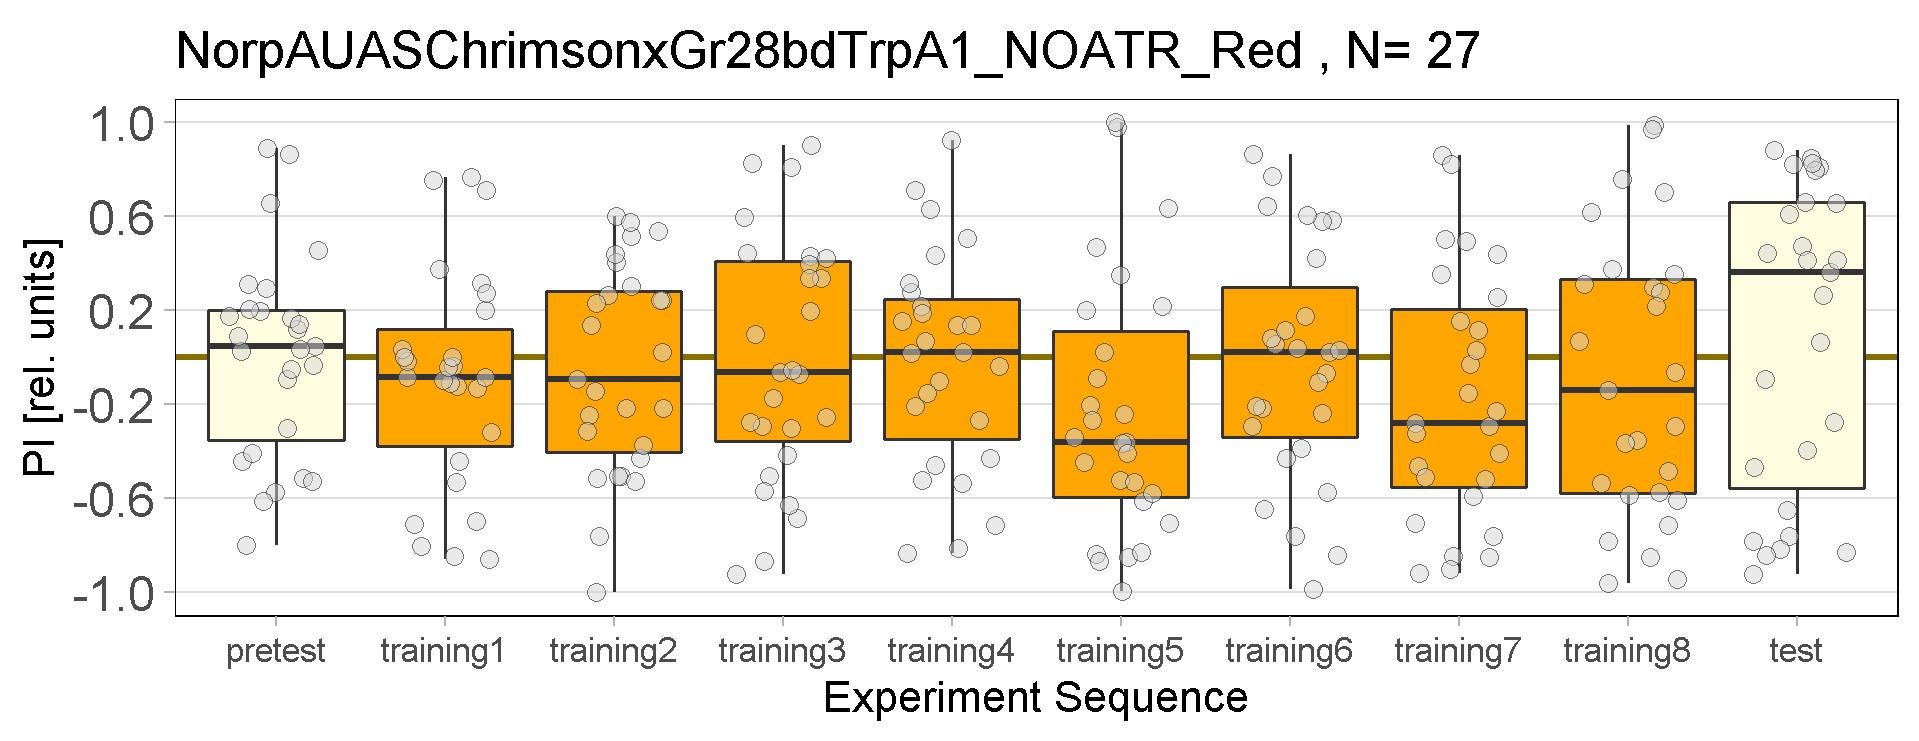
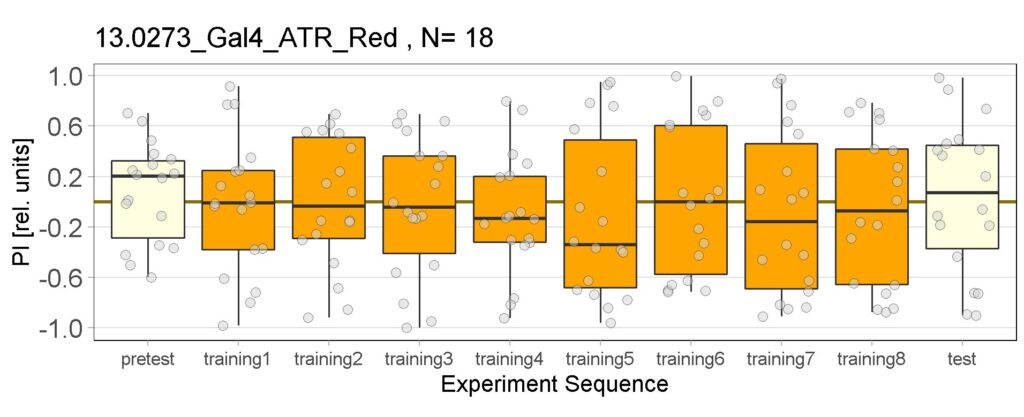
Joystick experiment results of ATR and NOATR Control and ATR 13.0273 Gal-4 for red light.
Category: Optogenetics | No Comments
Aslıhan Enes Red Light T-Maze Results
on Monday, September 5th, 2022 10:15 | by Aslihan Dilara Gülay
Results for Red Light T-Maze experiments.
Category: Optogenetics | 1 Comment