T-Maze experiment with red light

T-Maze experiment with Red light:
Graph shows “Mean Performance Index” for NorpA-UAS-Chrimson/Gr28bd, NorpA-UAS-Chrimson/0273, NorpA-UAS-Chrimson/38764, NorpA-UAS-Chrimson/66555, NorpA-UAS-Chrimson/66010, NorpA-UAS-Chrimson/66009 (ATR-treated foods for 2days) and Controls (NorpA-UAS-Chrimson/Gr28bd, without ATR).
The reaction of drosophila to light
NorpA-UAS-Chrimson/66009,
NorpA-UAS-Chrimson/66555,
NorpA-UAS-Chrimson/38764,
NorpA-UAS-Chrimson/0273, and NorpA-UAS-Chrimson/66010 flies to white light (ATR-treated foods for 2days).
T-Maze experiment with Red Light
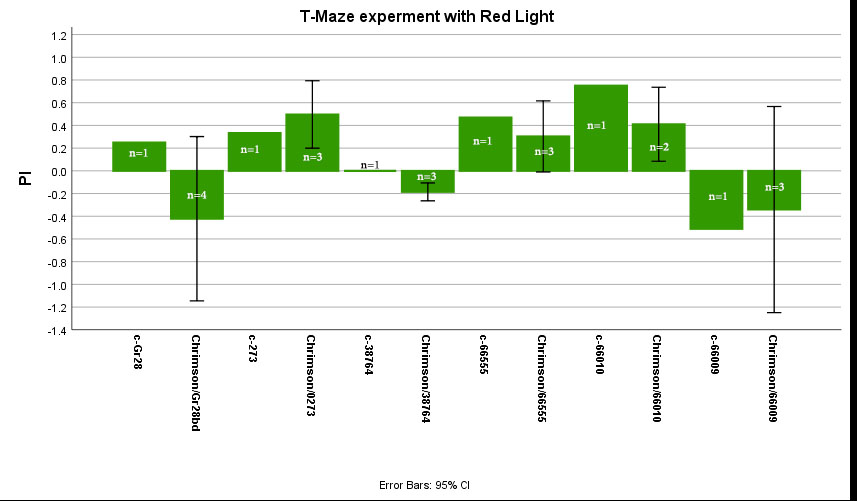
T-Maze experiment with Red light:
Graph shows “Mean Performance Index” for NorpA-UAS-Chrimson/Gr28bd, NorpA-UAS-Chrimson/0273, NorpA-UAS-Chrimson/38764, NorpA-UAS-Chrimson/66555, NorpA-UAS-Chrimson/66010, NorpA-UAS-Chrimson/66009 (ATR-treated foods for 2days) and Controls (c-= without ATR).
T-Maze experiment with yellow and red lights
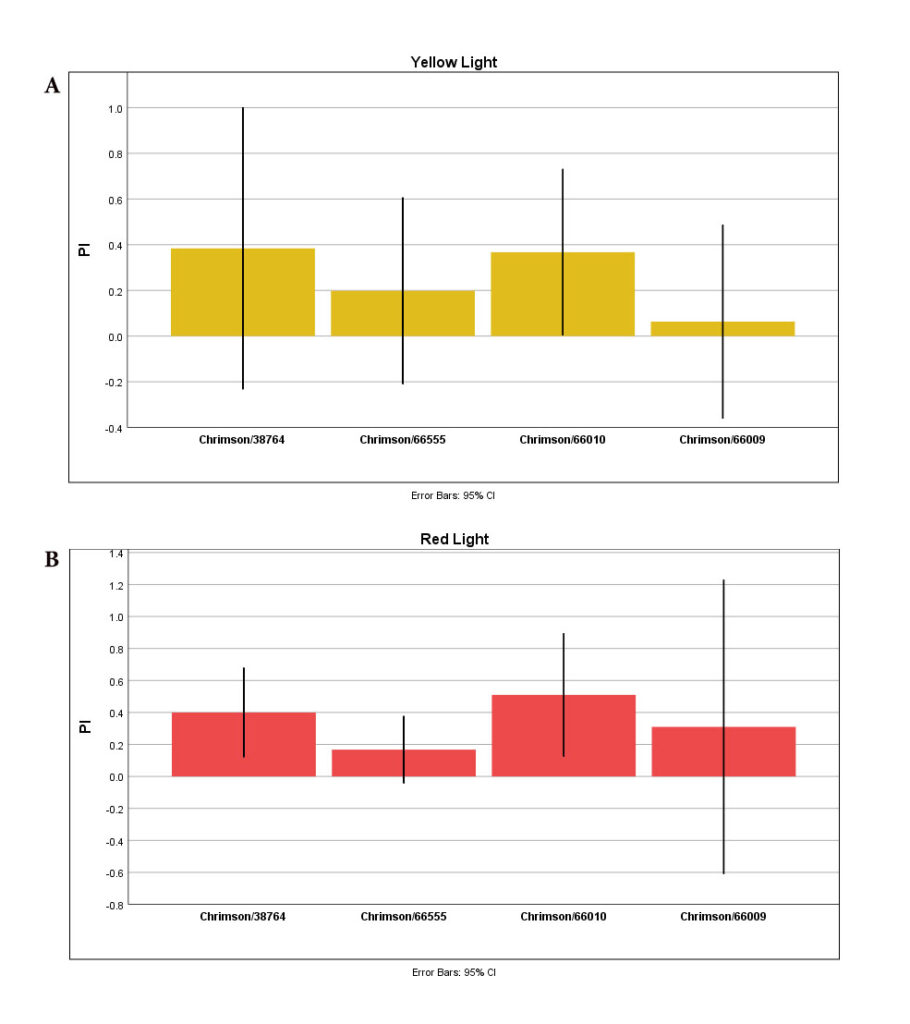
T-Maze experiment with yellow (A) and red (B) lights:
Graphs show “Mean Performance Index” for NorpA-UAS-Chrimson/38764, NorpA-UAS-Chrimson/66555, NorpA-UAS-Chrimson/66010, and NorpA-UAS-Chrimson/66009.
Flies (n=3) were given ATR-treated foods for 2days.
The same flies were used for both experiments, first with red light and the next day with yellow light.
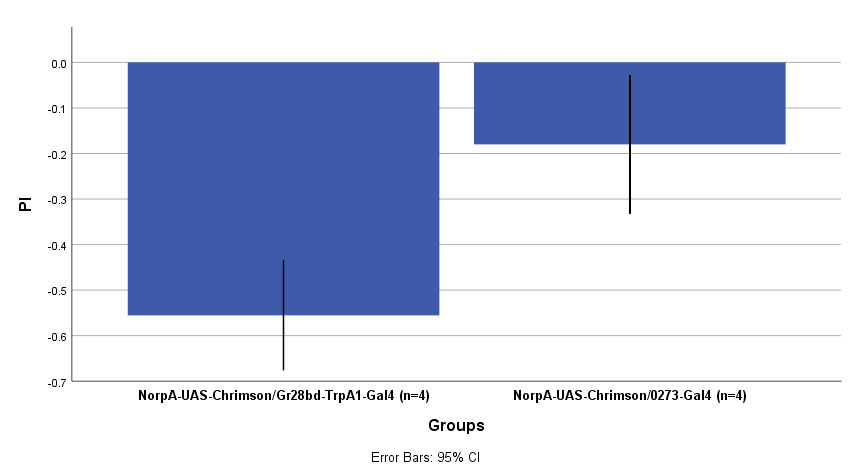
T-Maze experiment with red light

T-Maze experiment with red light.
Graph shows “Mean Performance Index” for NorpA-UAS-Chrimson/Gr28bd, NorpA-UAS-Chrimson/0273-Gal4, NorpA-UAS-Chrimson/38764, NorpA-UAS-Chrimson/66555, NorpA-UAS-Chrimson/66010, and NorpA-UAS-Chrimson/66009.
Flies were given ATR-treated foods for 2days.
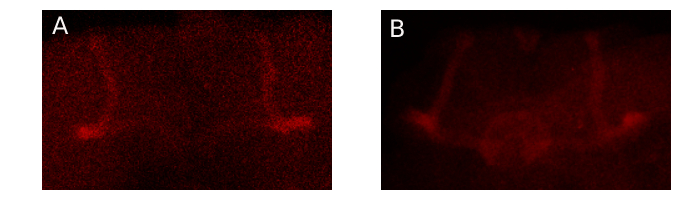
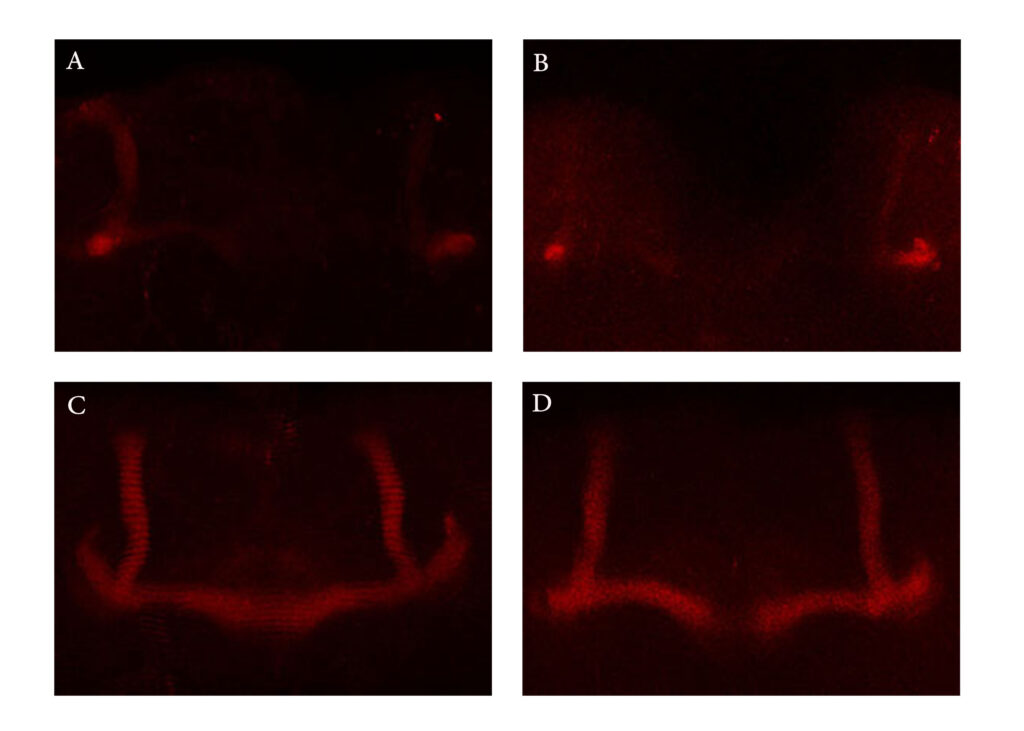
Immunostaining of Mushroom Body using anti-FasII antibody
T-maze with yellow and red lights
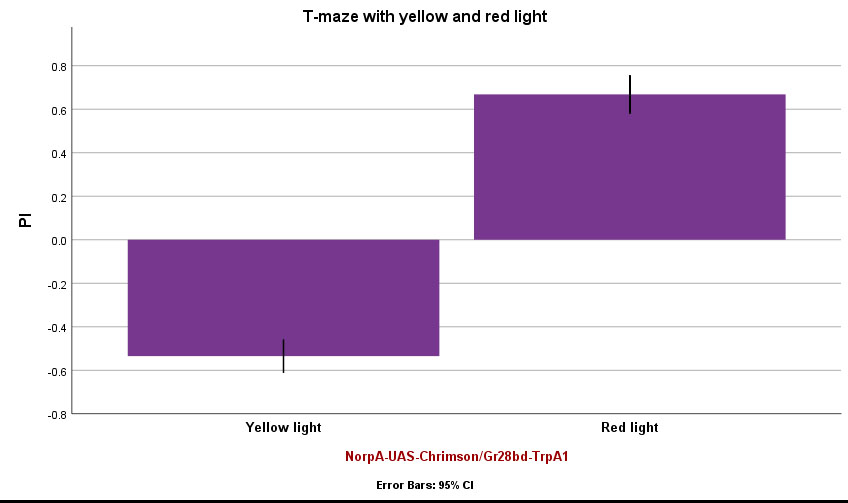
T-maze experiment with yellow and red lights. Graph shows “Mean Performance Index” for NorpA-UAS-Chrimson/Gr28bd-TrpA1 Flies. Comparison between yellow and red lights. Flies were given ATR-treated foods for 2day (n=10).
T-Maze experiment with yellow light
Flies were given ATR-treated foods for 2days (n=4).
T maze experiment with yellow light
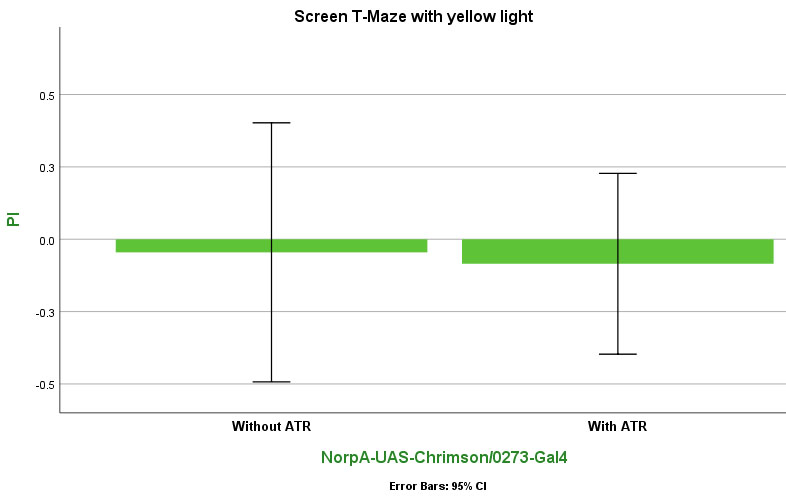
Graph shows “Mean Performance Index” for NorpA-UAS-Chrimson/0273-Gal4 flies.
Comparison between Control (Without ATR, n=5) and flies were given ATR-treated foods for 2days (n=12).