
Variability of Phototaxis 3: 1 Minute instead of 15 seconds
As I said in my last post, I started doing the Benzer again but instead of giving them 15 seconds for every single choice , they had 1 minute.
In Fig. 1 you see the cumulative proportions for the tubes 3-0. All of them have an N of 2.
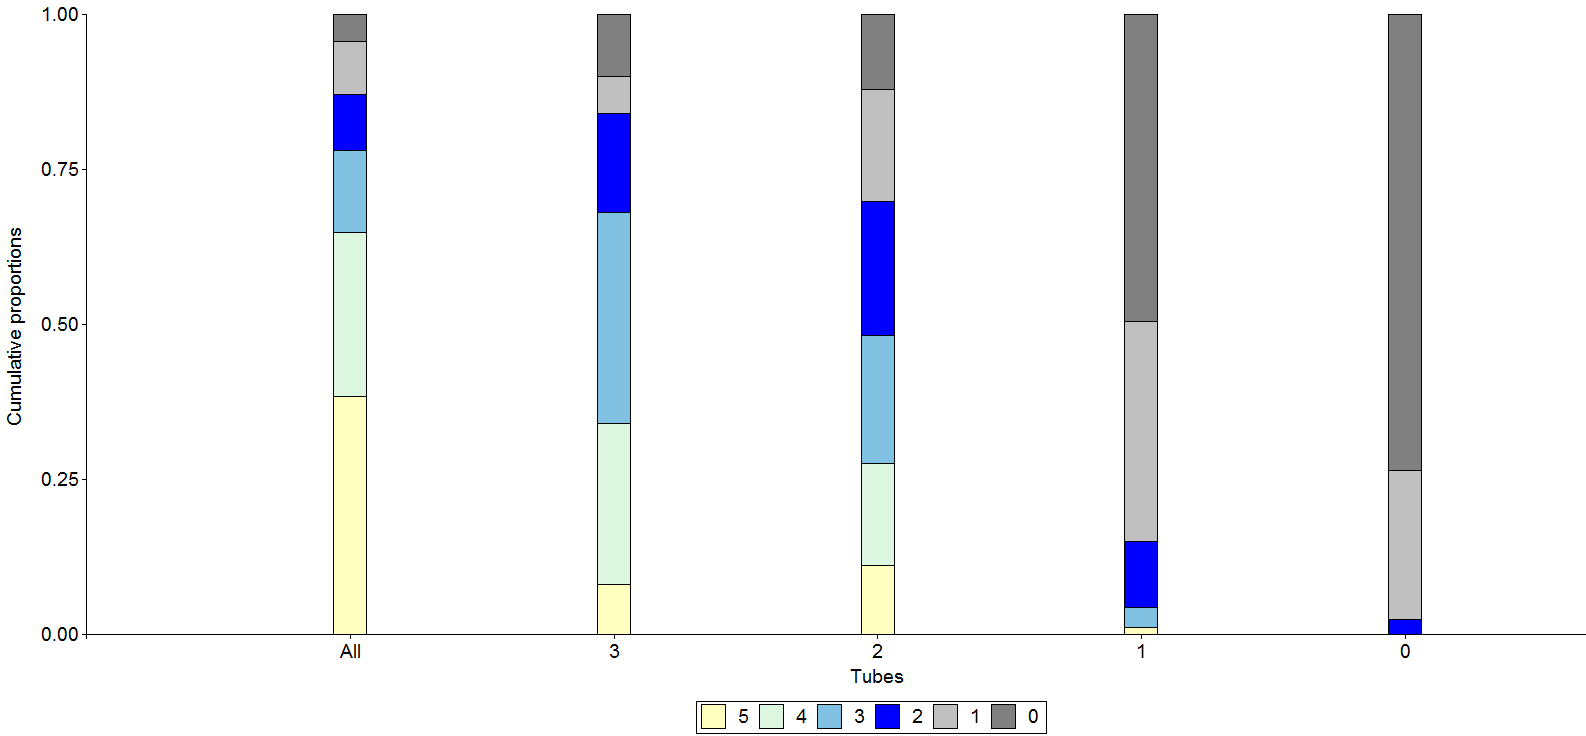
Fig. 1 cumulative proportions
Update 2: Variability of Phototaxis 3
Now that I reached an N of 4 for the flies of tube 0, I decided that this will be the final amount of groups of flies that will be tested (Fig.1+2). Because it is really hard to get 40 flies of the tube 0 in one week to be able to test them. Due to the results of the Buridan-paradigm, where we saw that the flies of tube 0 traveled the smallest distance and had the lowest activitytime because they made more pauses than the flies of the other tubes (see Update 2: Variability of Phototaxis 4: Buridan). So I will change the time I give the flies for each decision in the Benzer. I decided to give them 1 minute for each choice instead of 15 seconds, to see if their decision is only due to a lack of time or if it is stable over time.
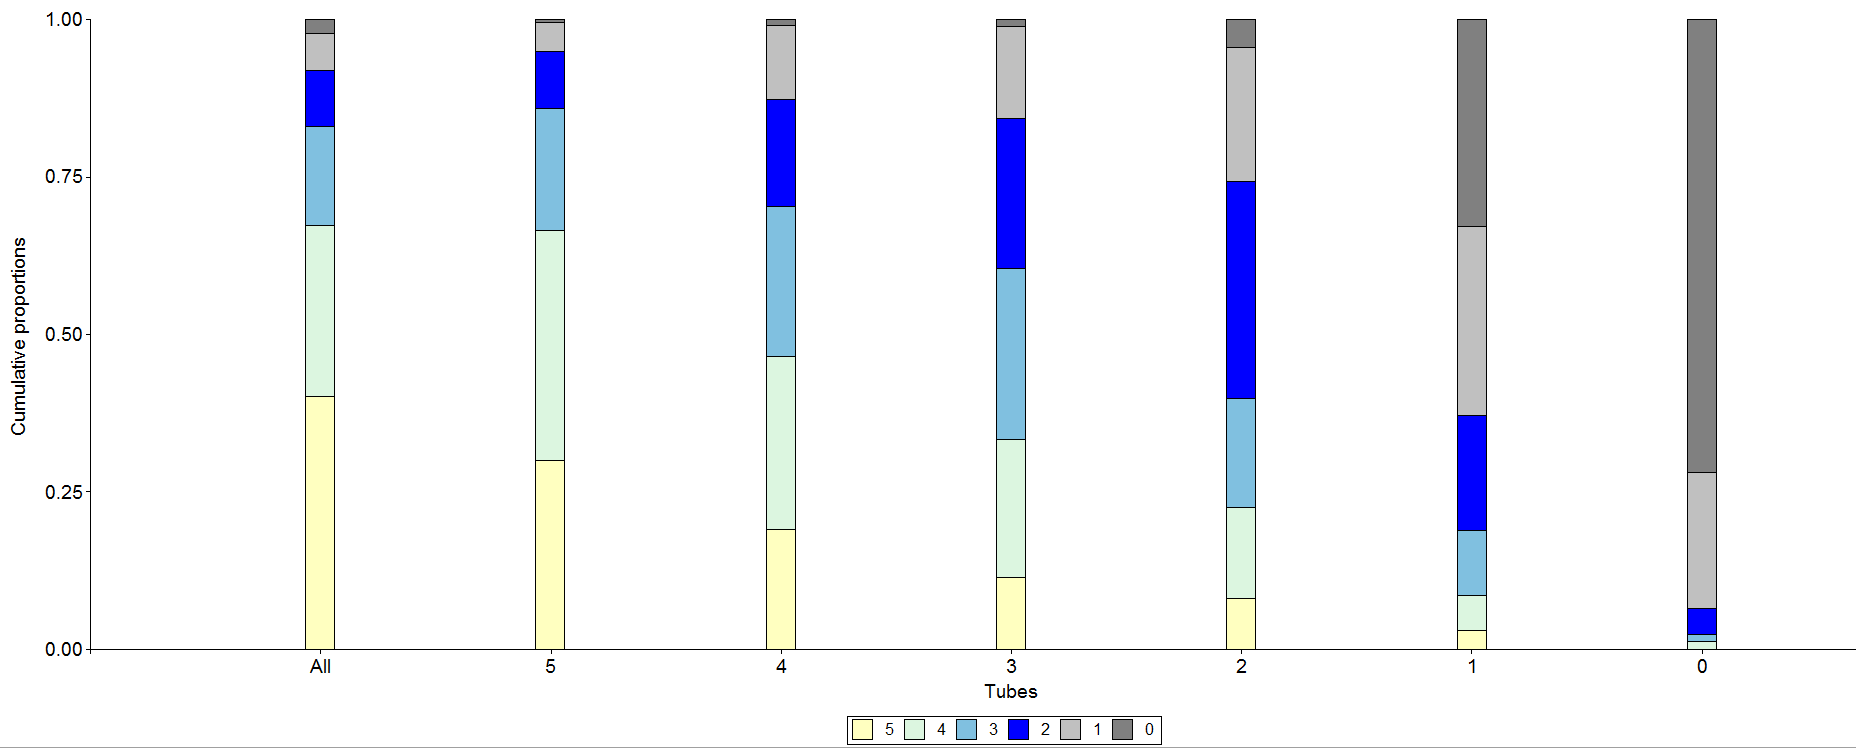
Fig.1: Cumulative proportions in all tubes
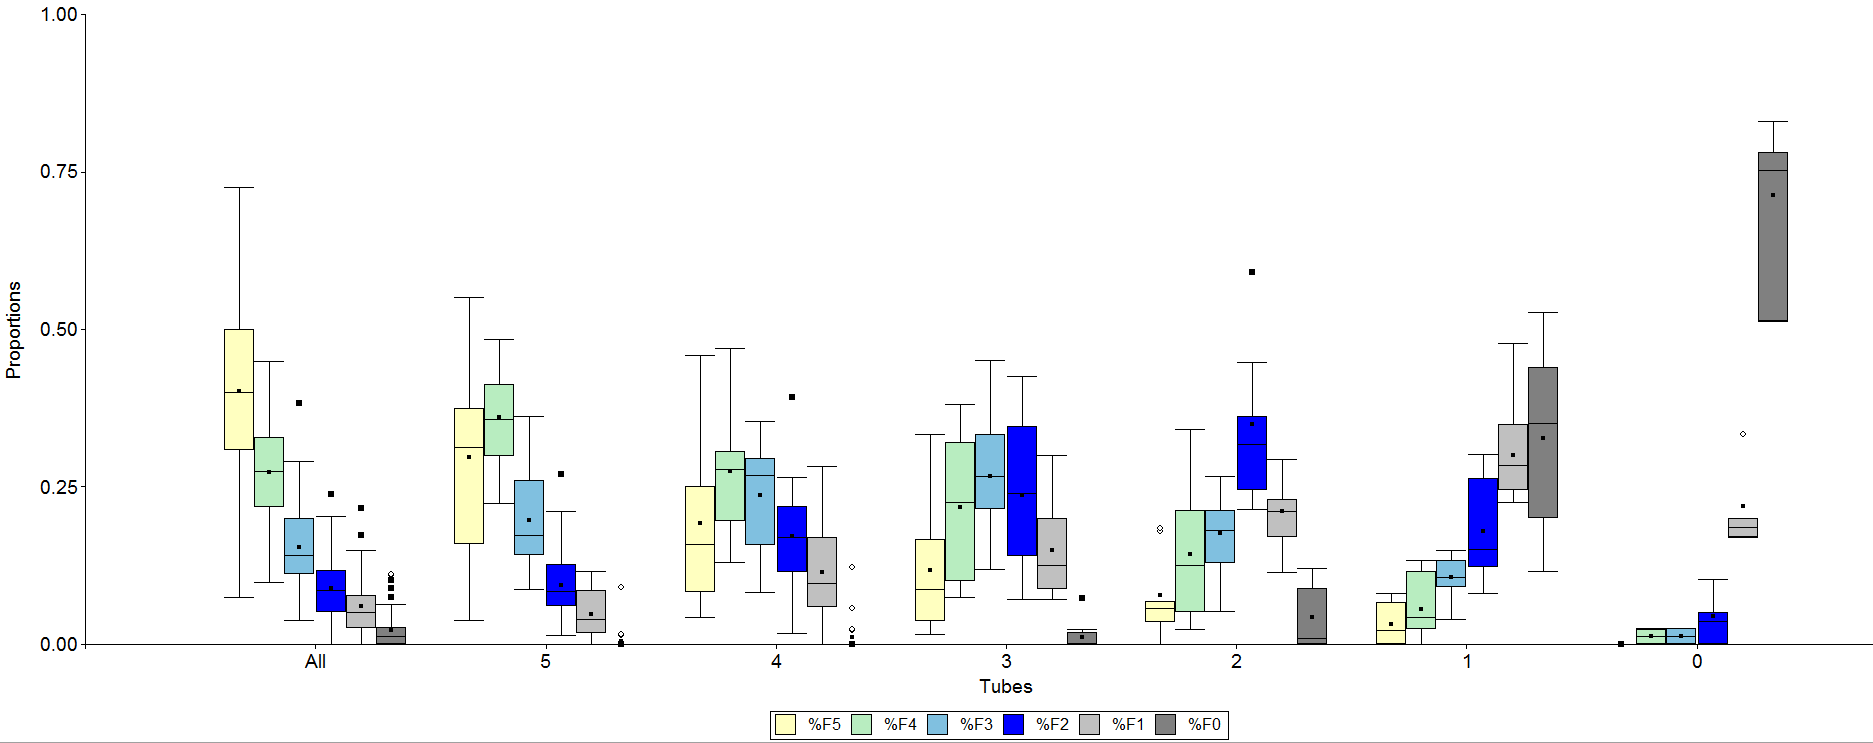
Fig.2: Proportions in all tubes
Update: Variability of Phototaxis 3
I started completing the experiment I started a few weeks ago (see variability of phototaxis 3), were I did once the Benzer paradigm to split the group and then I did the Benzer paradigm a second time only using the flies from a particular tube.
I tested at least 8 groups with 40 flies for each tube, except tube 0, wherefore I only have an N of 2.

Fig. 1 Cumulative proportions in all tubes
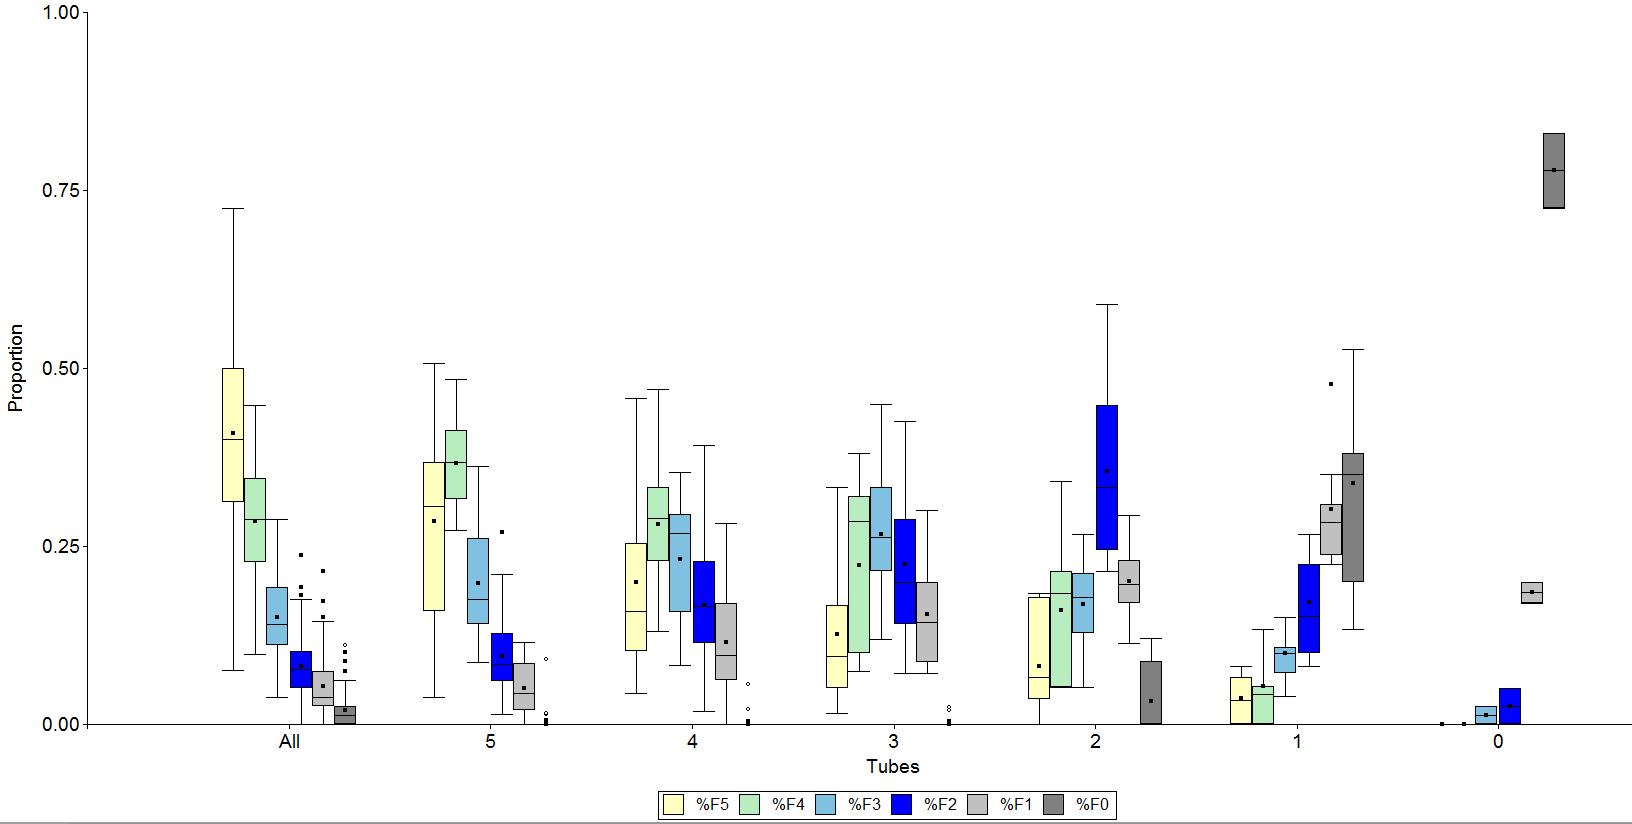
Fig. 2 Proportions in all tubes
Update2: Variability of Phototaxis 4: Buridan
I continued collecting data for the Buridan experiment, so that now I can also show some data for the tubes 3-5.
Like in the previous post the different plots differ more form each other than in the first experiment. (Fig. 1-4)
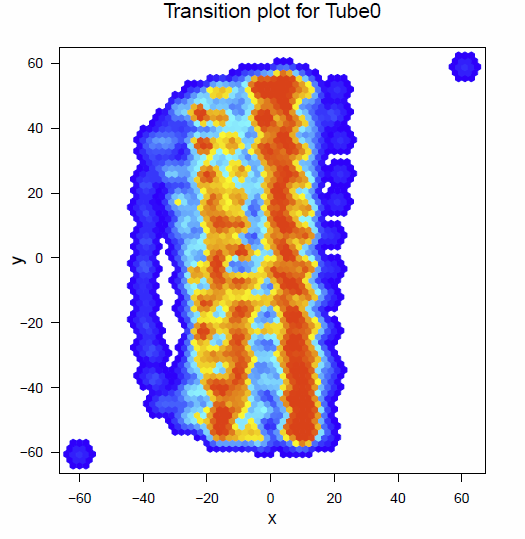
Fig. 1 Transitionplot for Tube 0

Fig. 2 Transitionplot for tube 1& 2
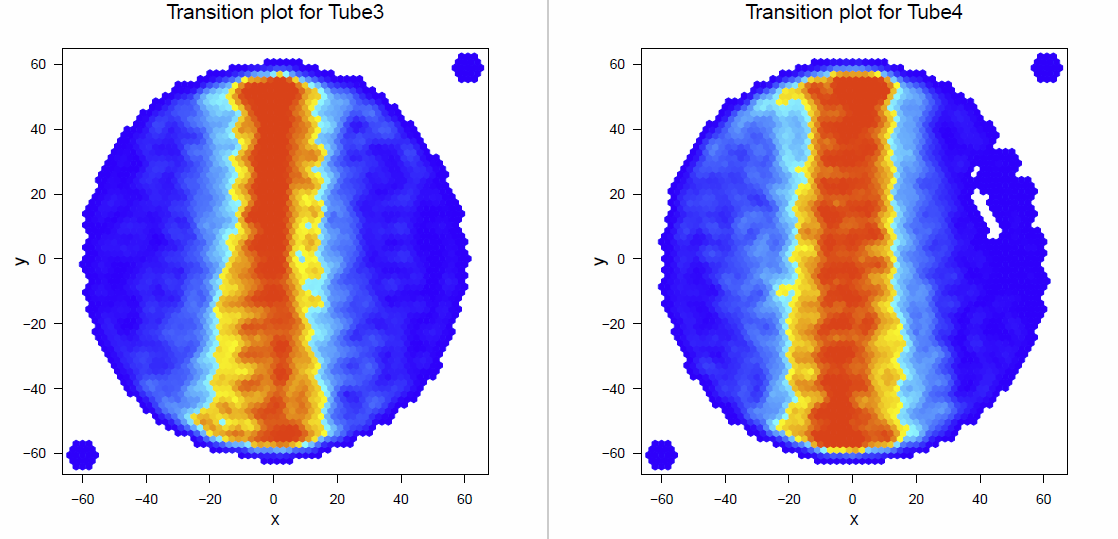
Fig.3 Transitionplot for tube 3 & 4
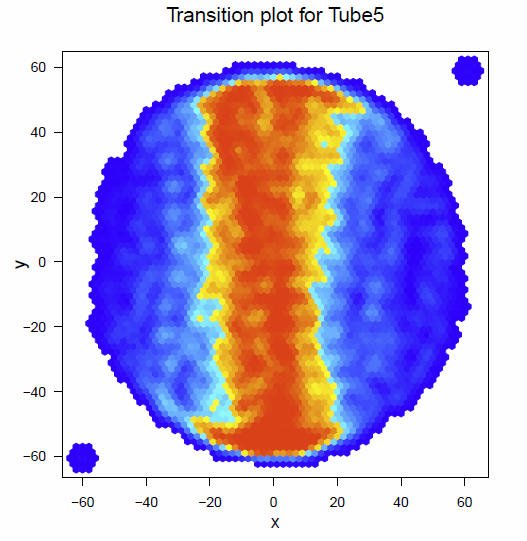
Fig. 4 Transitionplot for tube 5
And also this time I had again a look on the distance traveled per minute (Fig. 5) and the median speed (Fig. 6), the activitytime per minute (Fig. 7), the pause length (Fig. 8) , the number of pauses per minute and the number of walks (Fig. 9)
The flies of tube 0 traveled the smallest distance (Fig.5) and have the lowest activitytime (Fig.7) , but they have quite the same speed as the flies of the other groups (Fig.6). This can be explained by the number of pauses and the number of walks (Fig. 9). The flies of tube 0 make more pauses and less walks than the flies of the other tubes.

Fig. 5 Distance traveled per minute
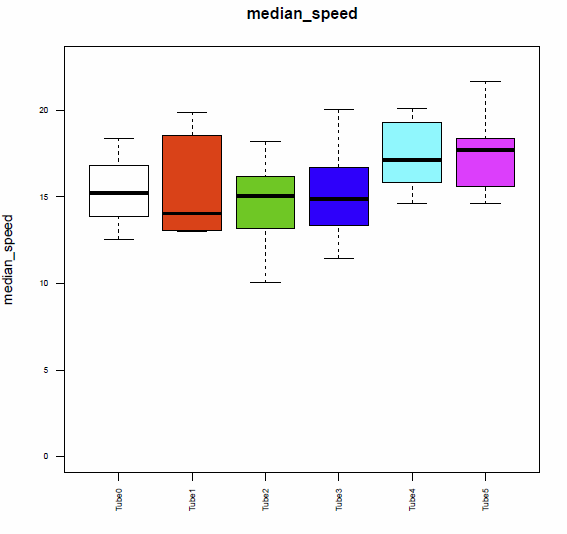
Fig. 6 median speed

Fig. 7 Activitytime per minute
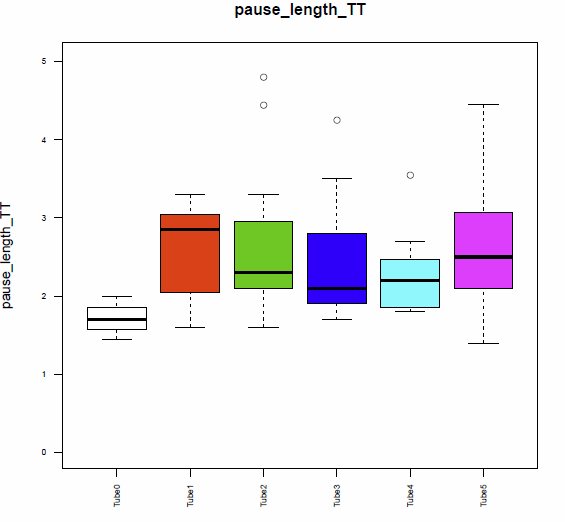
Fig. 8 Pause length
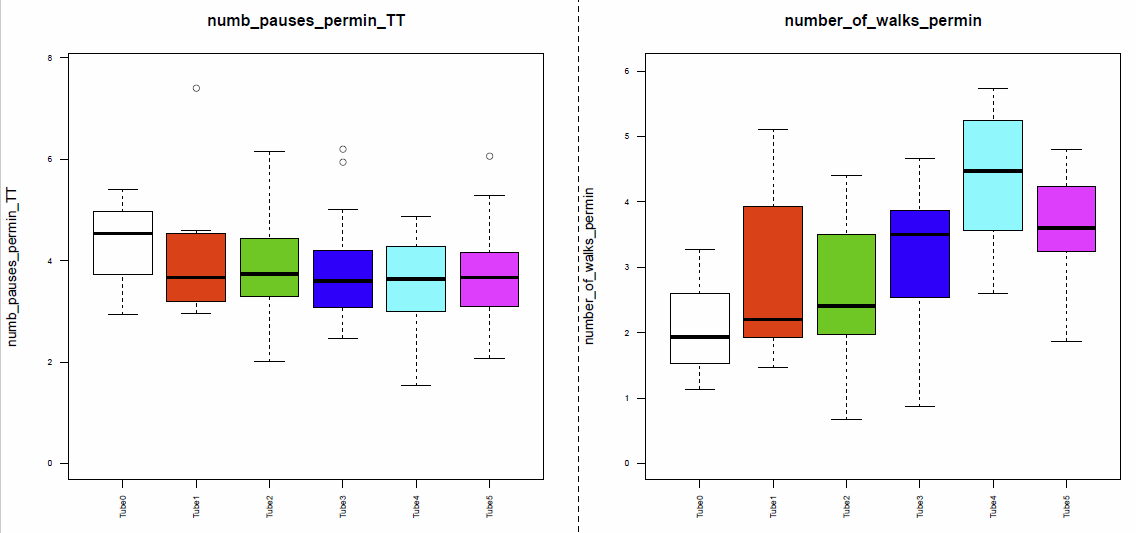
Fig. 9 Number of pauses & number of walks per minute
Update: Variability of Phototaxis 4: Buridan
Because the data in the last experiments seemed to be very similar in each of the different tubes and there were many problems with the evaluation of this data, I decided to redo this experiment.
I started testing the tubes 0 to 2, with only a number of 4 flies in group 0, 5 flies in group 1 and 7 flies in group 2. This difference in the number of flies is due to the previous Benzer-experiments I did to split the flies.
Below there are the new transitionplots of the different tubes tested (Fig.1) In this case we see that the different plots differ more form each other than in the last experiment.
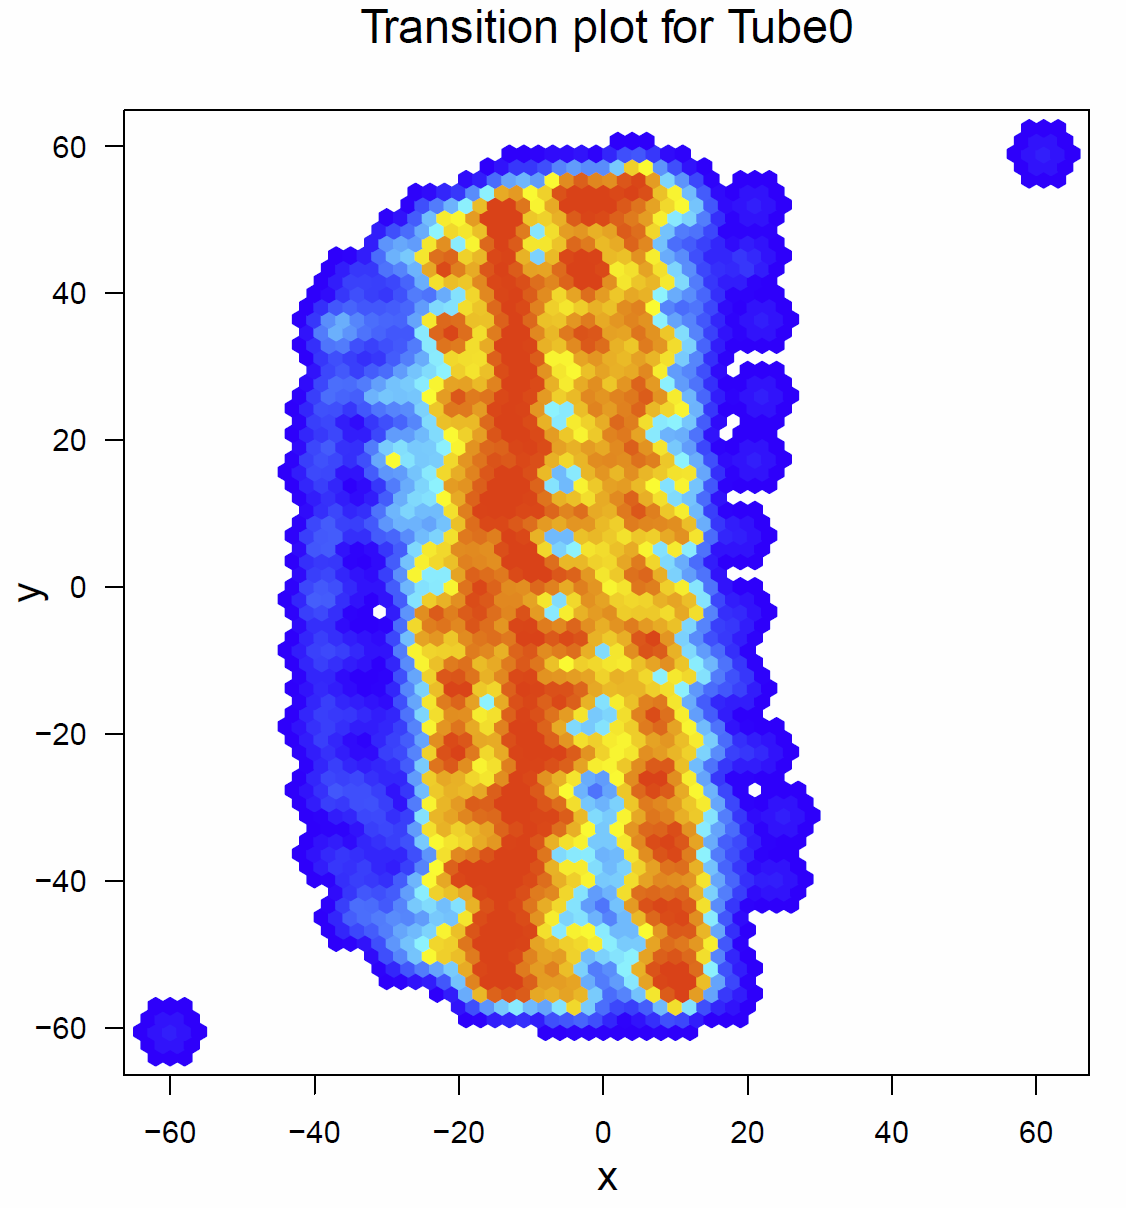
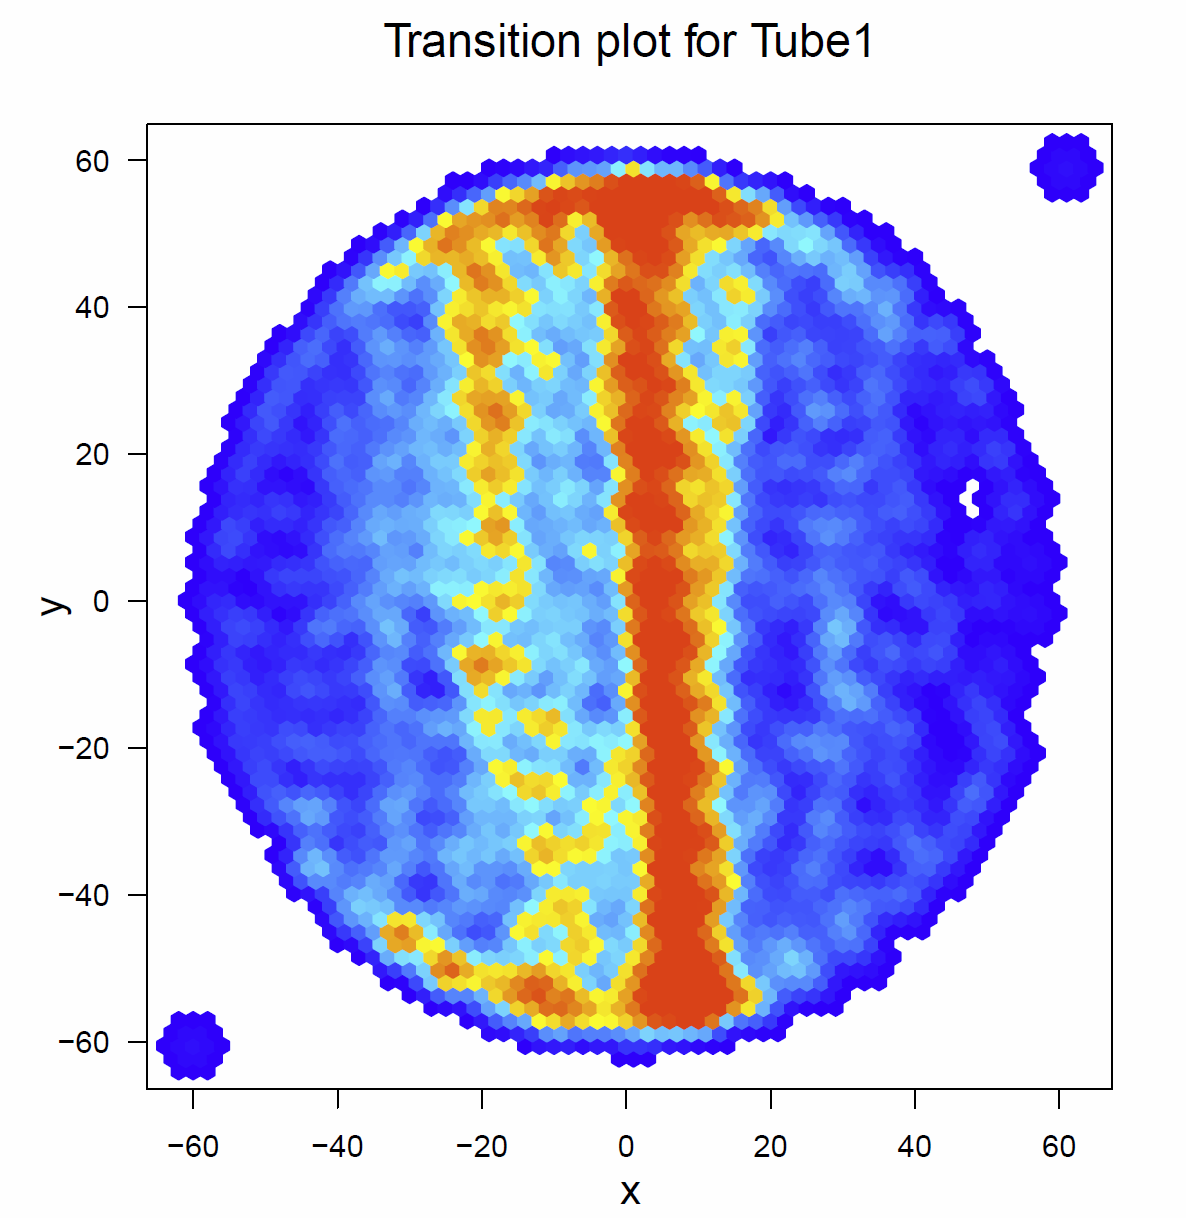
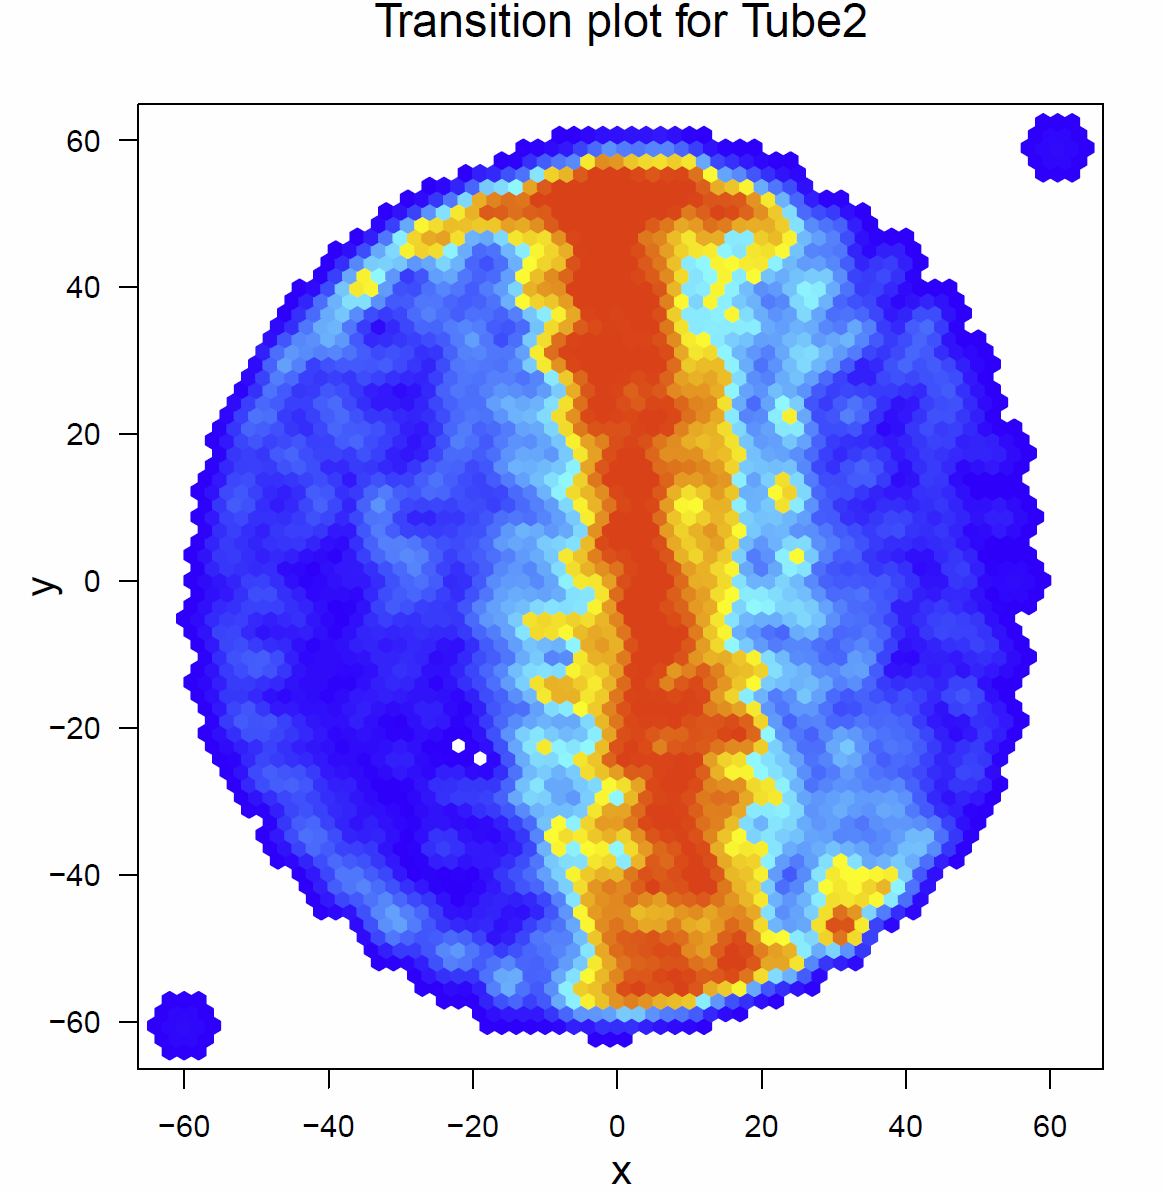
Fig. 1 Transitionplots Tube 0-2
This time I also had a look on the distance traveled per minute and the median speed (Fig. 2), the activitytime per minute (Fig. 3 & 4) , the pause duration and length, the number of pauses per minute (Fig. 5&6)
We see that the median speed, the pause duration and the number of pauses per minute are similar in all the groups. But there is a difference in the distance the flies traveled and the activitytime of these flies. Both are reduced in the flies of tube 0, whereas the flies of tube 1 and 2 are quite similar.
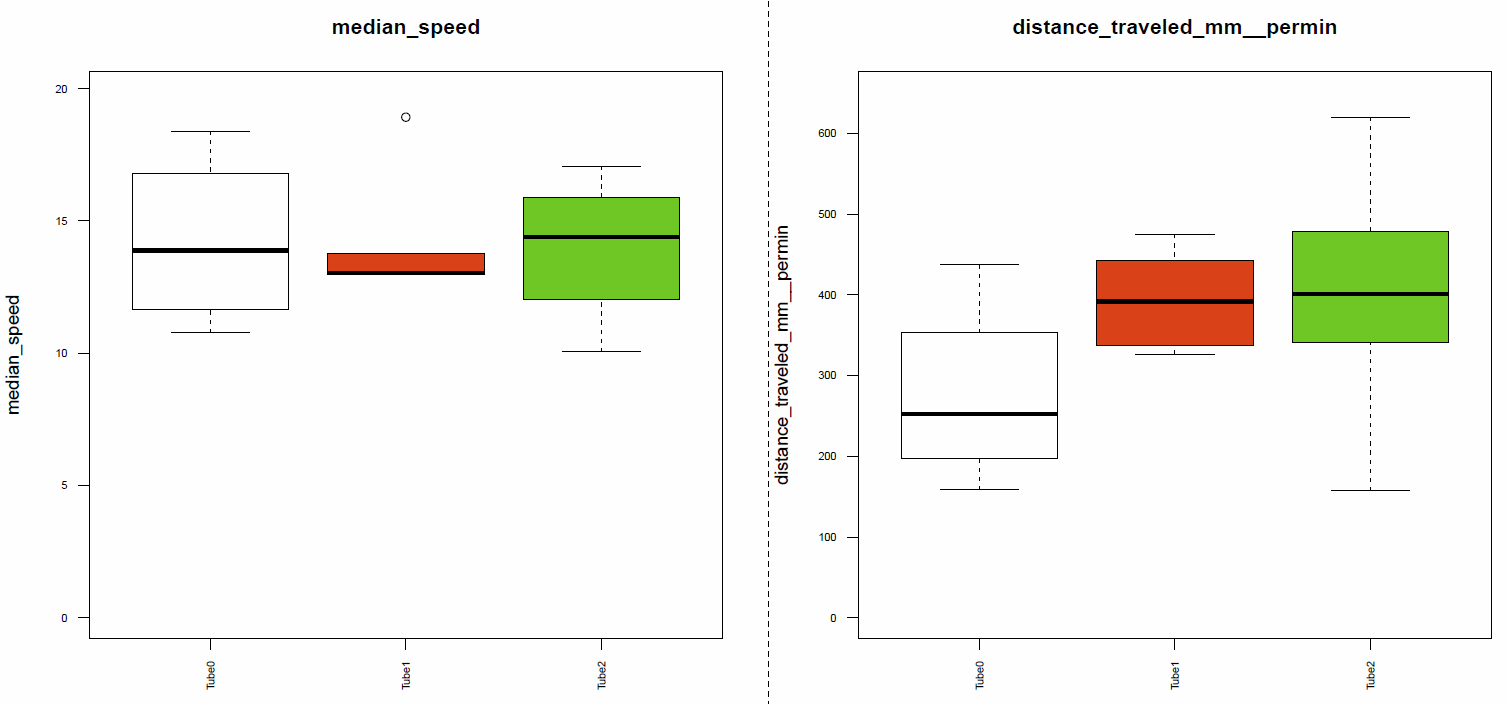
Fig. 2 median speed & distance traveled
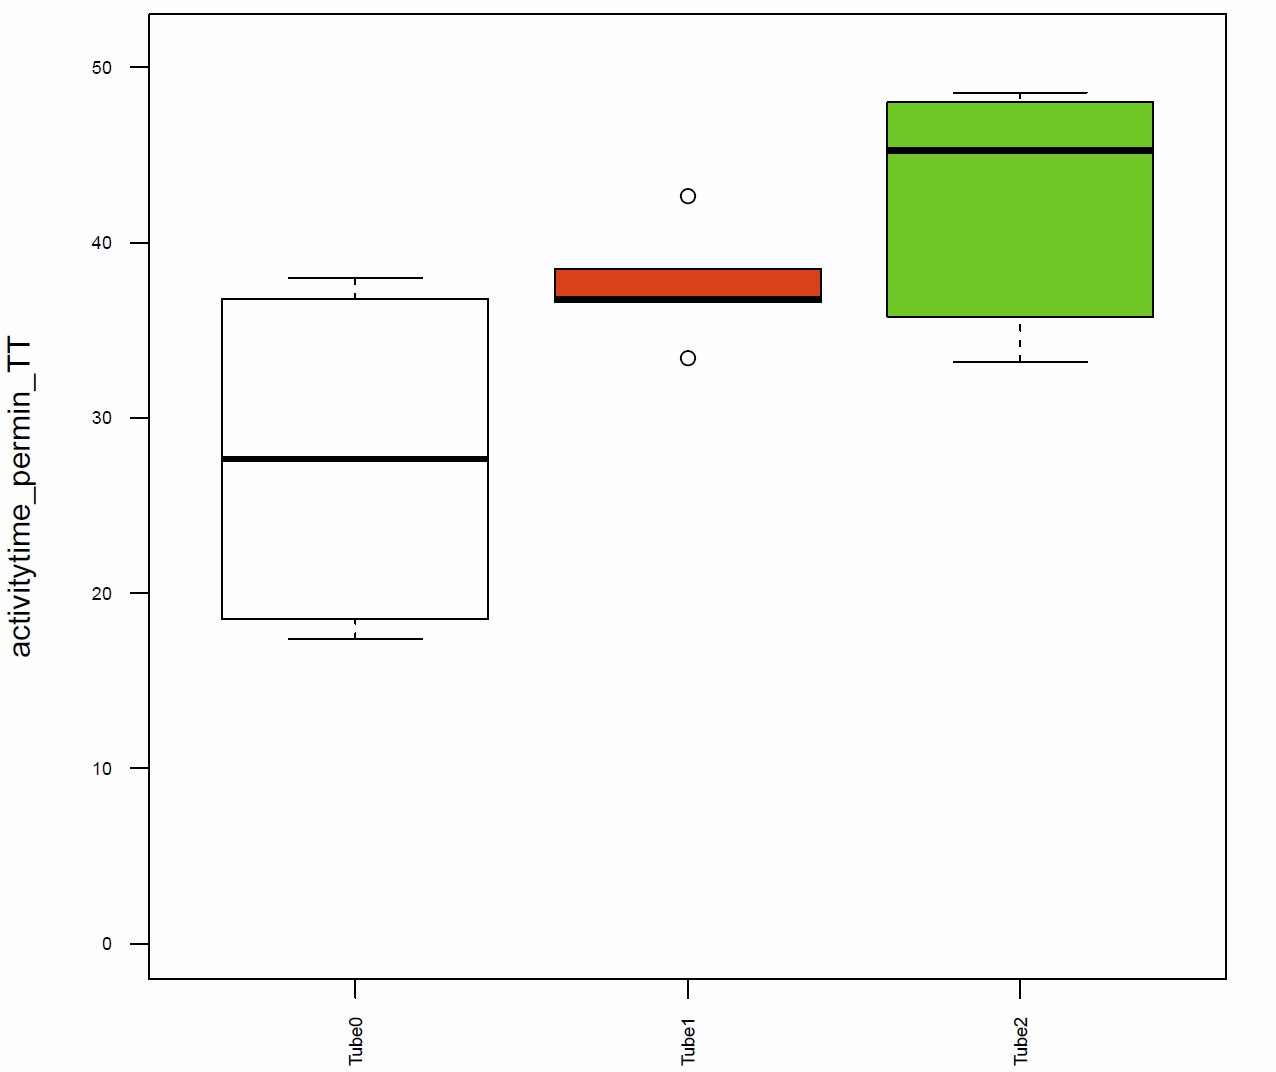
Fig. 3 Activitytime per minute (TT)
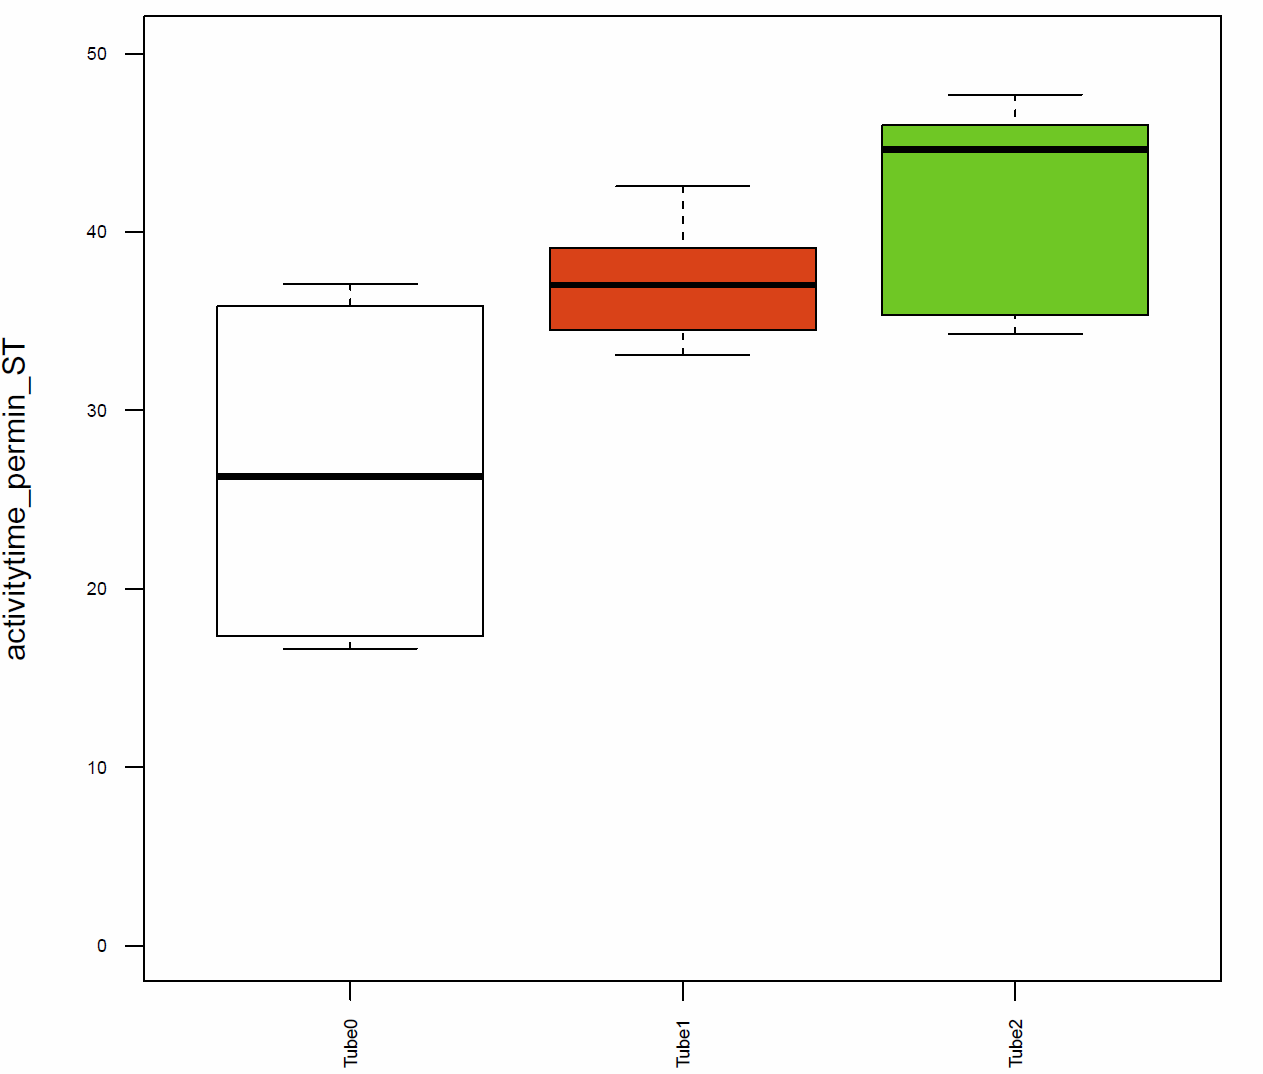
Fig. 4 Activitytime per minute (ST)
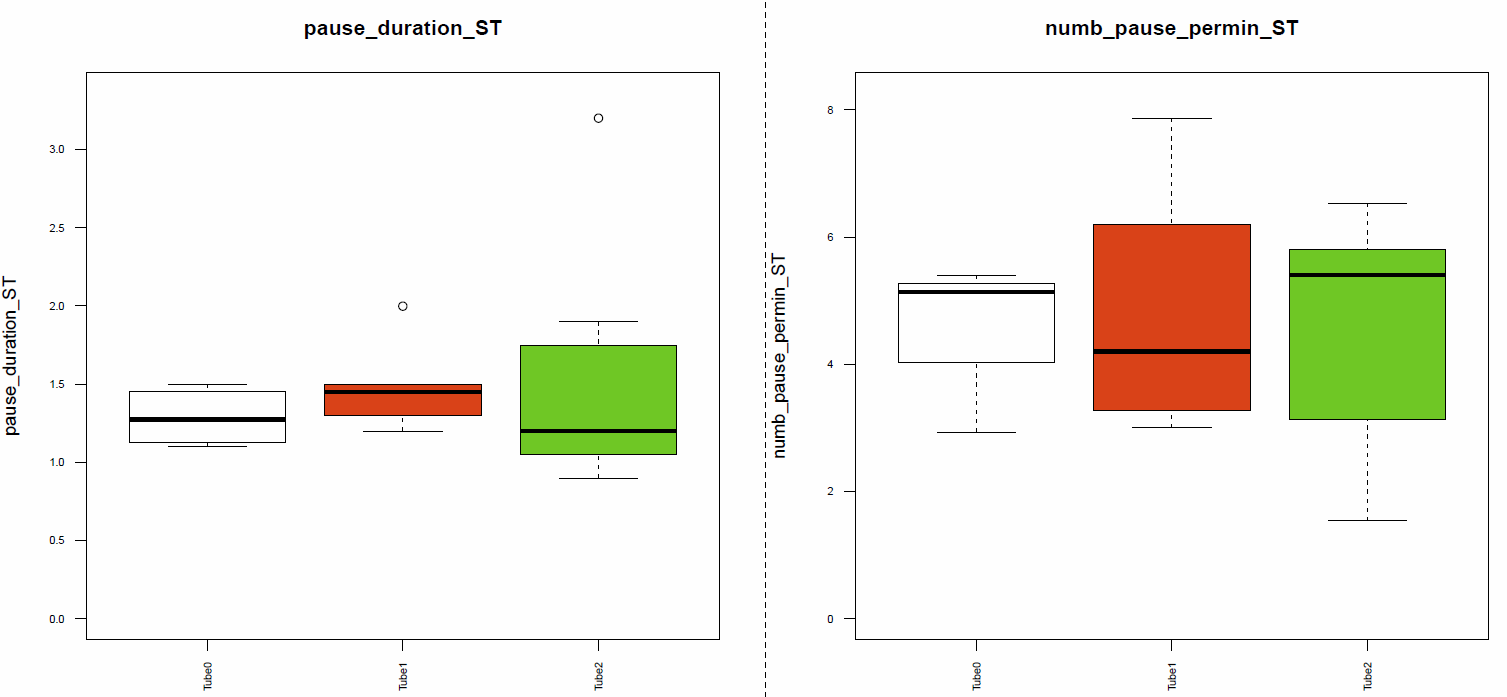
Fig. 5 Pause duration & number of pauses per minute (ST)
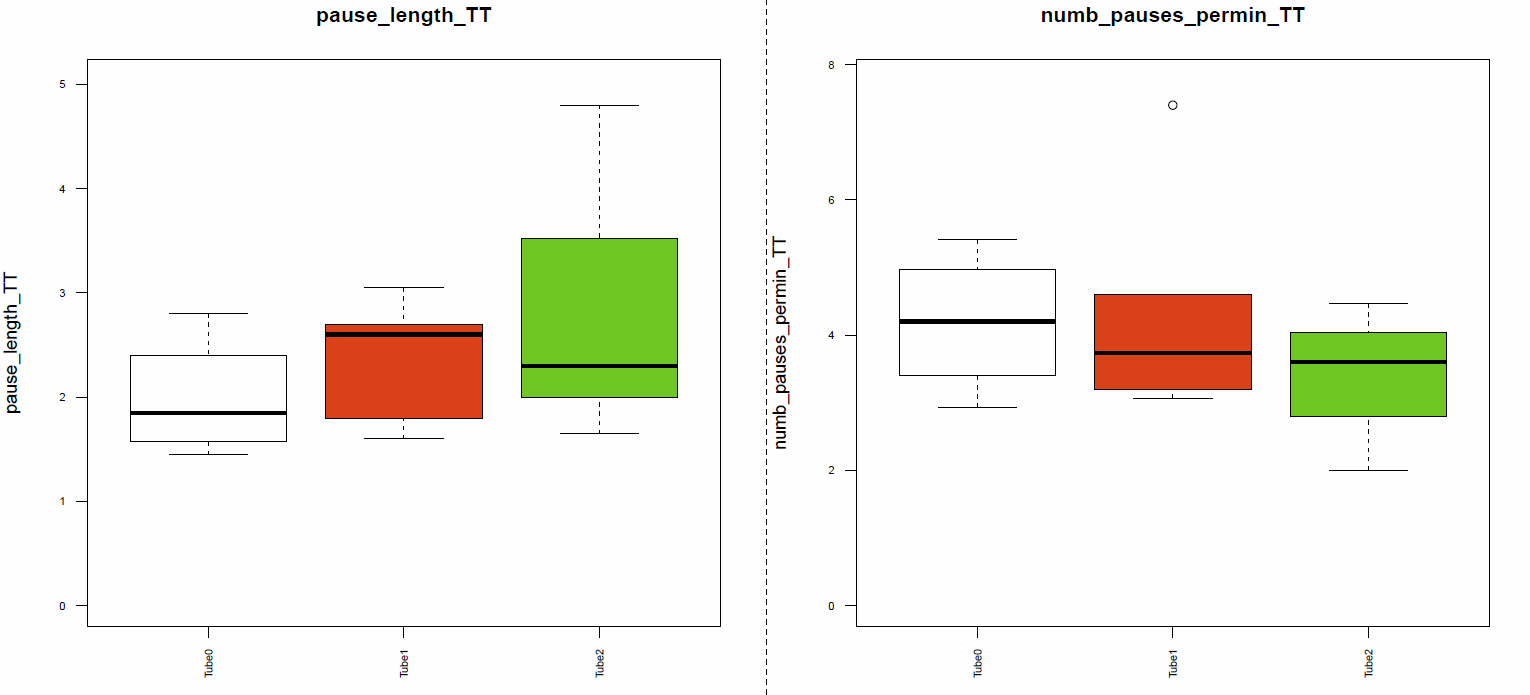
Fig. 6 pause length & number of pauses per minute (TT)
Variability of Phototaxis 4: Buridan
In the previous experiment, where all the tubes were tested individually, we saw different distributions between this subgroups. Therefor I wanted to test the activity and in particular the speed of single flies of each of this subgroups, to see if this result could be explained by a difference of these parameters. For that I started doing first the Benzer-paradigm to split the flies. Then I took random flies of each of the 6 tubes, cut their wings under cold-anesthesia with 24 hours recovery and after that, tested them in the Buridan.
Below there are the transitionplots of all the different tubes tested (Fig.1-Fig.6). You can see that the flies of the different subgroups seem to have quite similar Transitionplots.
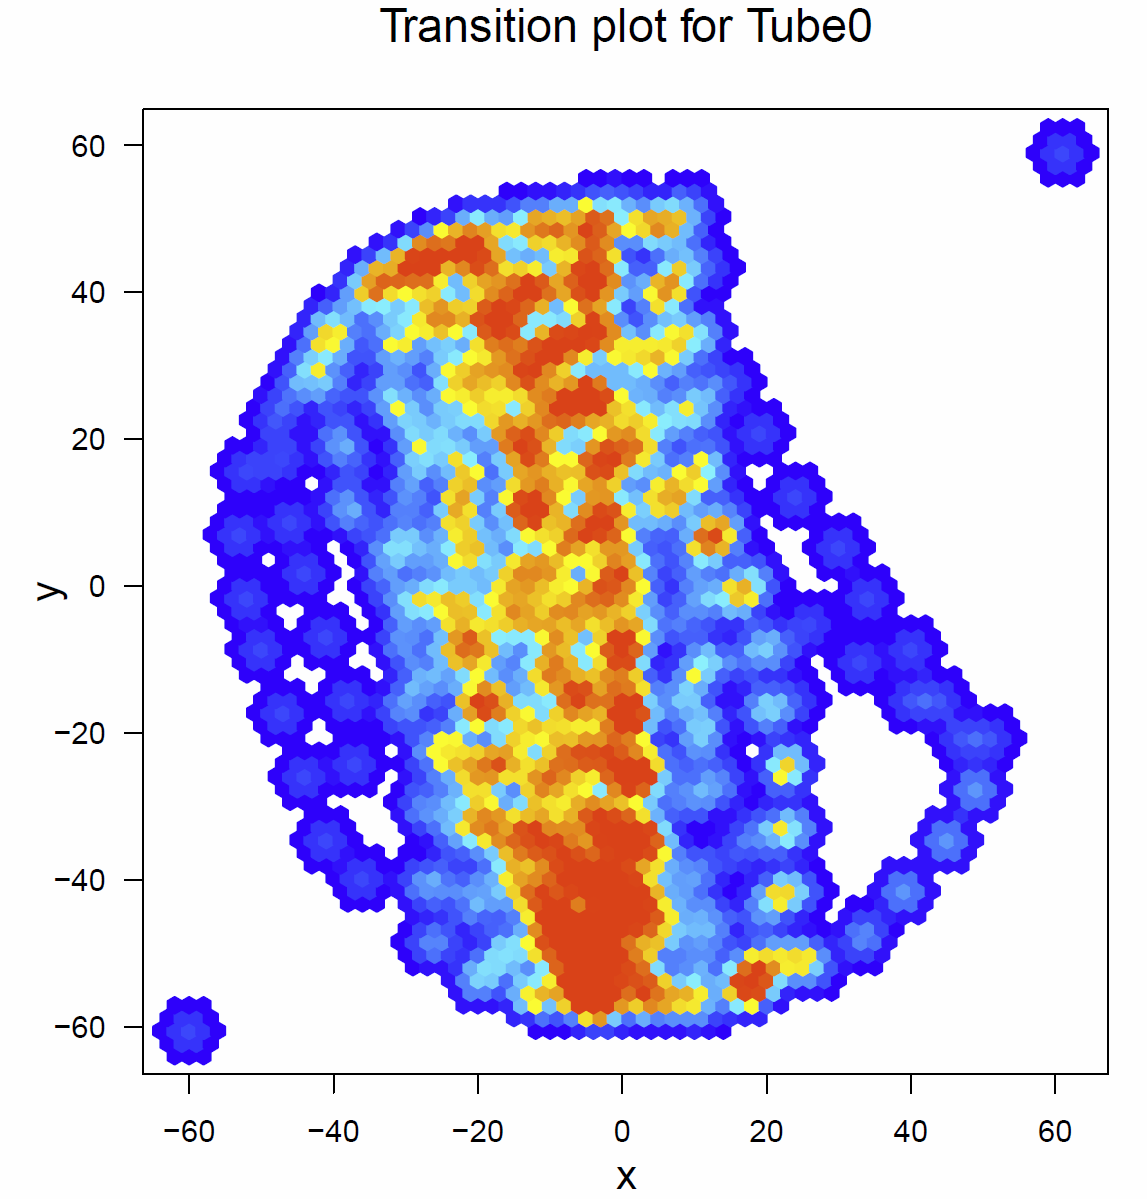
Fig.1 Transitionplot for tube 0
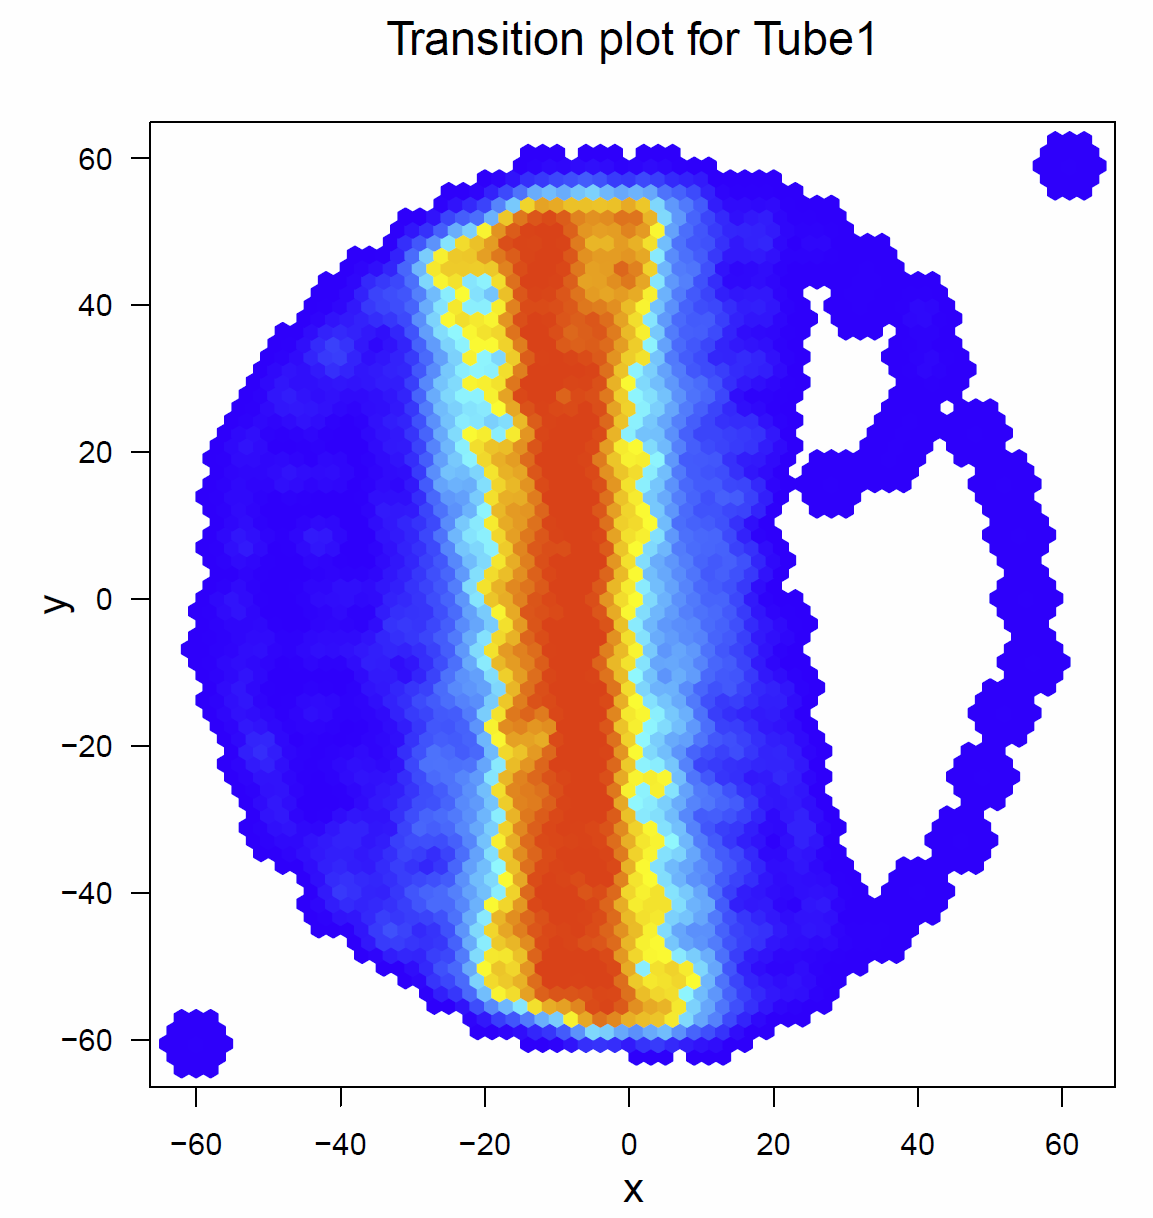
Fig. 2 Transitionplot for tube 1
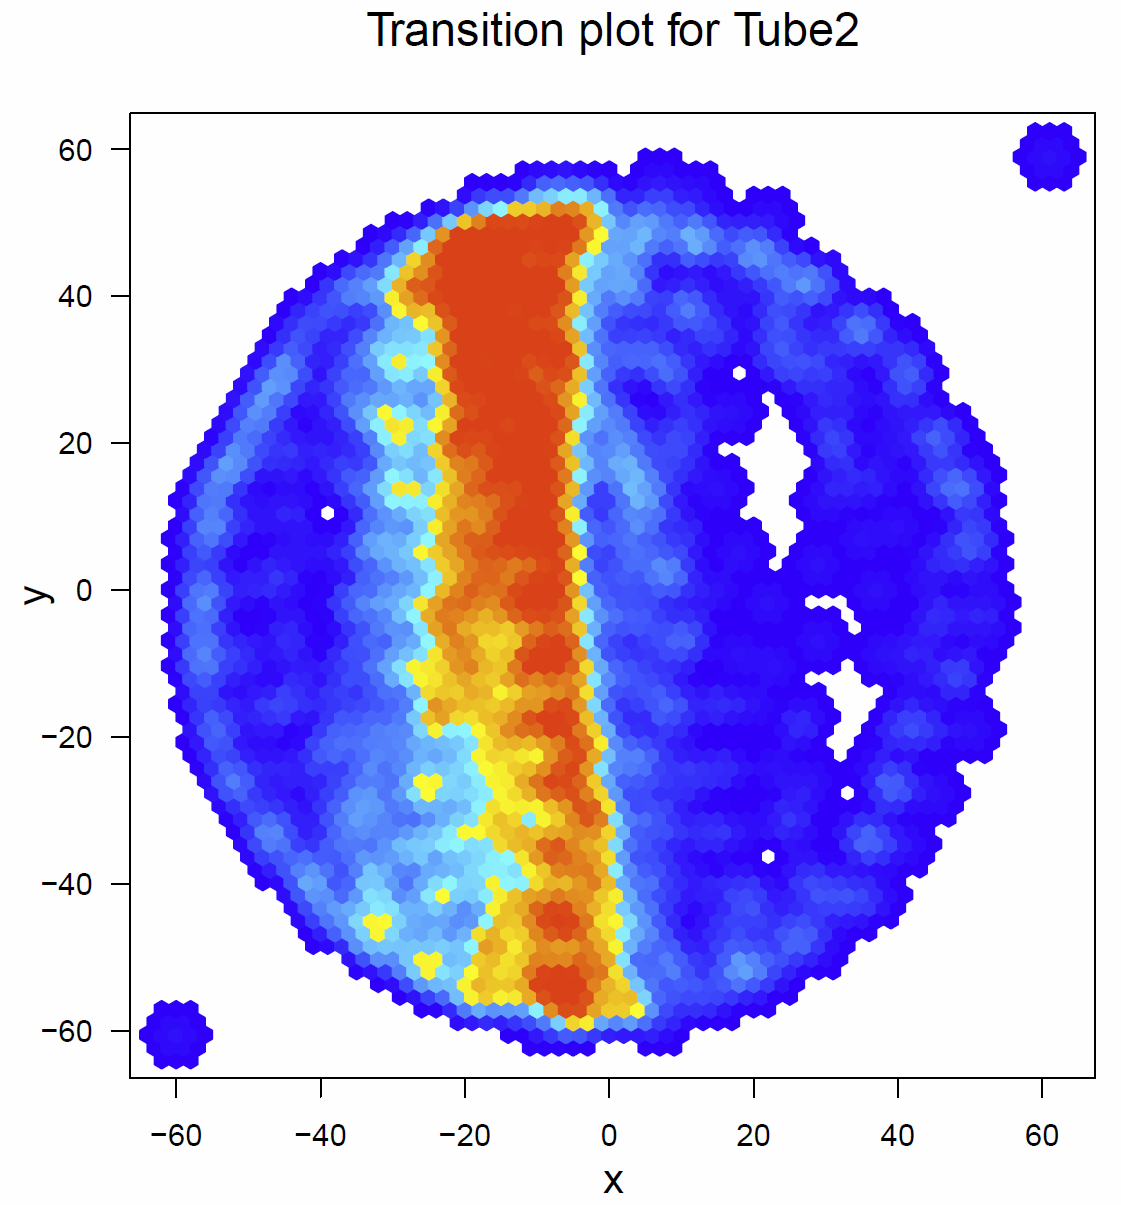
Fig. 3 Transitionplot for tube 2
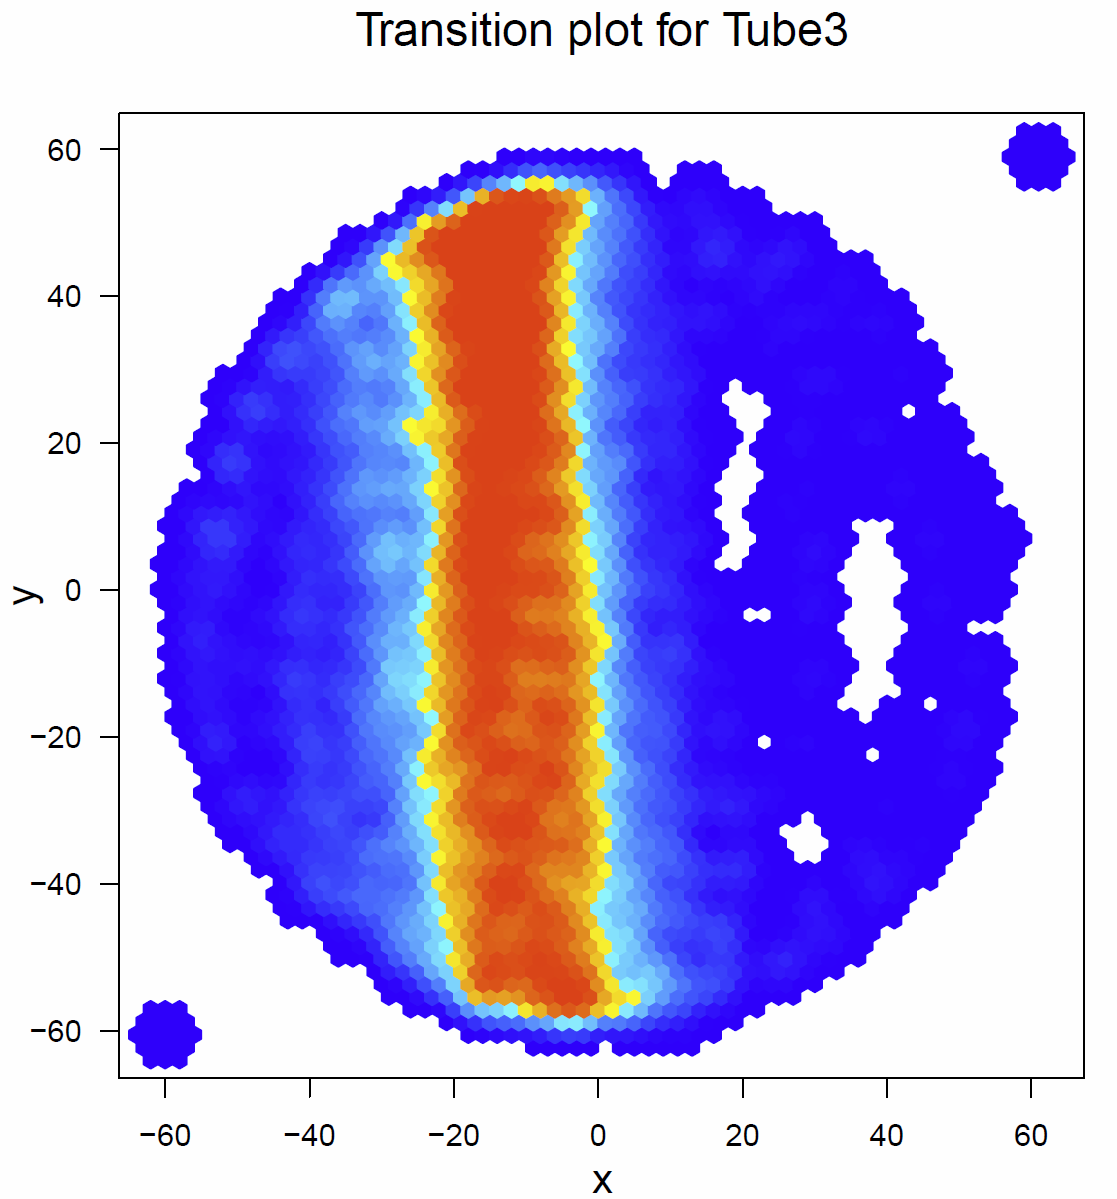
Fig. 4 Transitionplot for tube 3
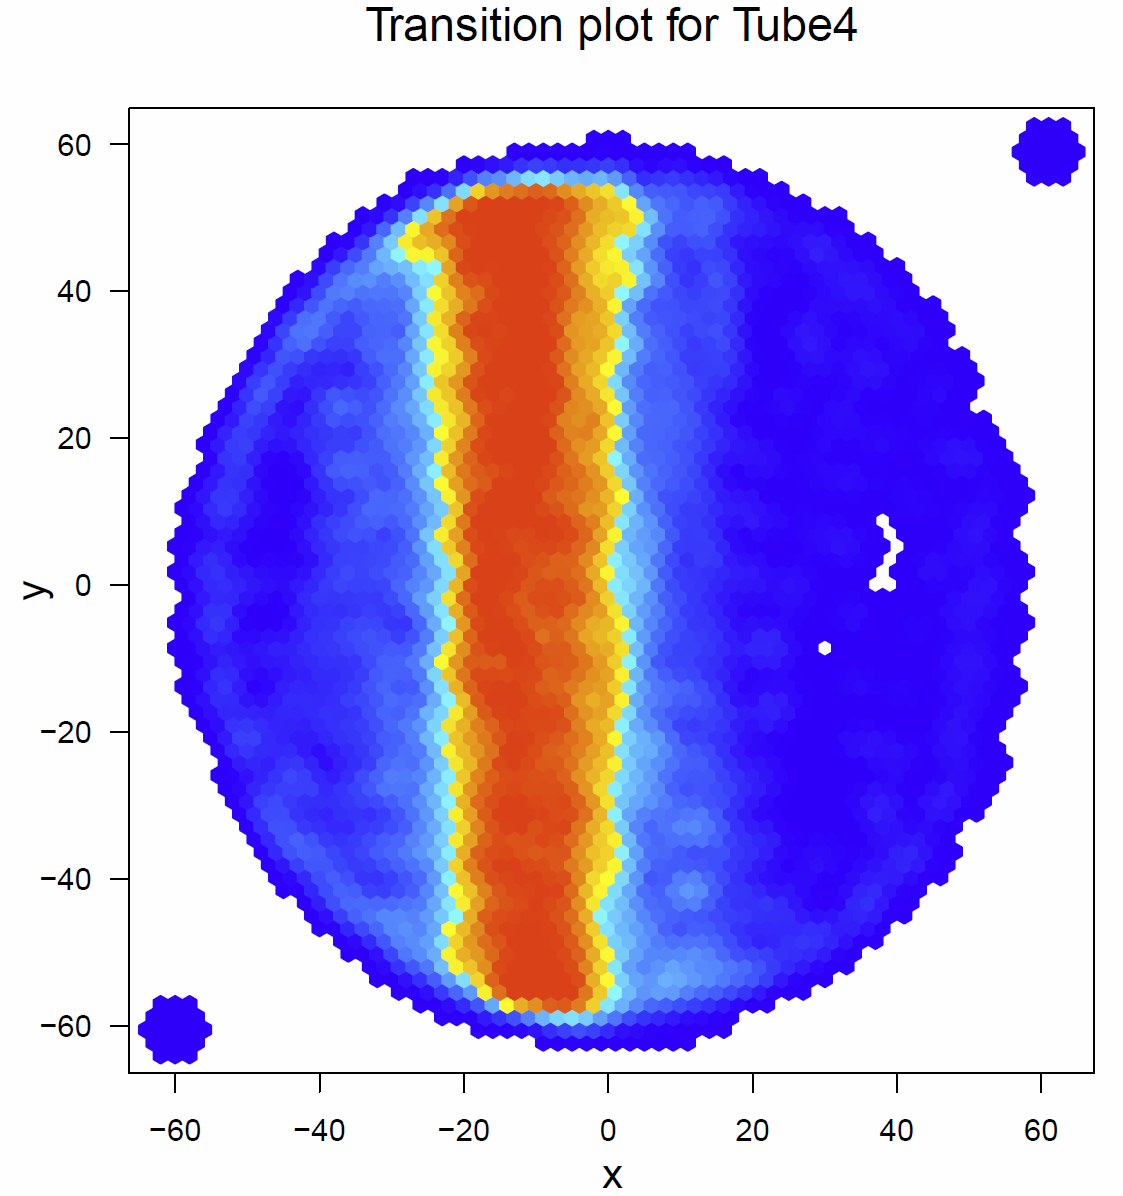
Fig. 5 Transitionplot for tube 4
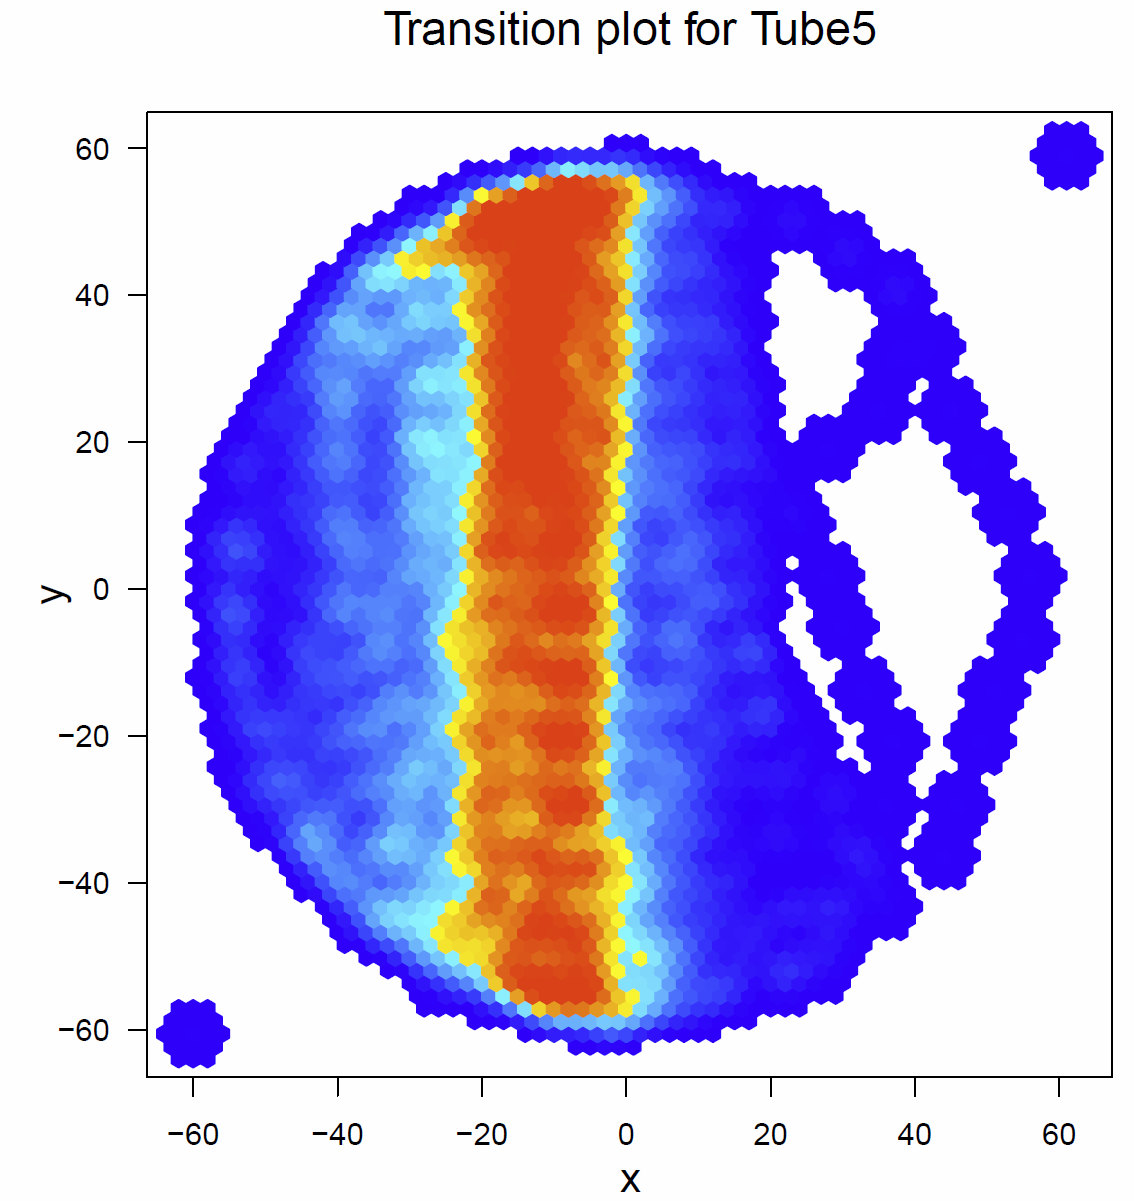
Fig. 6 Transitionplot for tube 5
In addition I had a look on the activitytime per minute (Fig.7+8), the distance traveled per minute (Fig.9), the pause duration and lengh (Fig.10+11), the number of pauses (Fig.12+13) and the median speed (Fig.14). All activity metrics were calculated in two different ways, the first computation (time-threshold: TT) considers every movement as activity and every absence of movement lasting longer than 1 s as a pause. The second approach (speed threshold: ST) uses the distance traveled by the fly in a sliding window of 1 second duration, measuring its mean velocity during that second.
The activitytime of the flies of the tubes 1, 2,3 and 5 is very similar, however in the tubes 0 and 4 it seems to be more elevated. (Fig. 7+8) If we compare these results to the traveled distance (Fig. 9) we see that tubes 4 shows a higher distance as well, tube 0, in this case, is more similar to the tubes 1, 2,3 and 5. For the flies of tube 4 this can be explained by the pause duration and the number of pauses per minute (Fig. 10+12+12) because they show less pauses per minute and a slightly reduced duration of this pauses. In addition we see that the median speed (Fig.14) is lower in the flies of the tube 0, the rest of the tubes are quite similar.
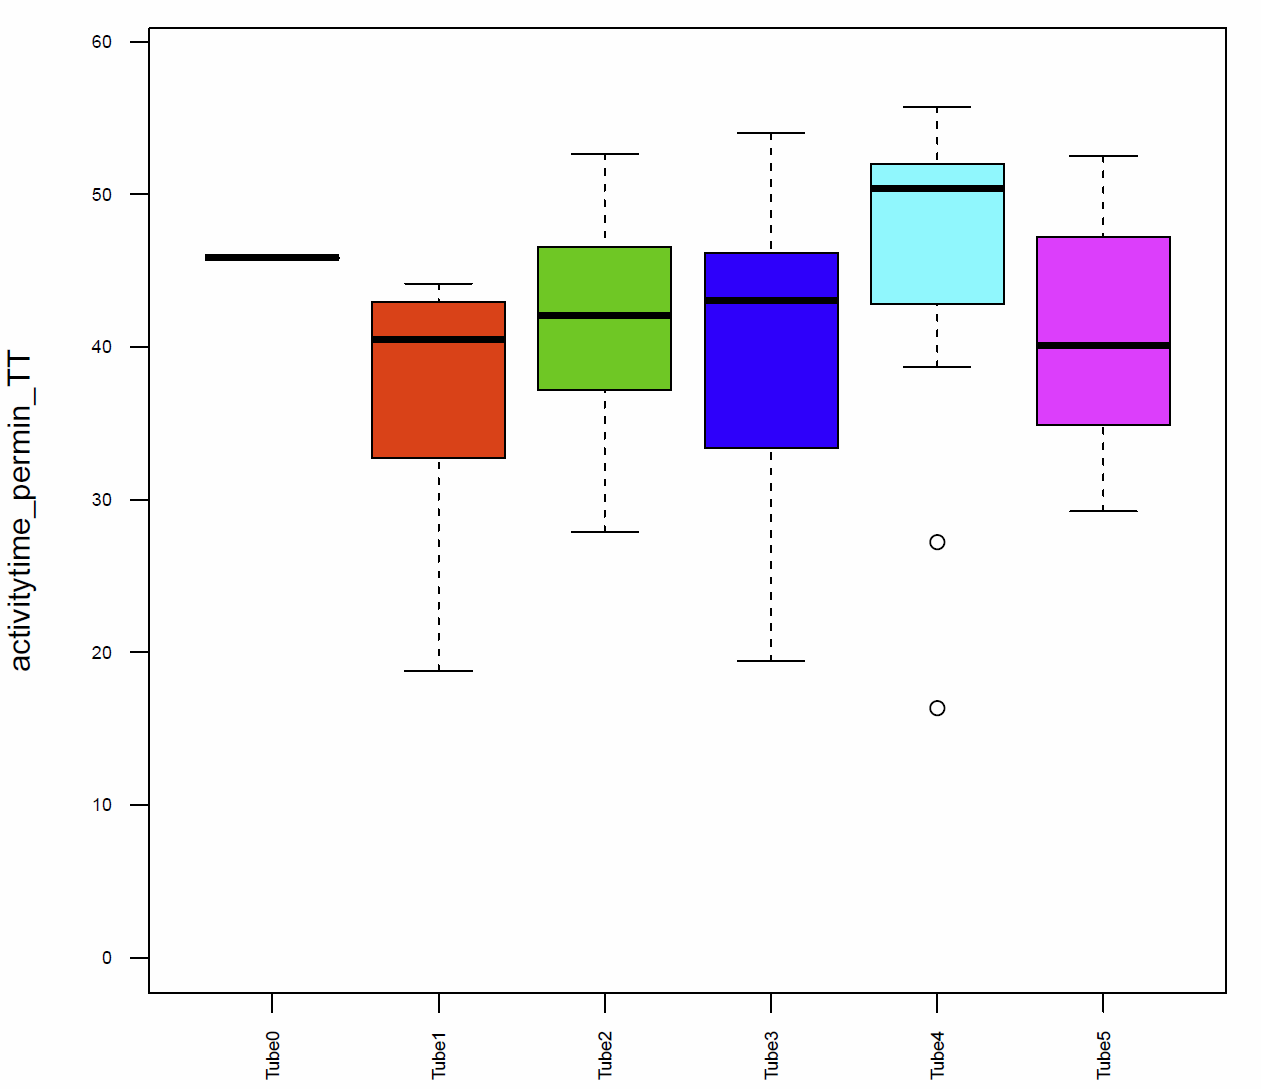
Fig. 7 Activitytime per min TT
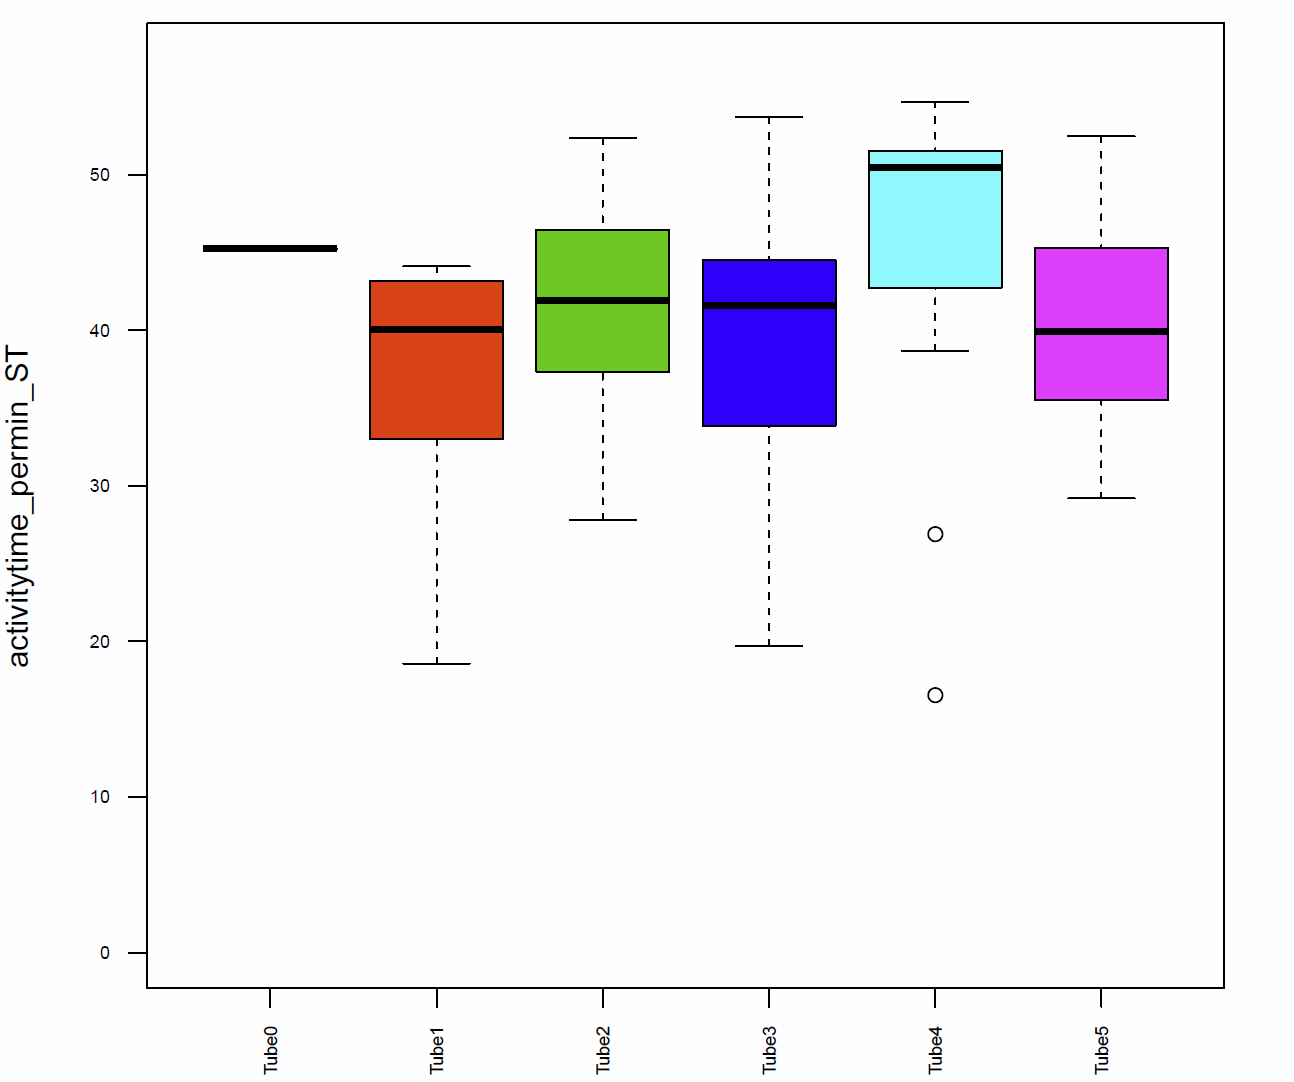
Fig. 8 Activitytime per min ST
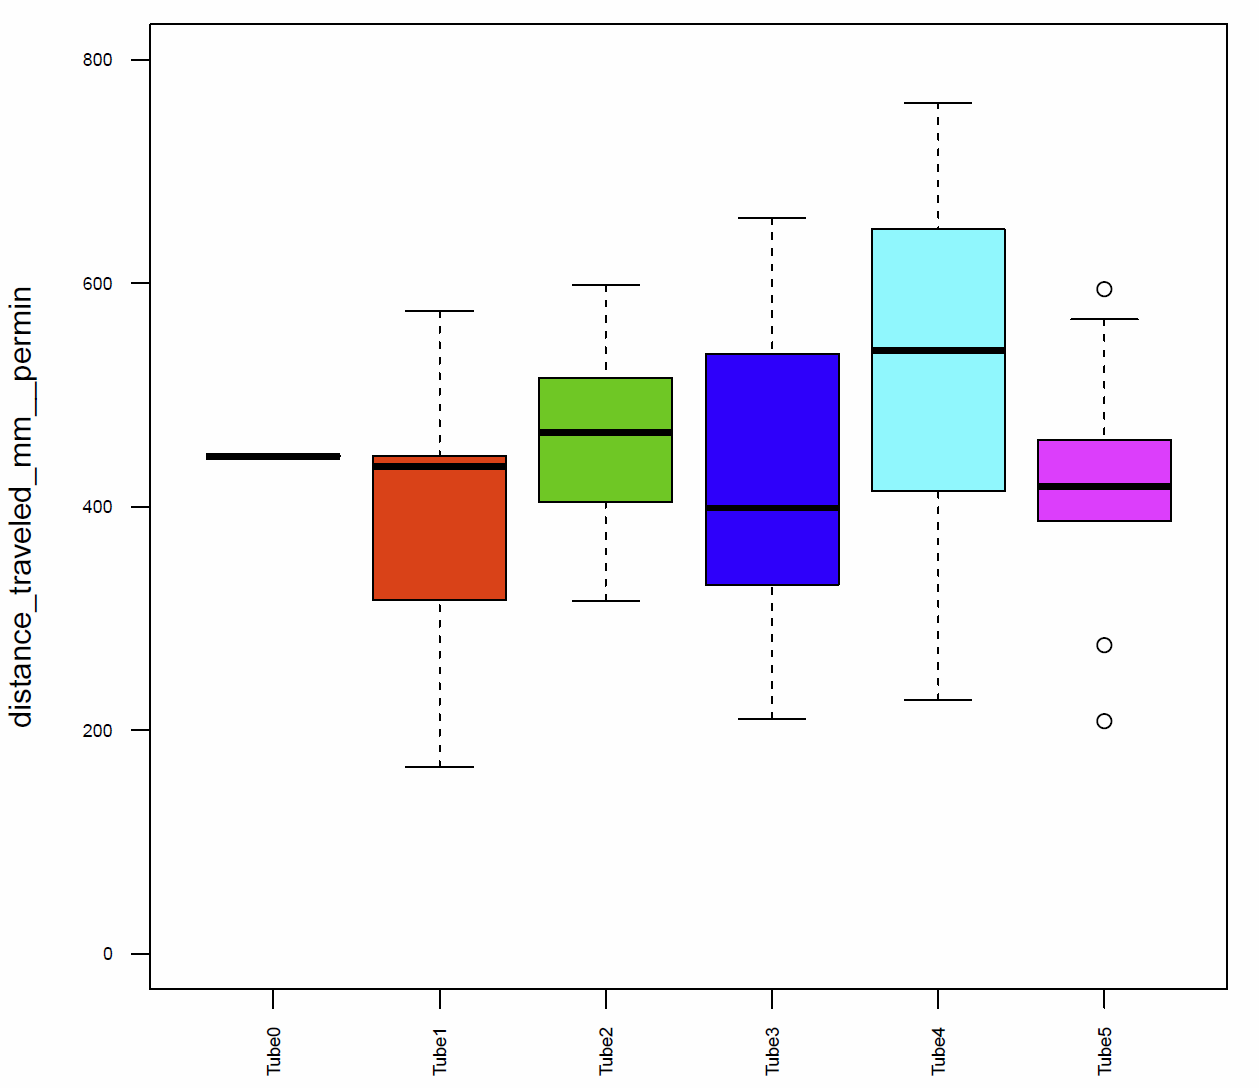
Fig. 9 distance traveled per min
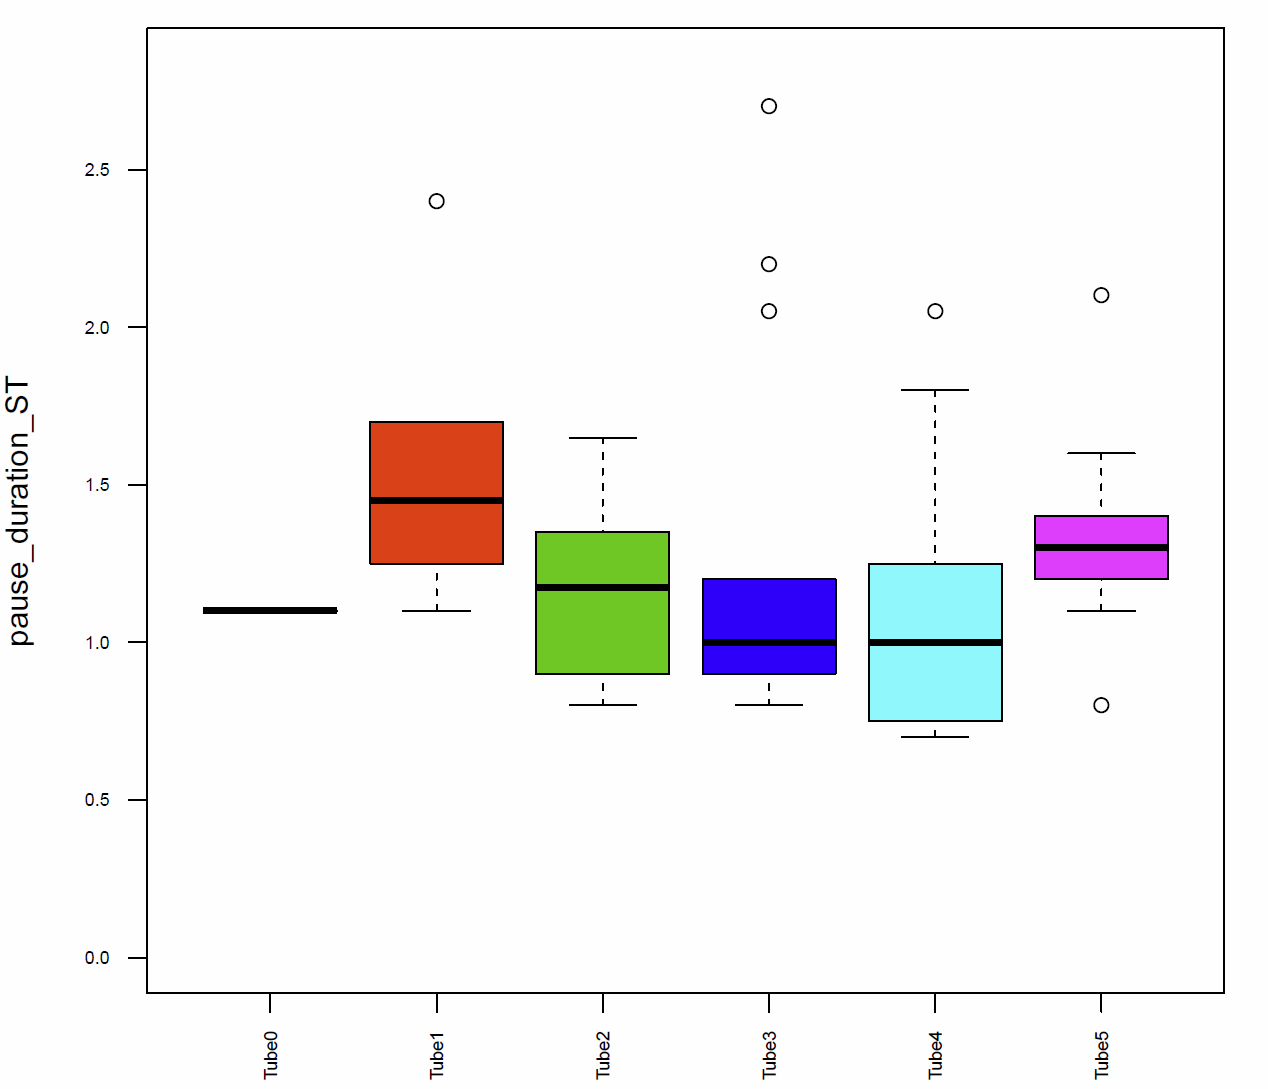
Fig. 10 pause duration ST
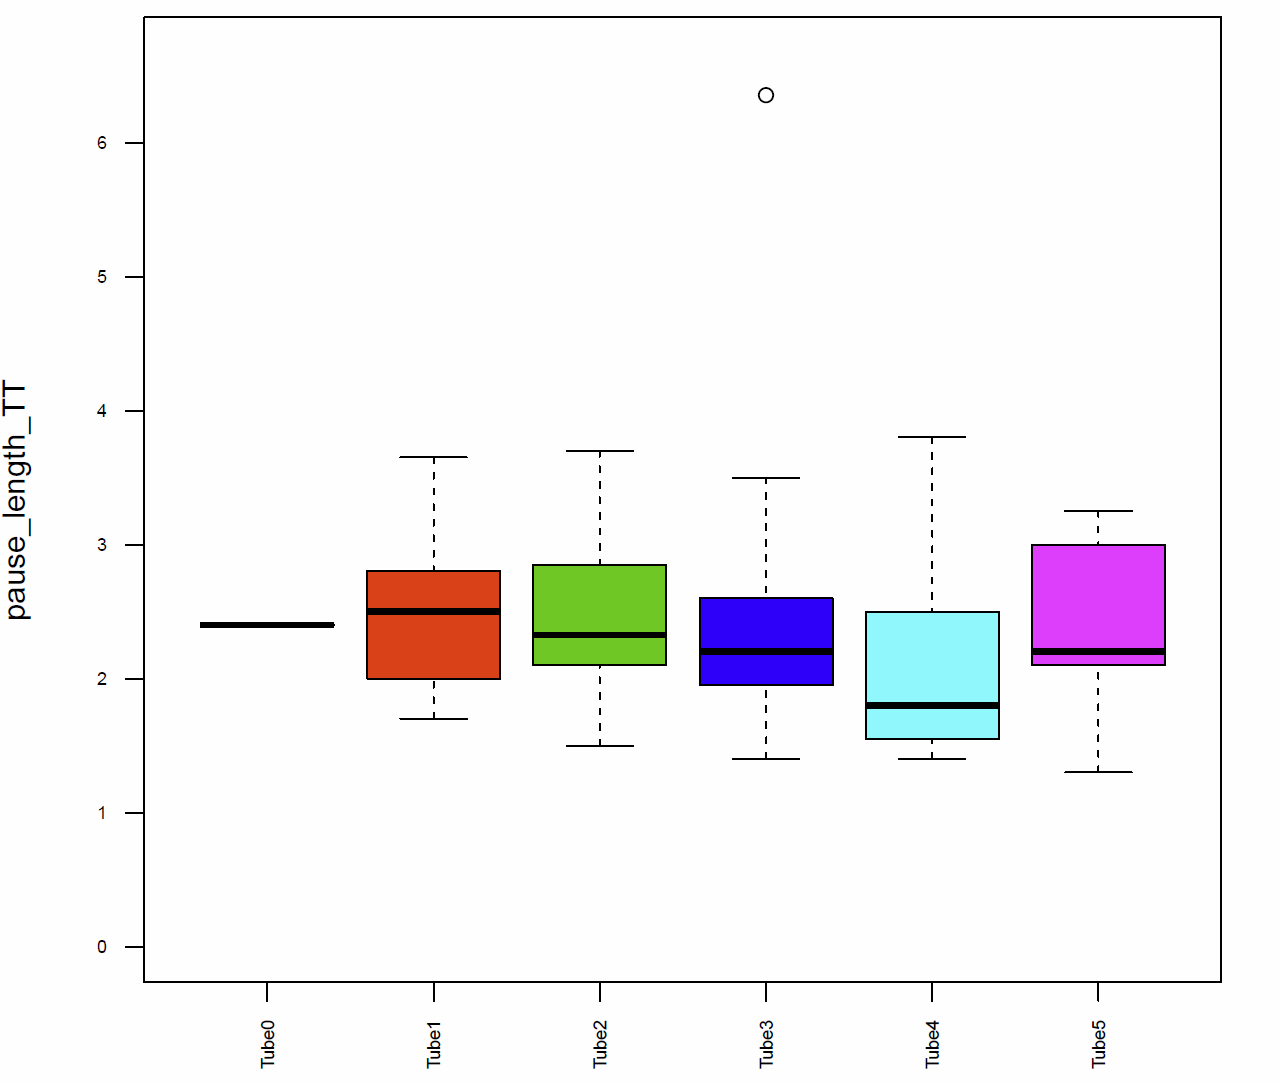
Fig. 11 Pause lengh TT
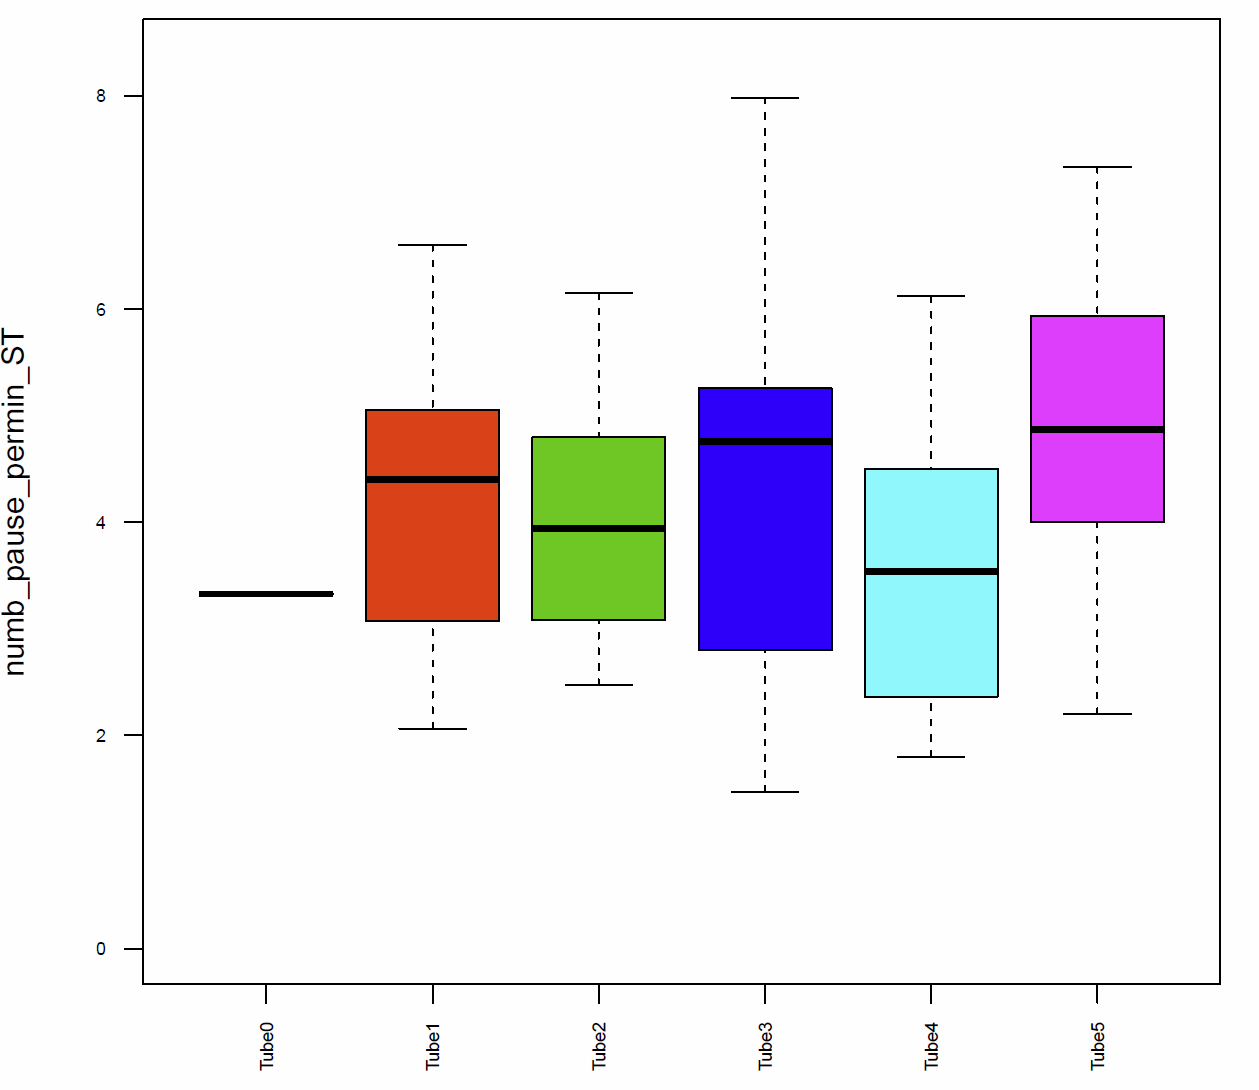
Fig. 12 number of pauses per min ST
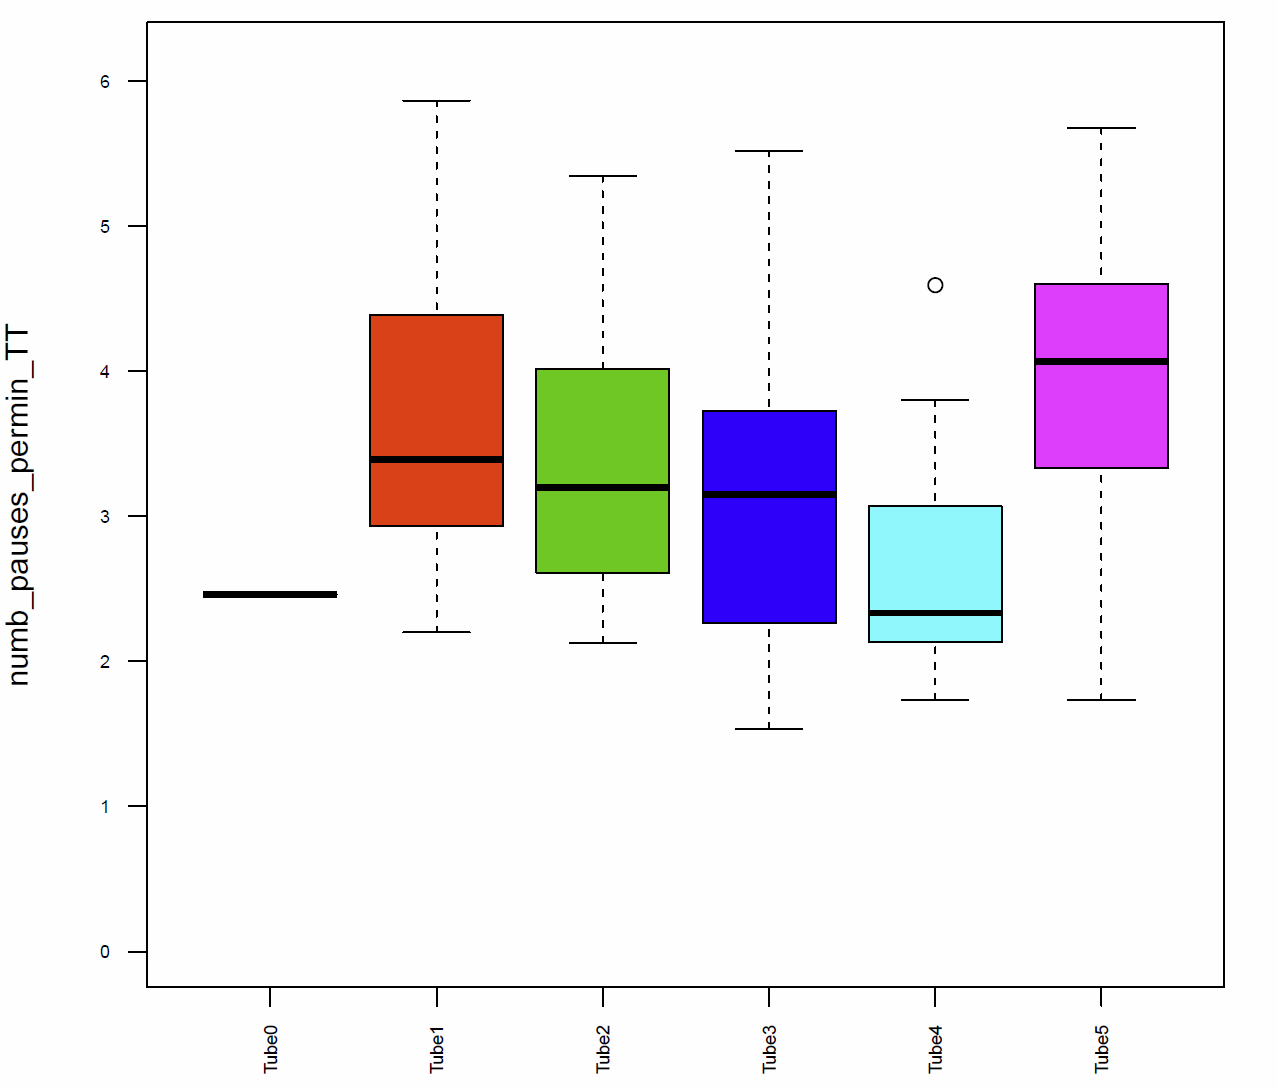
Fig. 13 number of pauses per min TT
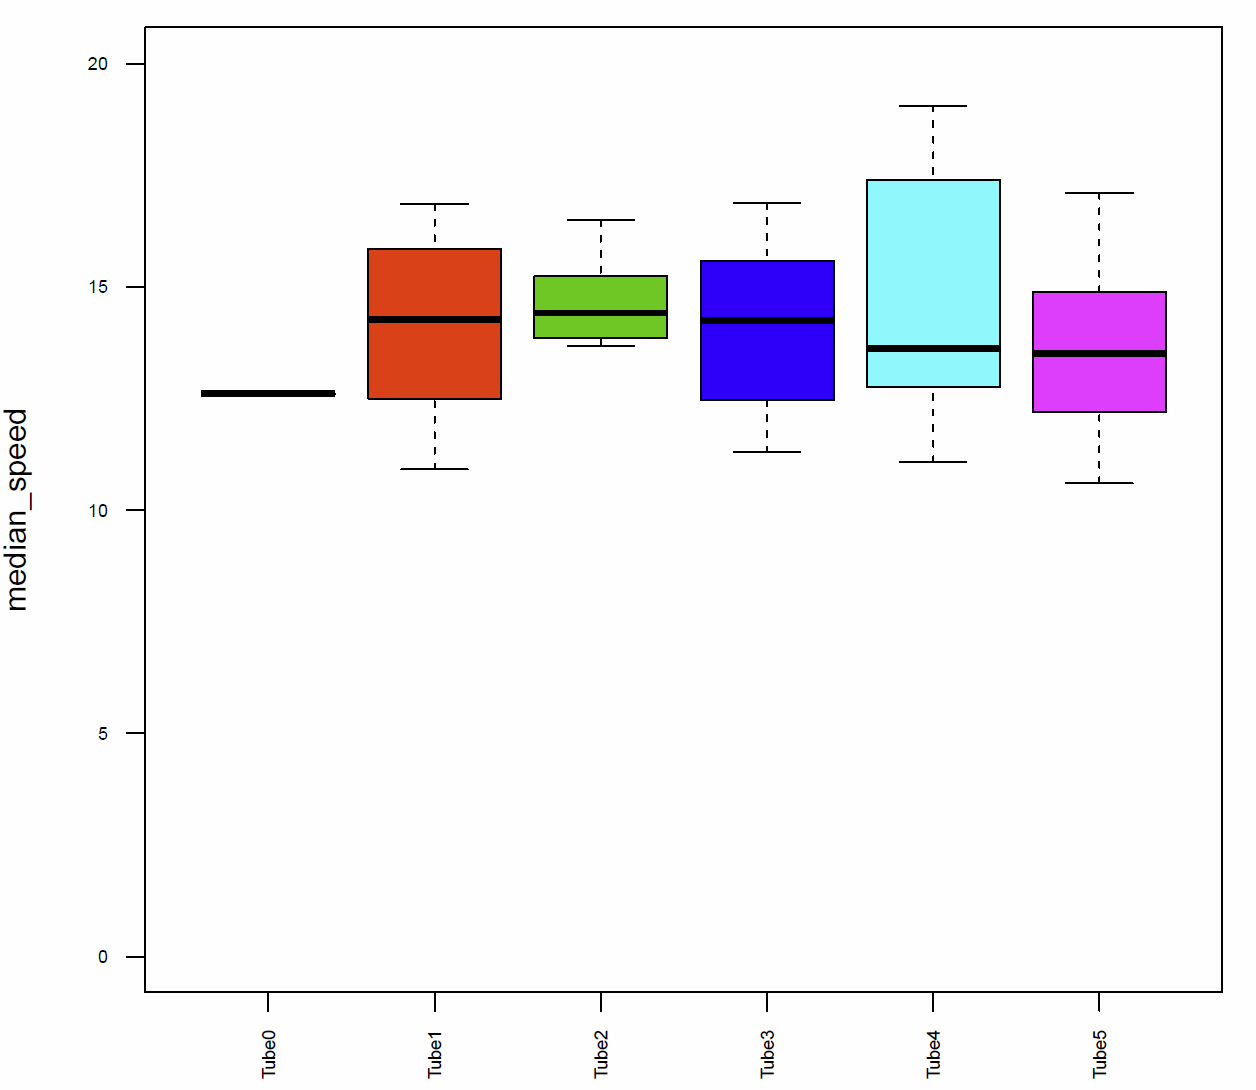
Fig. 14 median speed
Variability of Phototaxis 3
In the previous experiment we saw that testing tubes 5 and 4 together show almost the same distribution than the first round of the benzer paradigm used to split them, however the tubes 3 to 0 together showed a big change. I decided to test single tubes, to see how big the difference between those subgroups actually is. I started by doing the Benzer paradigm to split the group and then I did the Benzer paradigm a second time only using the flies from a particular tube. I wanted to take both extremes, but in the tubes 0-2 there were not many flies. Therefore, I decided to test tubes 5 and 3. Considering that tube 3 had the biggest contribution when tubes 0-3 were tested together, I thought it could be a kind of breaking point of the phototactic behavior.
As you can see in figure 1 there is a significant difference in the proportions between tube 5 and 3. The distribution of the flies in tube 5 are, like in the previous experiment, very similar to the experiment where all flies were tested, which is not the case for tube 3. Also in figure 2, where the variability is shown, it is possible to see a big difference between the distribution of flies of tube 5 and 3, which implies a difference in the behavior of those flies.
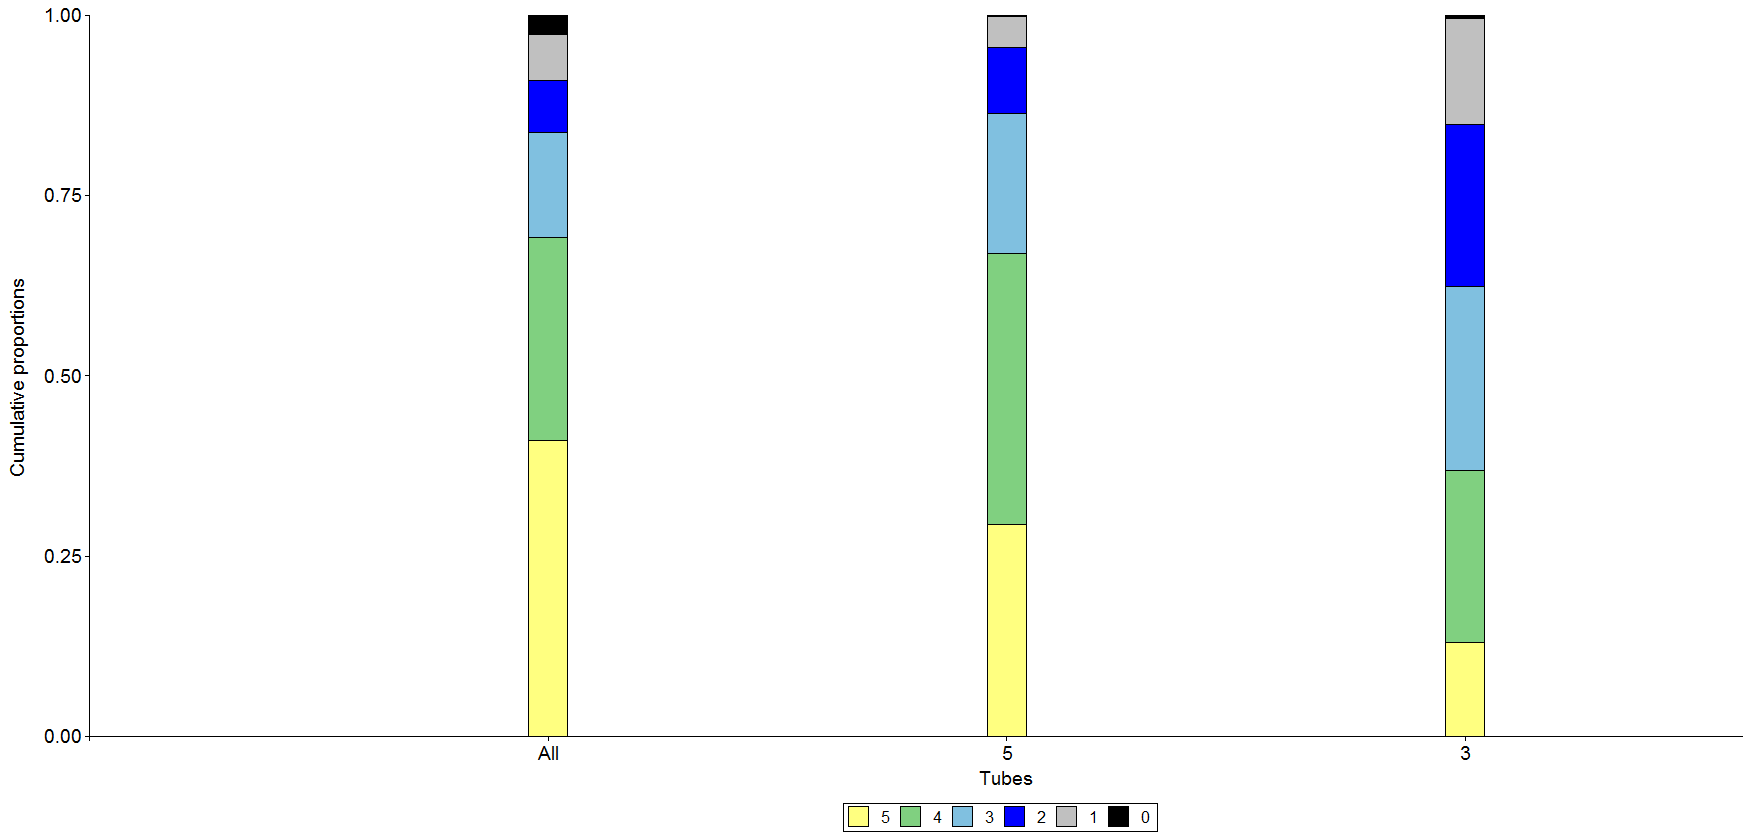
Fig. 1
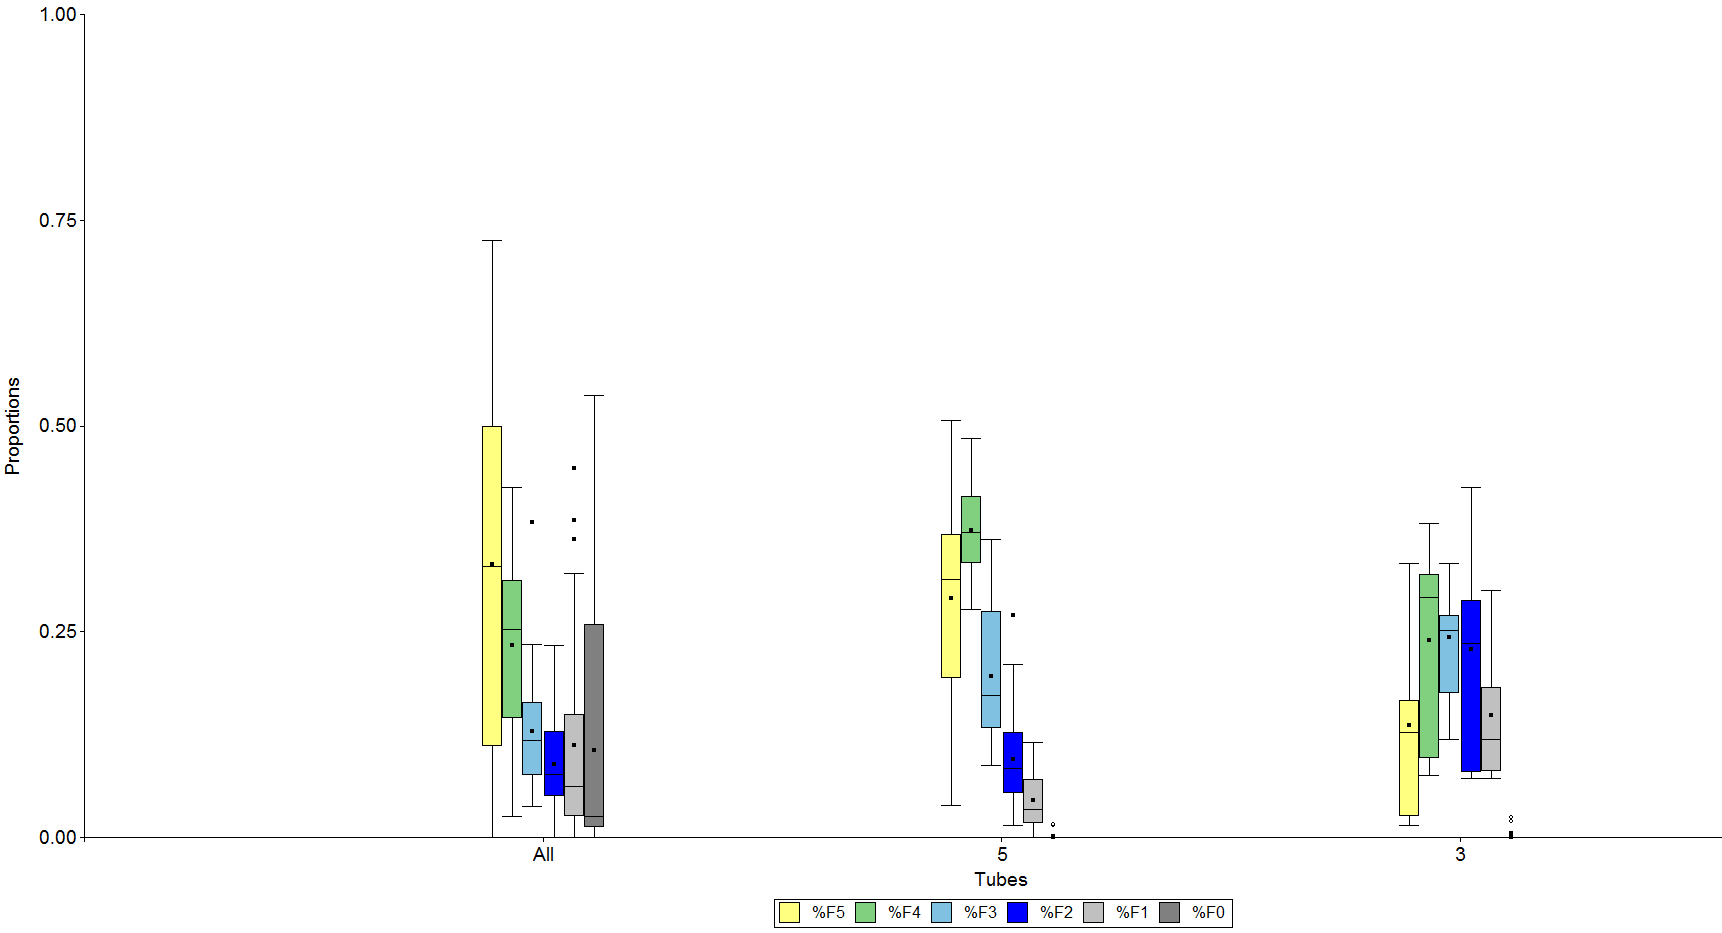
Fig. 2
To complete the Experiment I tested the tubes 4, 2, 1 and 0 (Fig. 3 & 4)
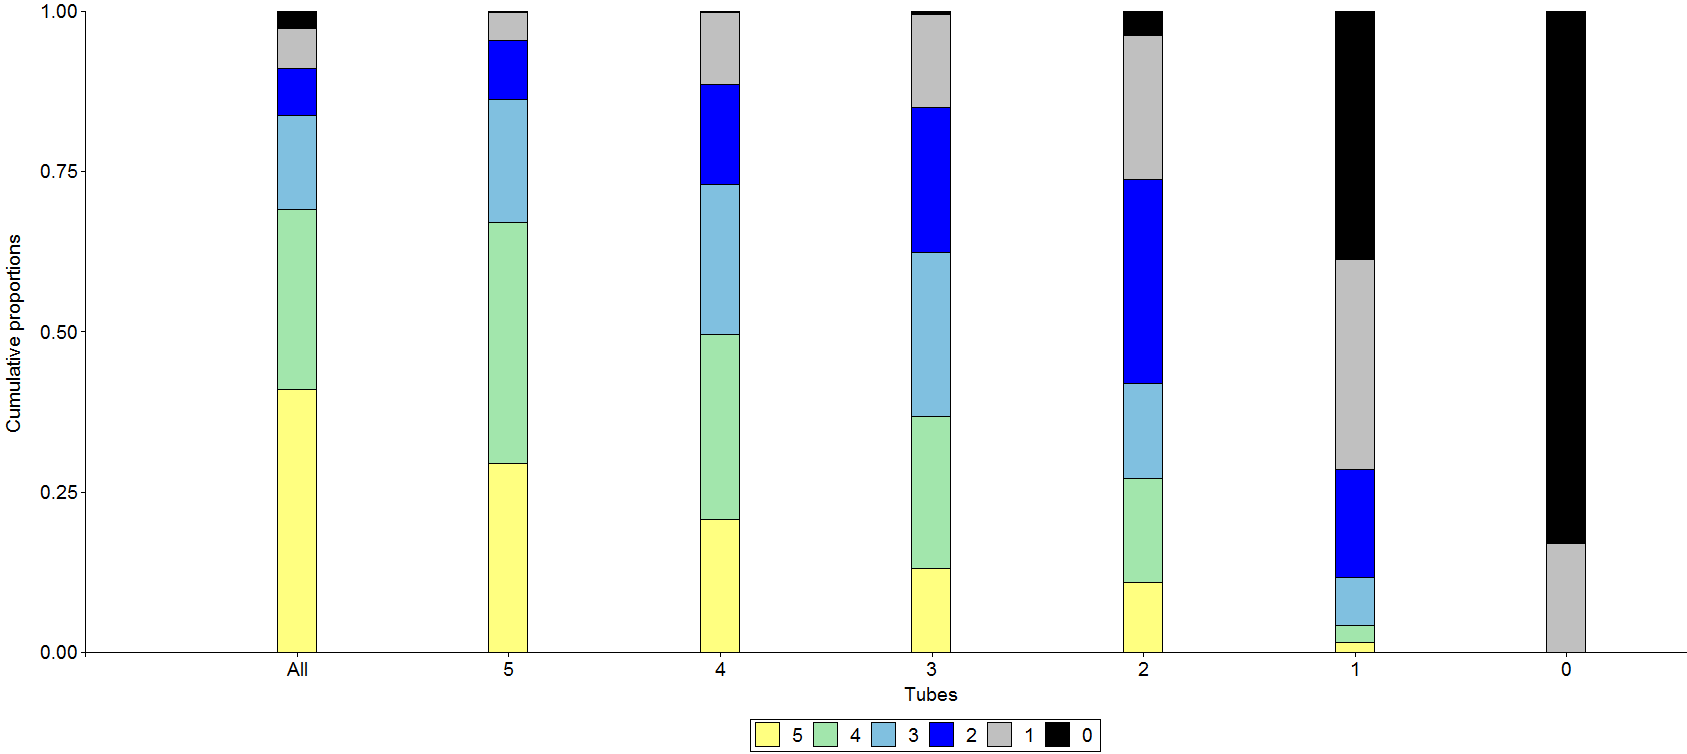
Fig. 3
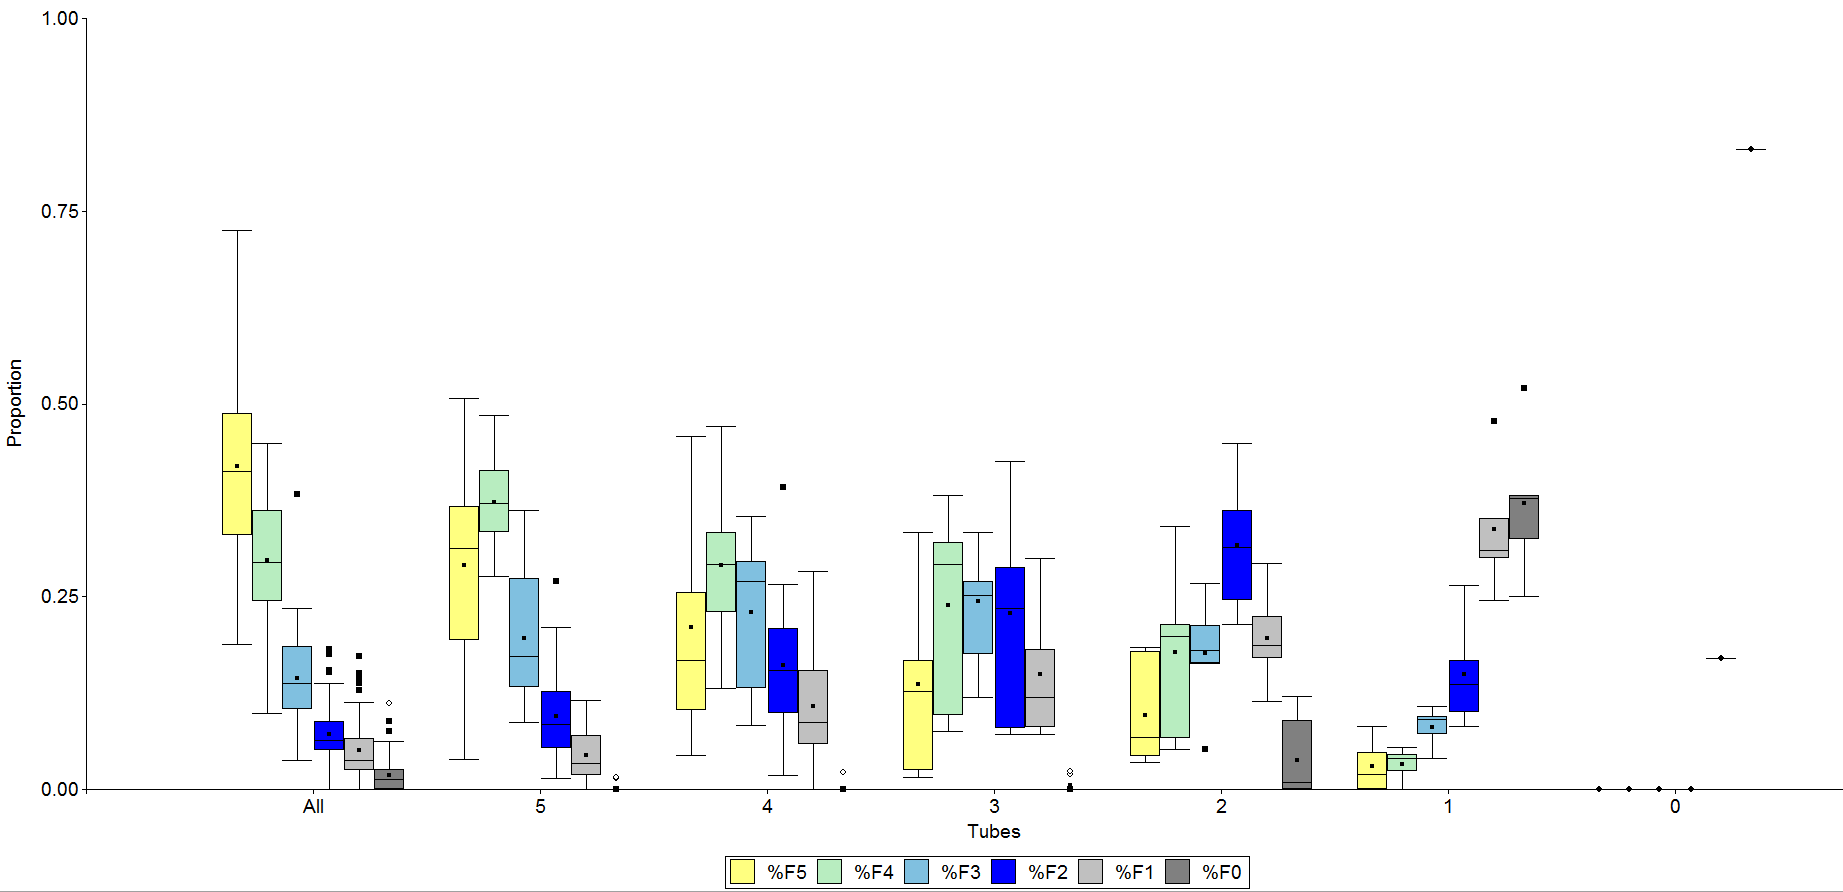
Fig. 4 the corrected graph for the different proportions in all the tubes
Variability of Phototaxis 2
I redid the experiment where I took 8 groups of 80 flies and tested them 4 consecutive days, with the T-maze (Fig. 1) and decided to do a second control to see if the proportions are changing if I repeat the experiment several times the same day. Therefor I used again the Benzer-paradigm and did the same experiment like the one above, but instead of waiting 24 hours the flies were given only 3 hours to recover from the anaesthesia (Fig. 2).
As you can see doing the Experiment a second time has almost no effect, but the proportions change drastically the third time.
After that, I wanted to see if the proportion changed if only subgroups were tested. Therefor I tested again 8 groups with 80 flies. Then, I took tubes 5 and 4, and tubes 3-0 and tested them again after 24h hours of recovery (Fig. 3). Afterwards I did the same thing with 3 hours of recovery with a different group of flies (Fig.4).
In both cases there were almost no differences in the proportions between the experiment in which all flies were used and the experiment in which only the tubes 5 and 4 were used. Surprisingly, there is a big change in the proportions if only tubes 3-0 are tested.
Then I did the same experiment with the T-maze. After 24 hours of recovery I took the flies who went to the light and tested them again. I did the same thing with the ones who went to the dark and the elevator (Fig.5), but I had to test these two groups of flies together because otherwise there wouldn’t have been enough flies to reach the threshold of 40 flies. Like in the experiments above, the proportions when only flies that went to the light were tested were similar to the original proportions. However, in this case the flies who went to the dark and the elevator showed a small difference in the proportions.
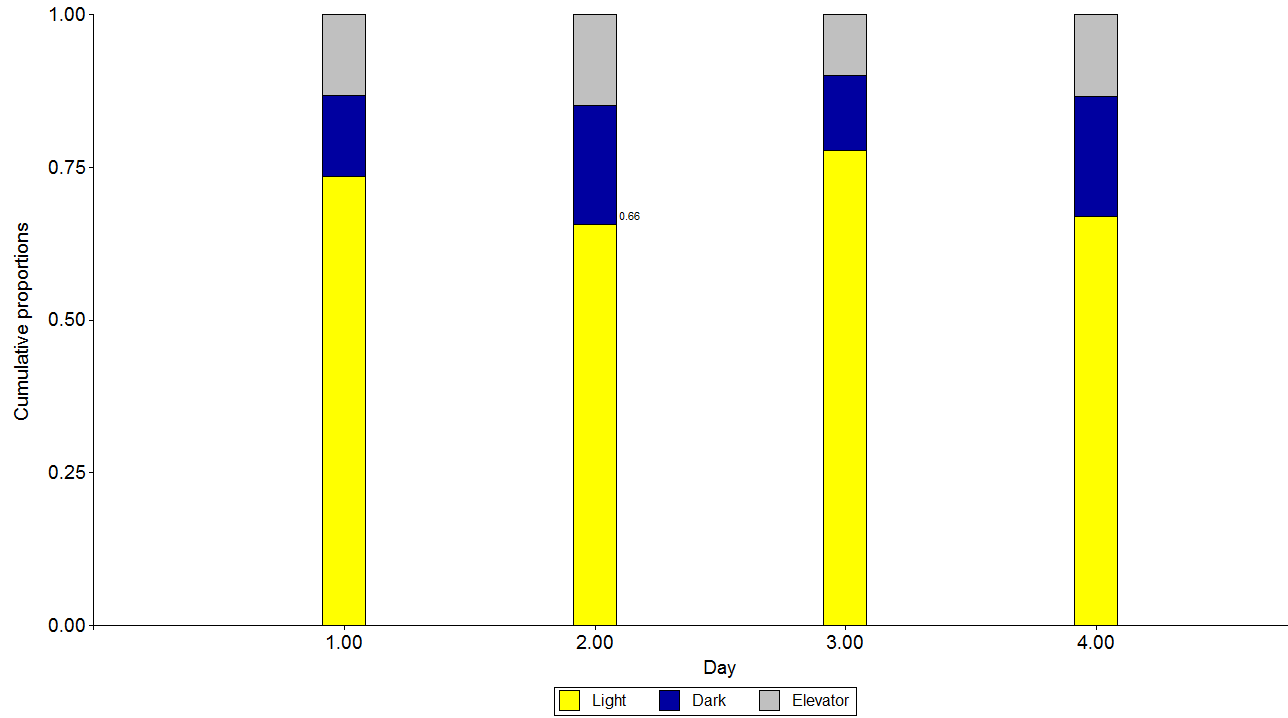
Fig. 1
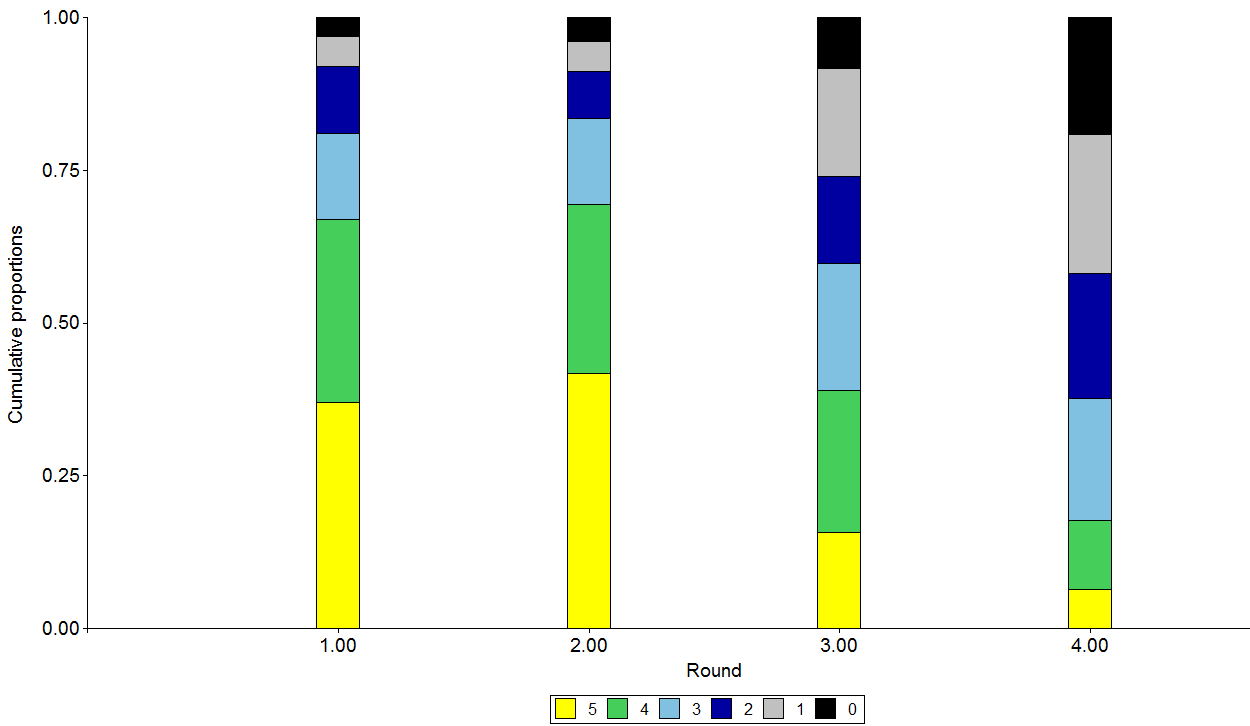
Fig.2
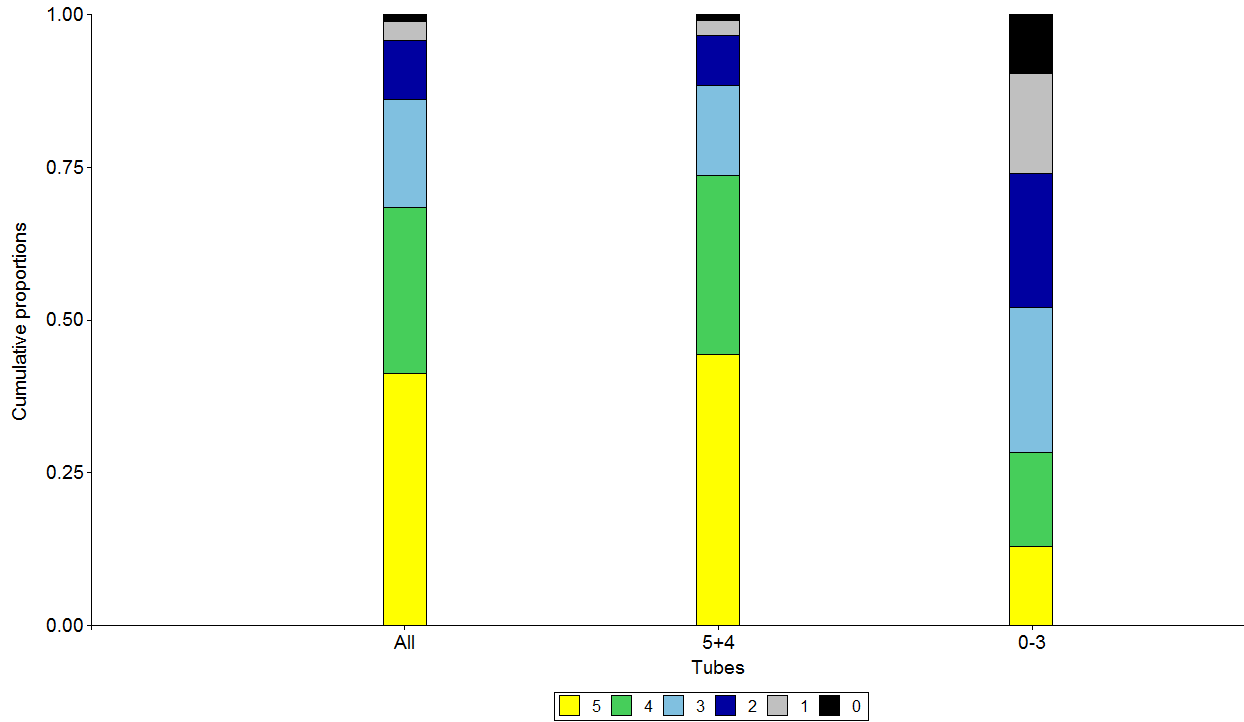
Fig.3
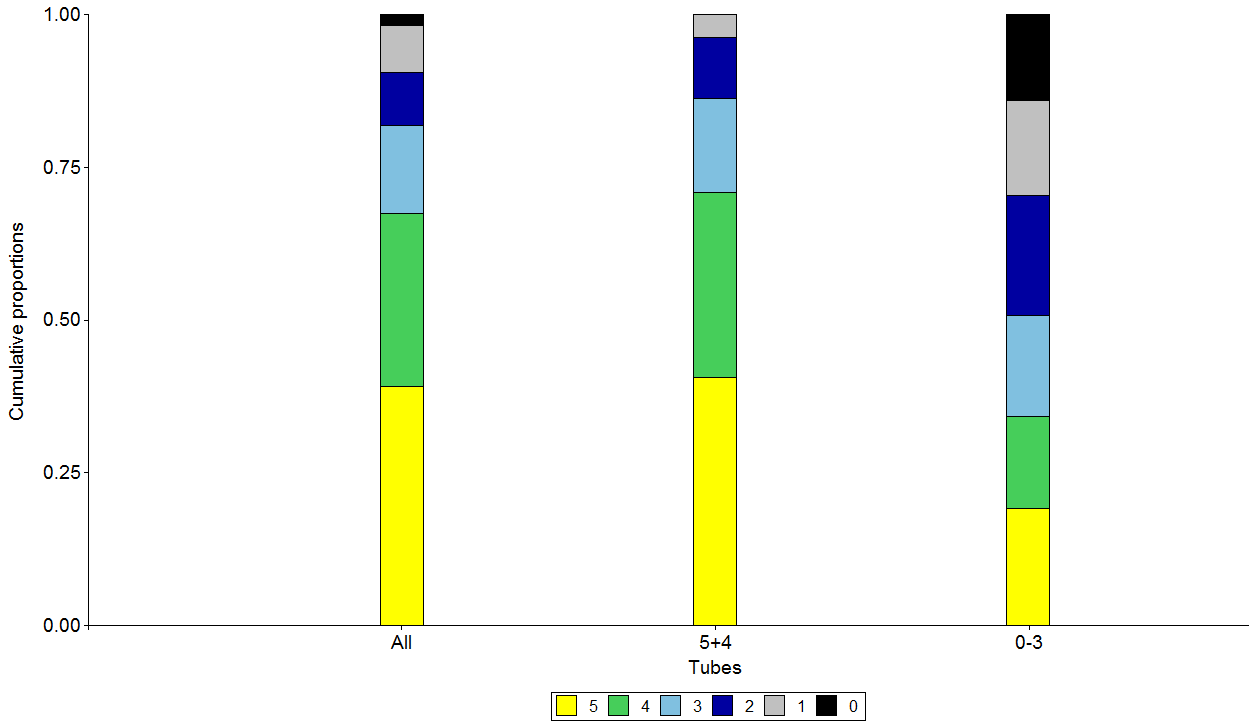
Fig.4
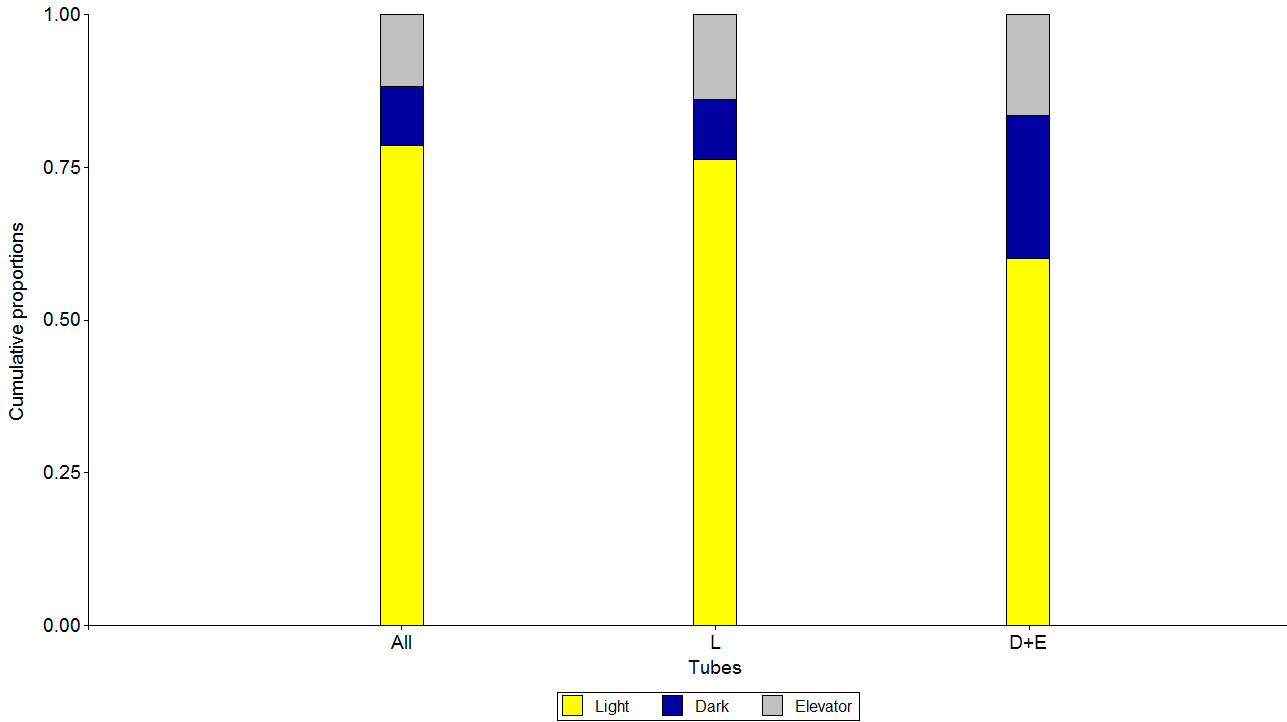
Fig.5
This is the new dataset with the final number of flies for the experiment above. (Fig. 6+7)
Additionally I did the corresponding boxplots to show the variability of the proportions (Fig. 8+9)
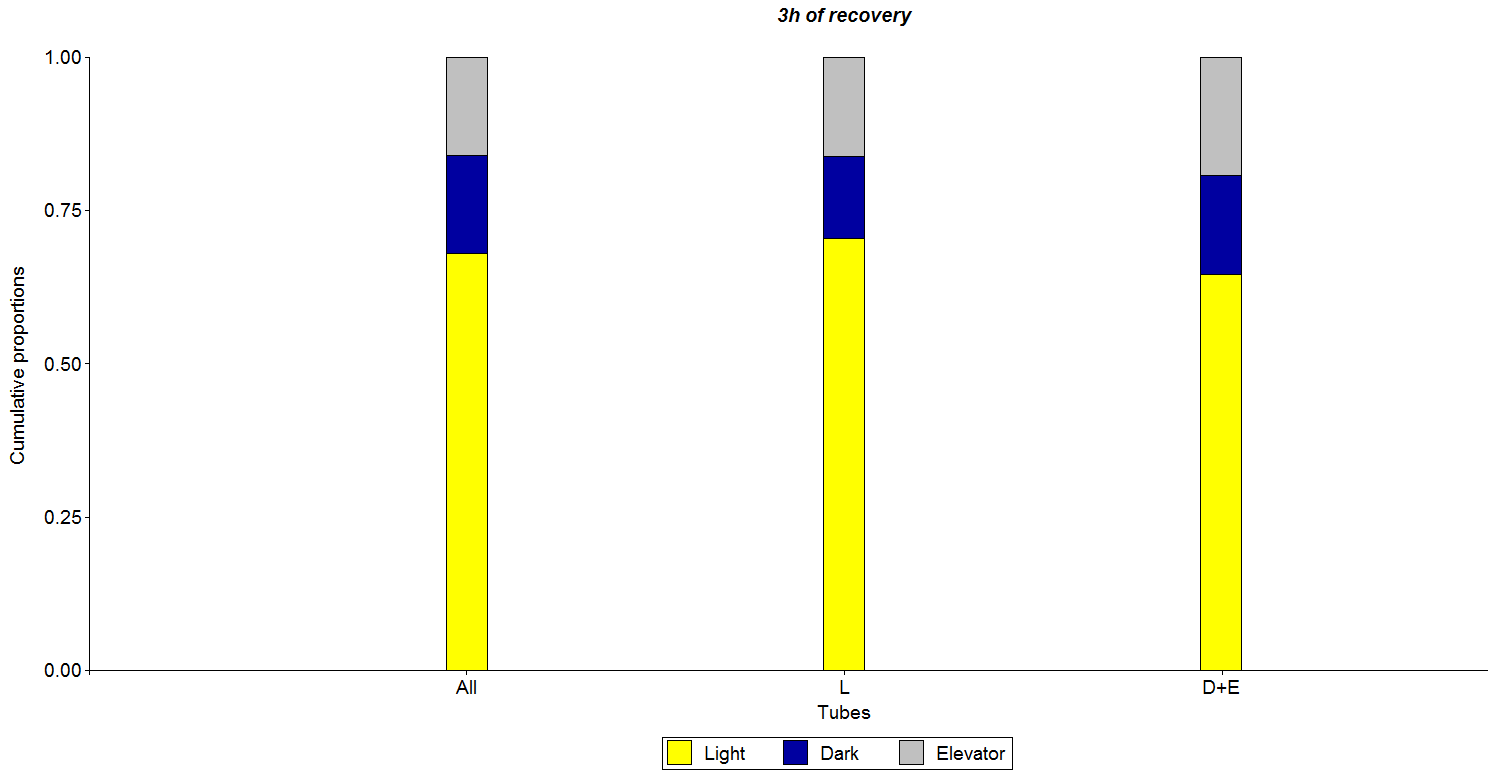
Fig. 6
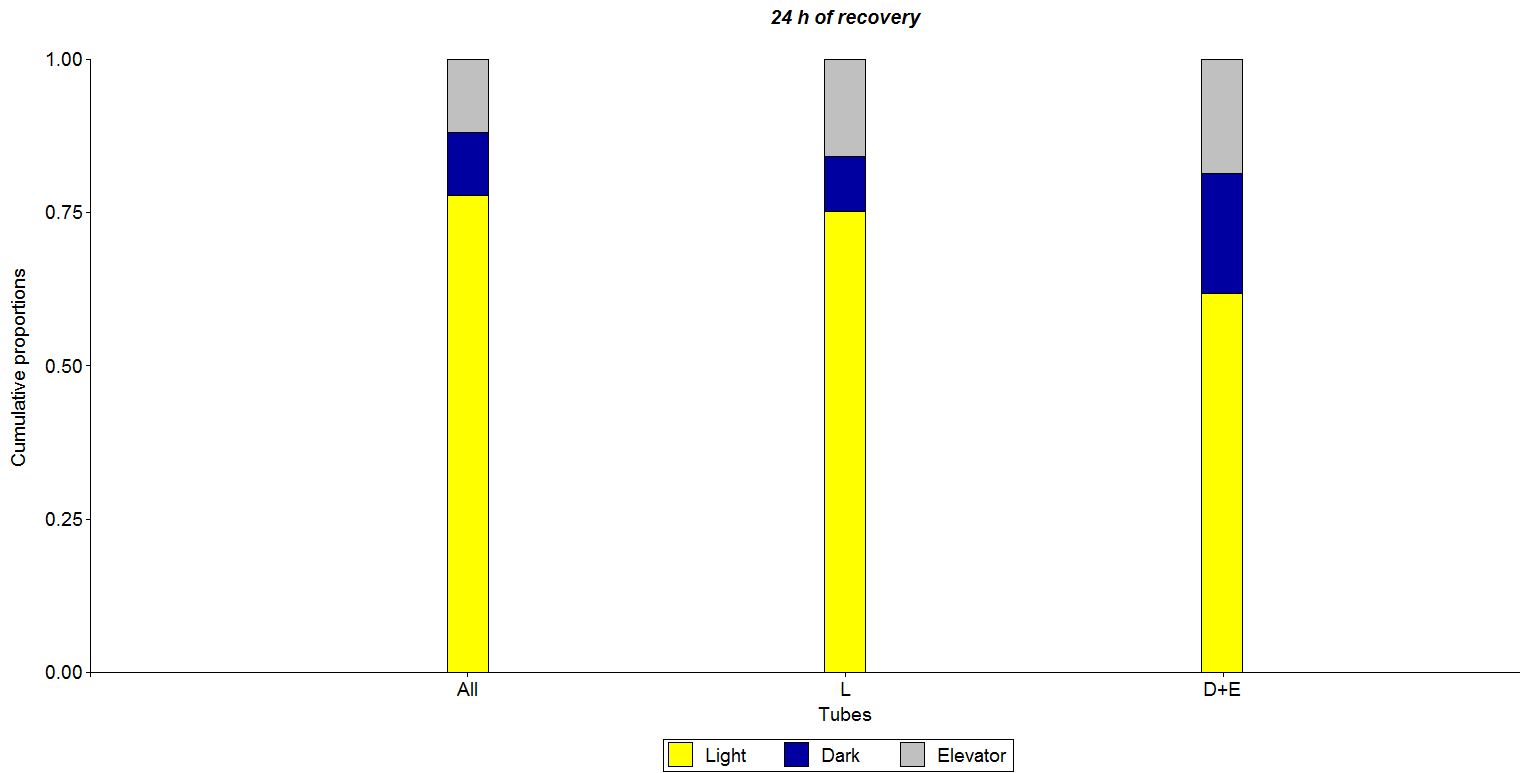
Fig. 7
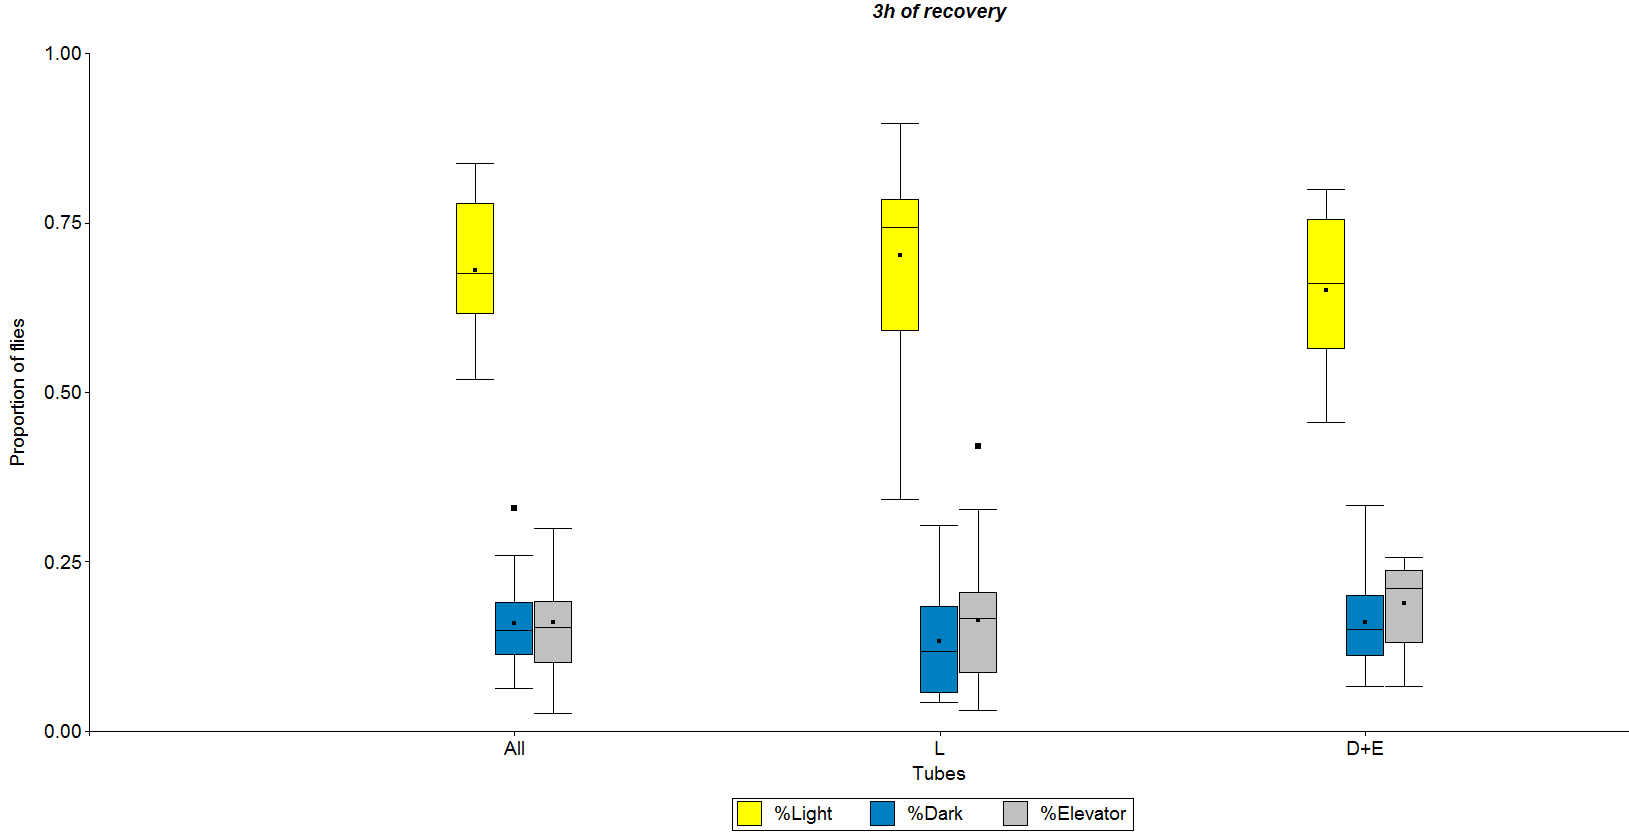
Fig. 8
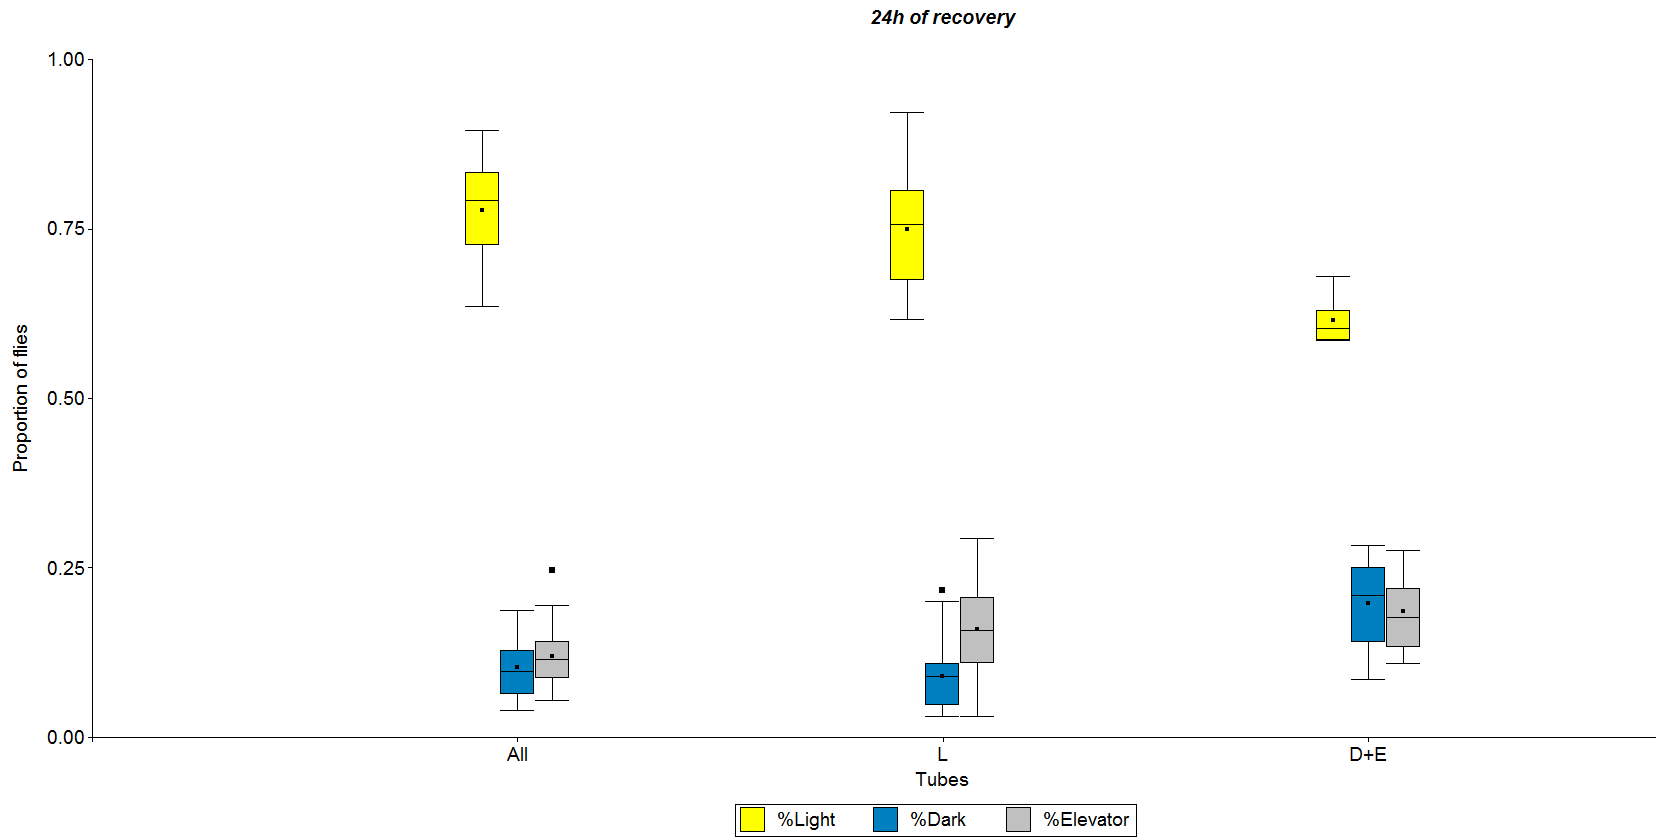
Fig. 9
Variability of Phototaxis
For the project variability of phototaxis I started in the first experiment by determining the adequate amount of flies for the following tests. Therefor I used the Benzer paradigm and the T-Maze with five different groups of wild type Berlin flies with normal wings. I repeated them eight times with 20, 40, 60, 80 and 100 flies.
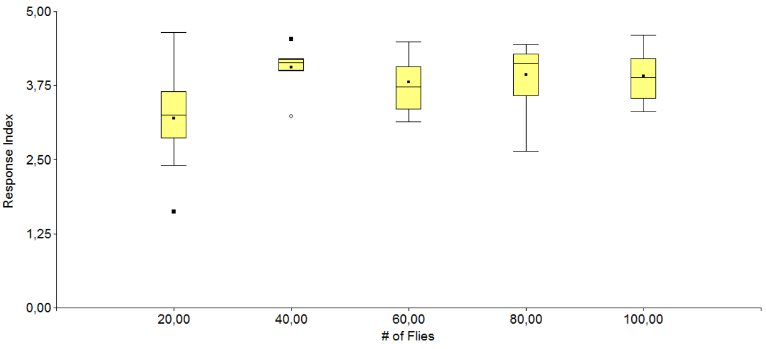
Fig. 1 Different amount of flies in the Benzer
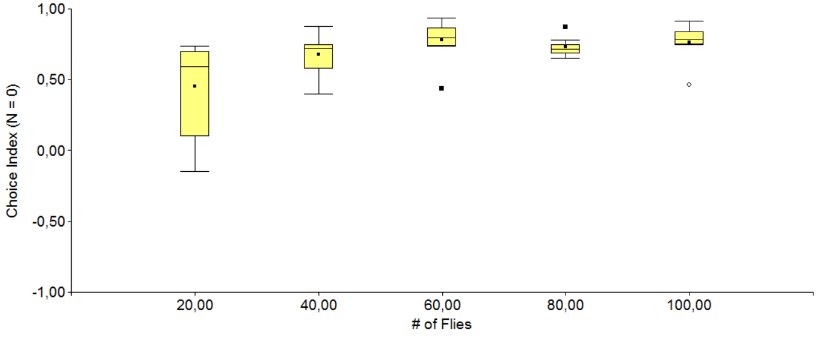
Fig. 2 Different amount of flies in the T-maze
As expected there is a very high variability in the groups with 20 flies, so that they won’t be used in the experiments. The other groups show that the distribution doesn’t change with the amount of flies, so that every group could be used for the experiments. Finally an amount of 80 flies was chosen.
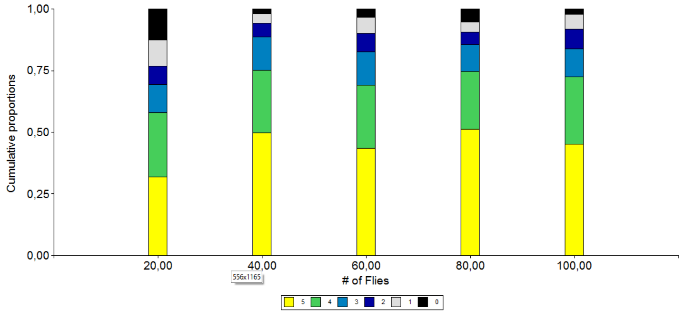
Fig. 3 Proportions Benzer
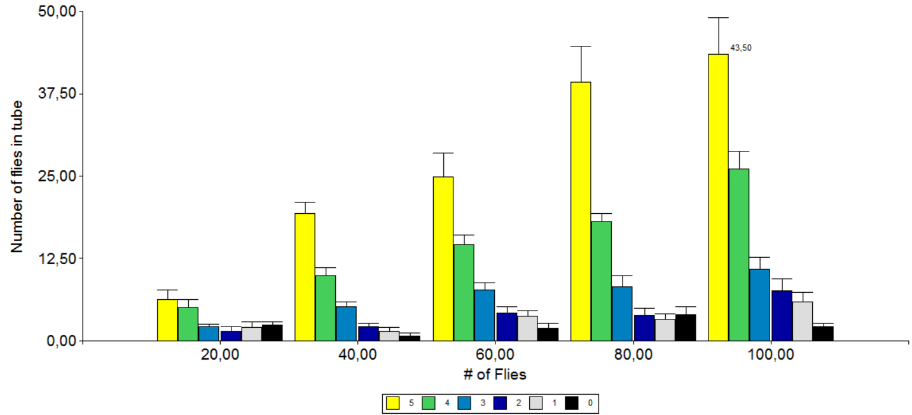
Fig. 4 #flies in Benzer
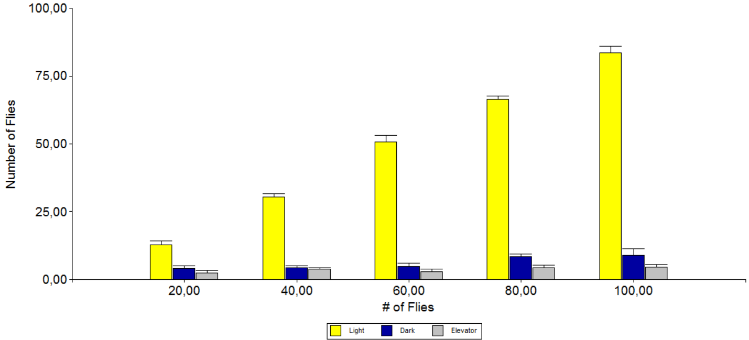
Fig 5. Proportions T-maze
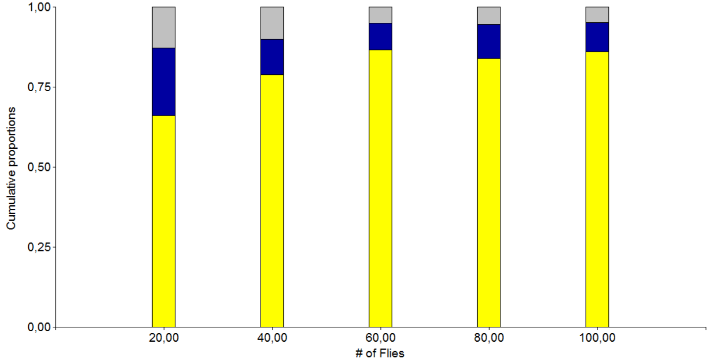
Fig. 6 #flies in t-maze
For the second experiment I took 8 groups of 80 flies and did with them the Benzer-paradigm. Then all the flies were recollected and tested the next day again. This was done overall for 4 Days.
For these experiments the flies were anesthetized with cold to protect them from damage caused by too much CO2.
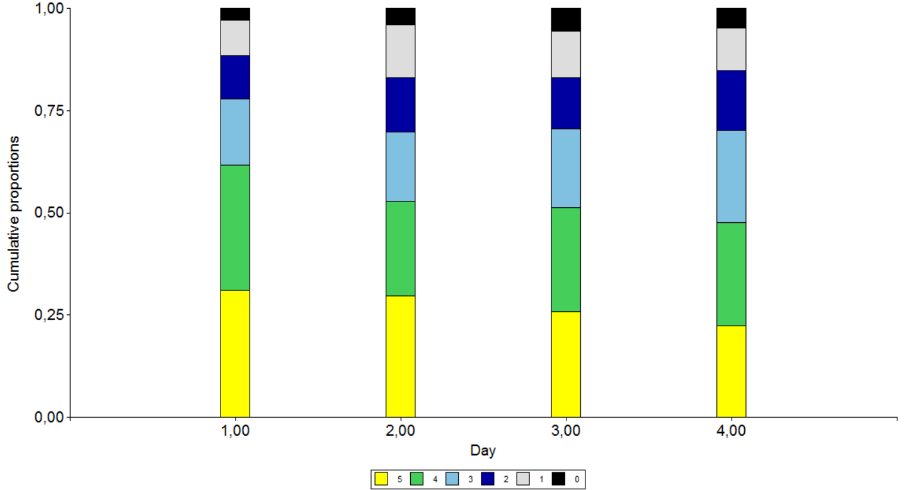
Fig. 7 Proportion & time
The results show clearly that the proportion does not change with the time