Statistical evaluation of OR
on Monday, May 25th, 2020 12:23 | by Anders Eriksson
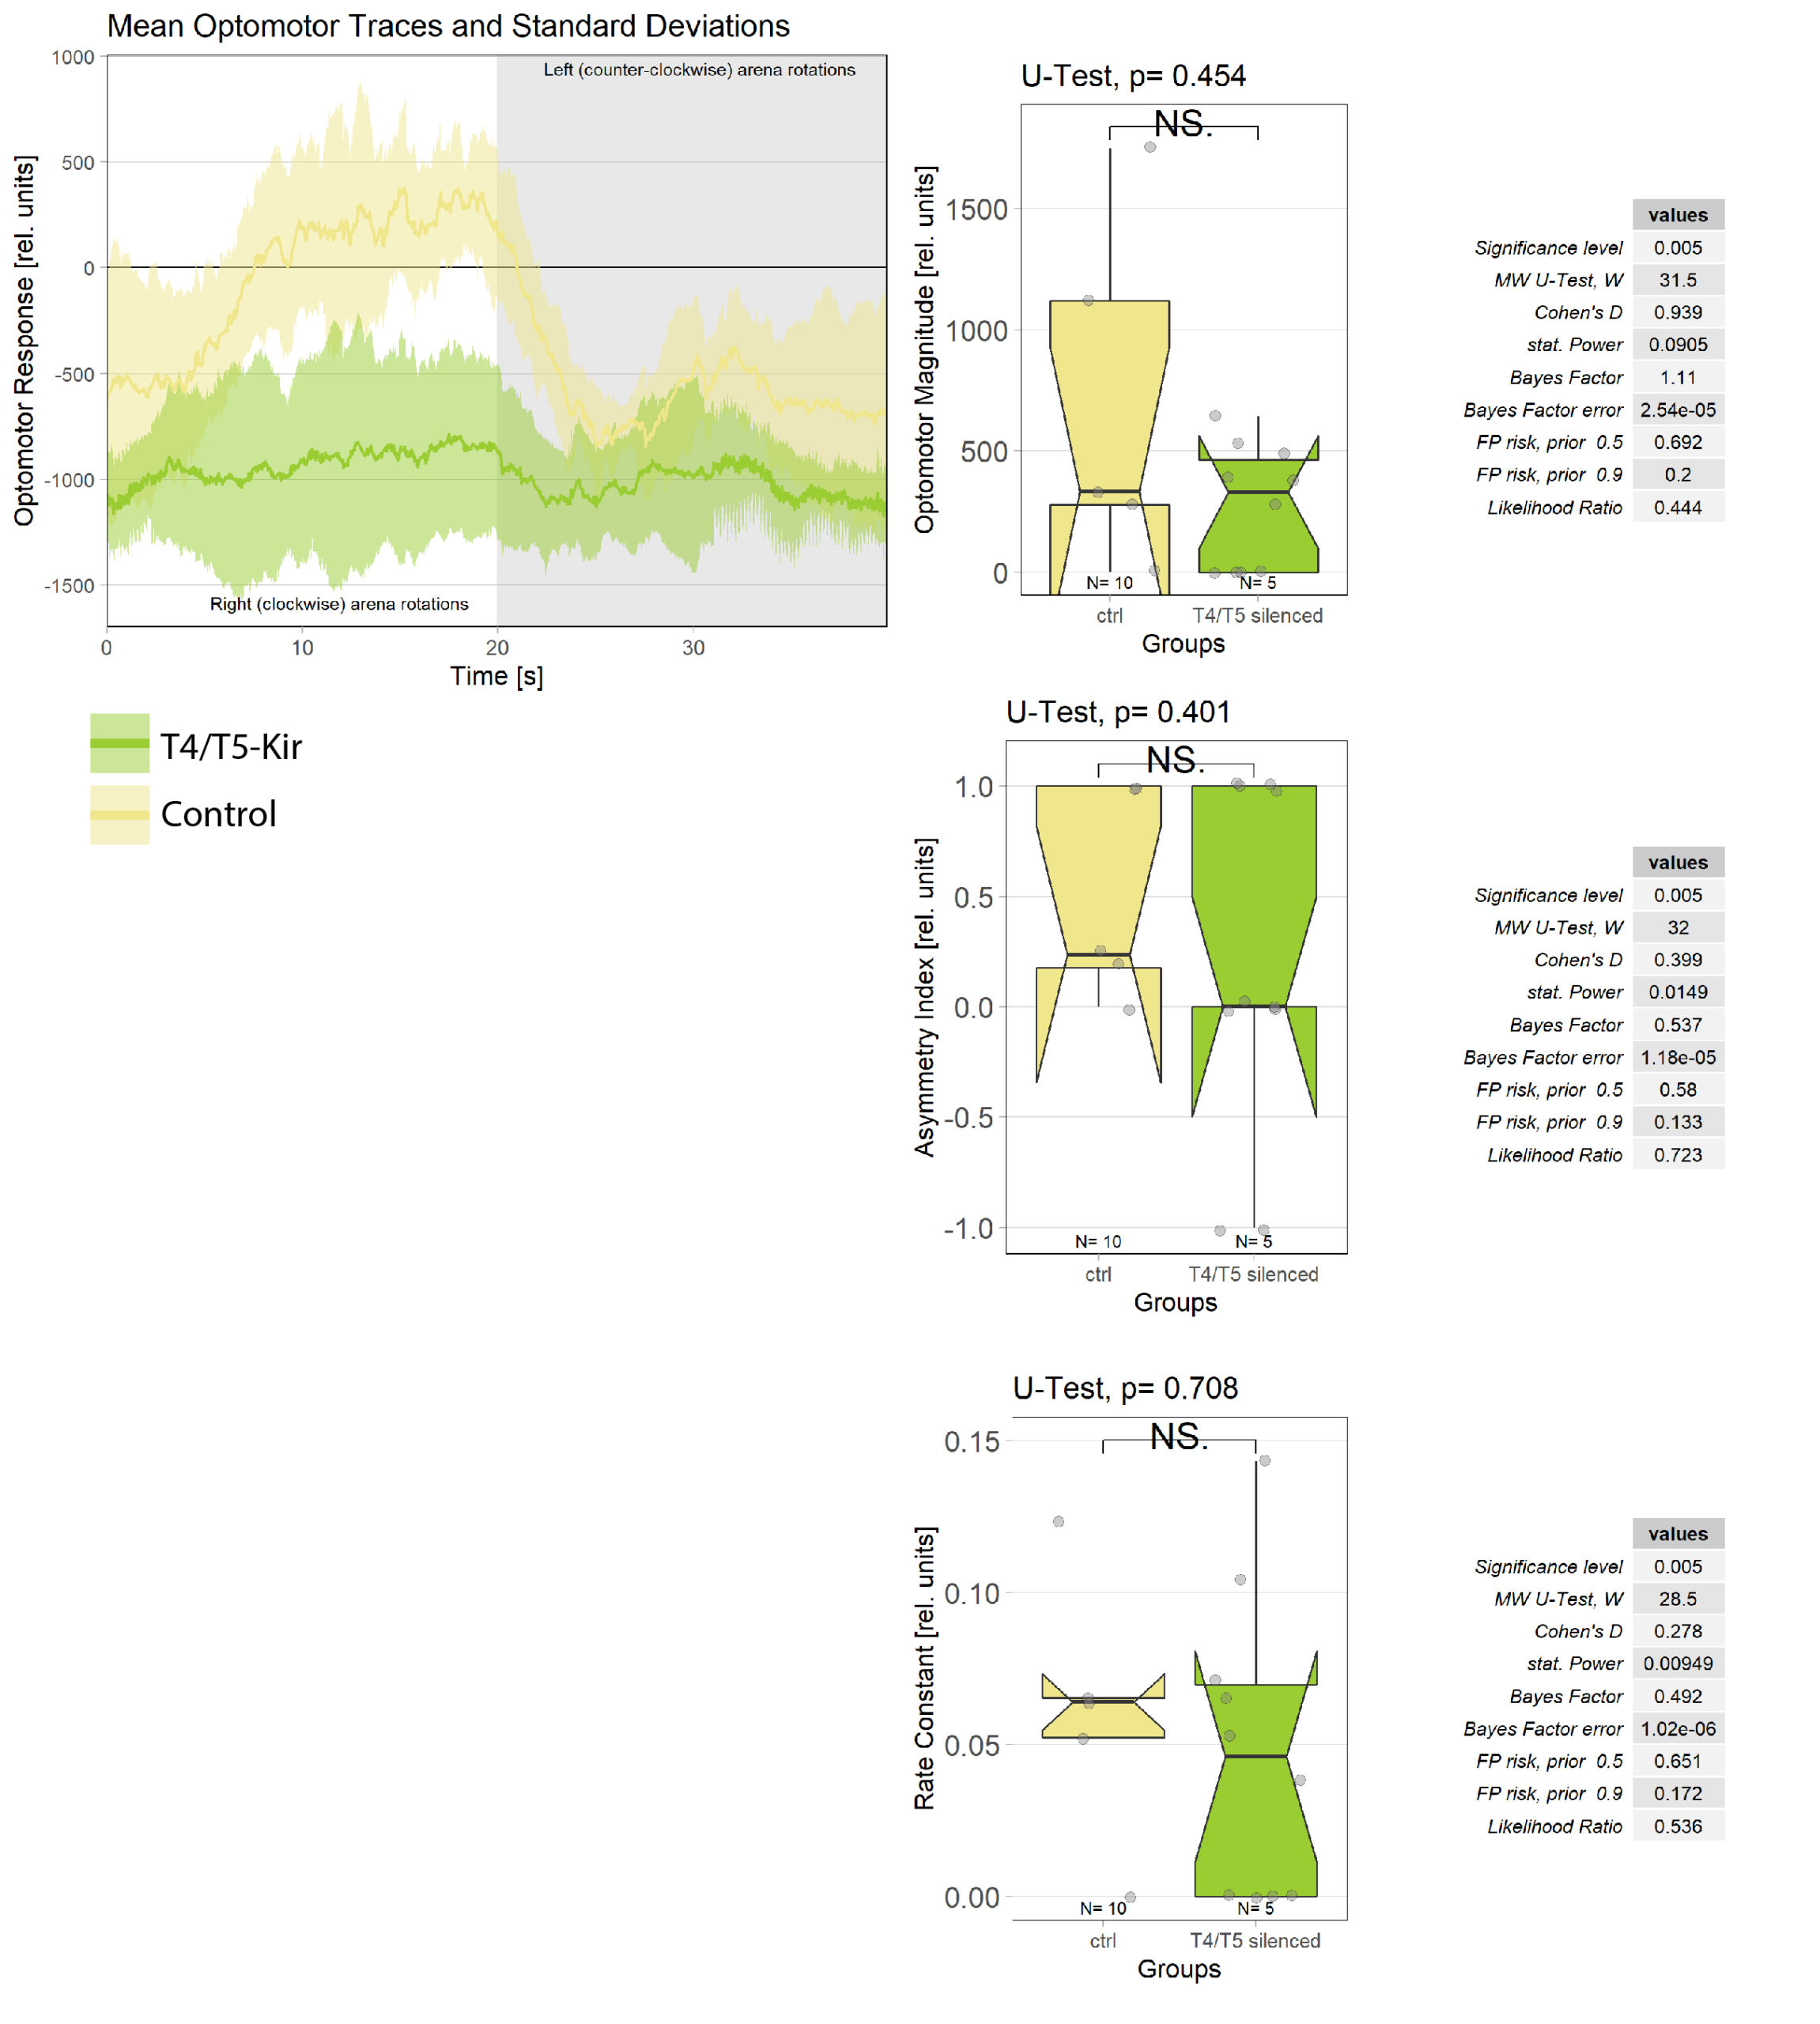
Recently I measured the optomotor response in T4/T5 flies. As expected, they did not respond to the optomotor stimulus as seen in the left chart below. However, statistical evaluation struggles to quantify this difference. It might be that this is because of the low sample size, or that we are using the wrong statistical analysis?

Category: crosses, genetics, Lab, Optomotor response, R code
Leave a Reply