Results of T-maze experiments (yellow light)
on Monday, August 19th, 2019 1:43 | by kader semiz
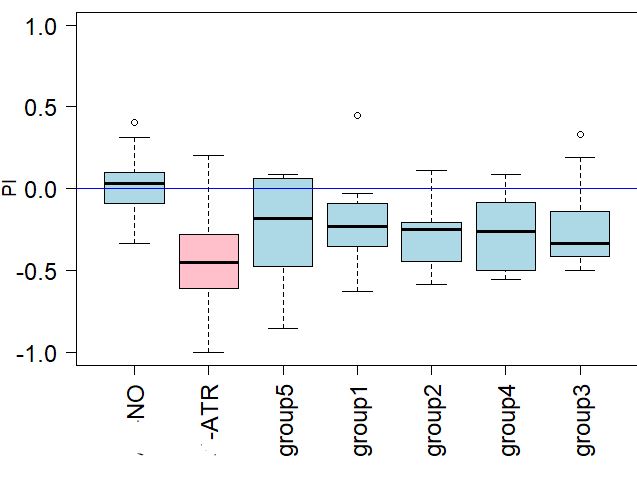
T- maze experiments were done with Norpa/Crimson x Gr28bd/TrpA1 lines without ATR (n=28) and with ATR (n=28). We have done all experiments which belong to Norpa/Crimson x Gr28bd/TrpA1lines. End of all experiments with them; the ATR ones seem like tend to escape from the yellow light as shown at the graph. NO ATR ones seem like moving more randomly.
On the other hand 5 different groups (THD’-GAL4xNorpA/Crimson with and without ATR, THD1-GAL4xNorpA/Crimson with and without ATR and W[1118]x NorpA/Crimson). Group1 (n=10) Group2(n=11) Group3(n=9) Group4 (n=10) Group5(n=9). Still, we don’t know that the which lines belong to which groups. The graph shows the PI numbers according to the T-maze experiments that we have done.

Category: Uncategorized
Leave a Reply