Variability of Phototaxis 3
on Wednesday, October 7th, 2015 5:44 | by Isabelle Steymans
In the previous experiment we saw that testing tubes 5 and 4 together show almost the same distribution than the first round of the benzer paradigm used to split them, however the tubes 3 to 0 together showed a big change. I decided to test single tubes, to see how big the difference between those subgroups actually is. I started by doing the Benzer paradigm to split the group and then I did the Benzer paradigm a second time only using the flies from a particular tube. I wanted to take both extremes, but in the tubes 0-2 there were not many flies. Therefore, I decided to test tubes 5 and 3. Considering that tube 3 had the biggest contribution when tubes 0-3 were tested together, I thought it could be a kind of breaking point of the phototactic behavior.
As you can see in figure 1 there is a significant difference in the proportions between tube 5 and 3. The distribution of the flies in tube 5 are, like in the previous experiment, very similar to the experiment where all flies were tested, which is not the case for tube 3. Also in figure 2, where the variability is shown, it is possible to see a big difference between the distribution of flies of tube 5 and 3, which implies a difference in the behavior of those flies.
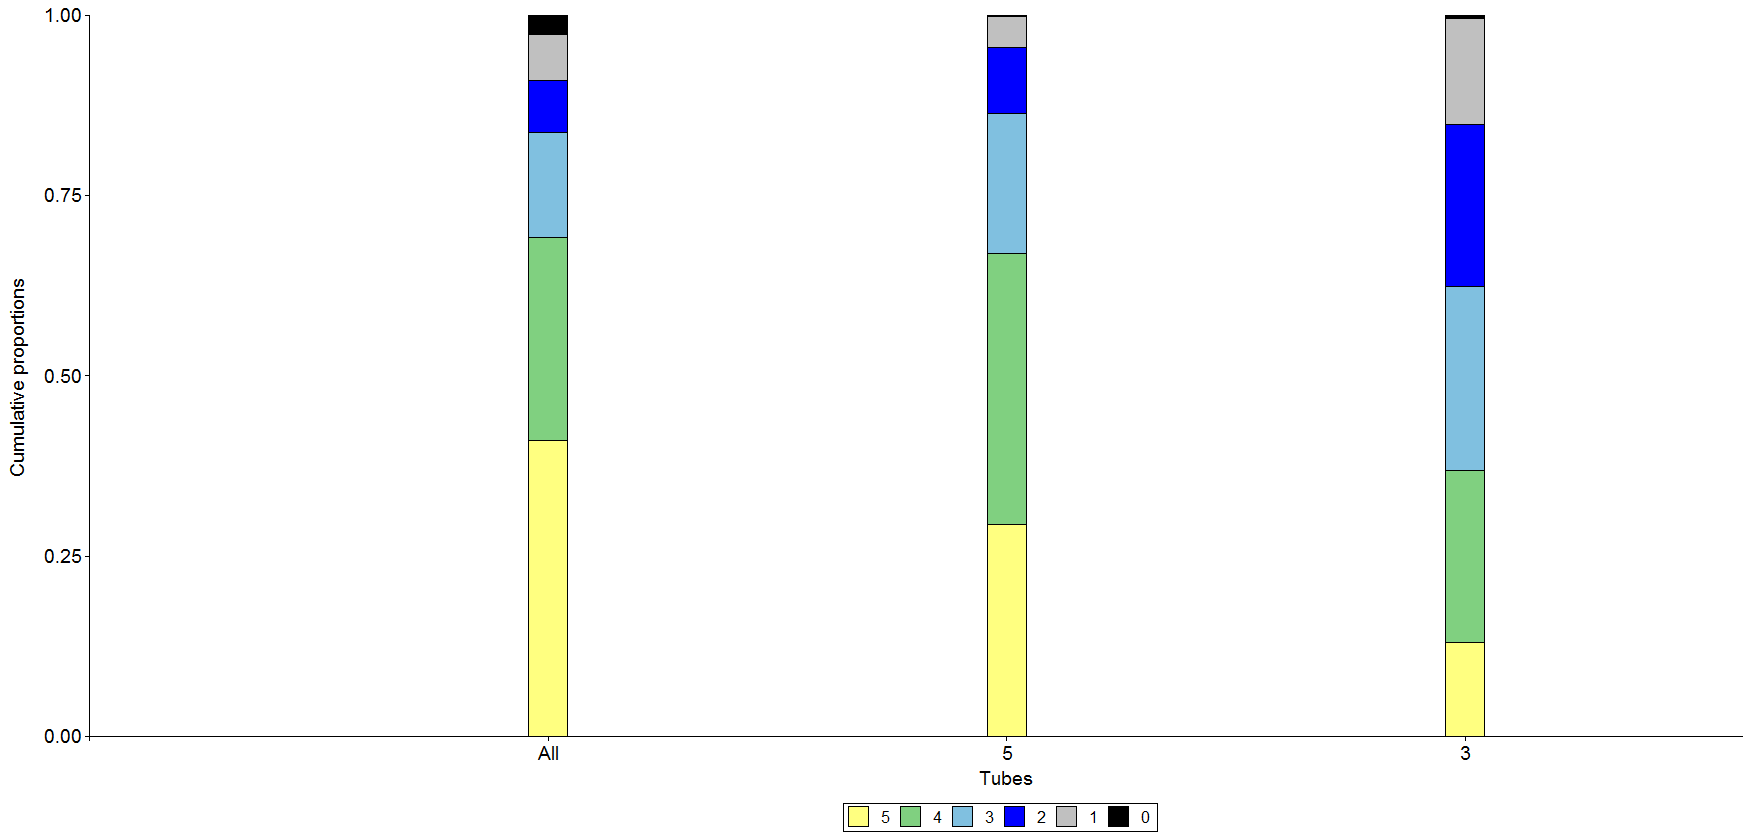
Fig. 1
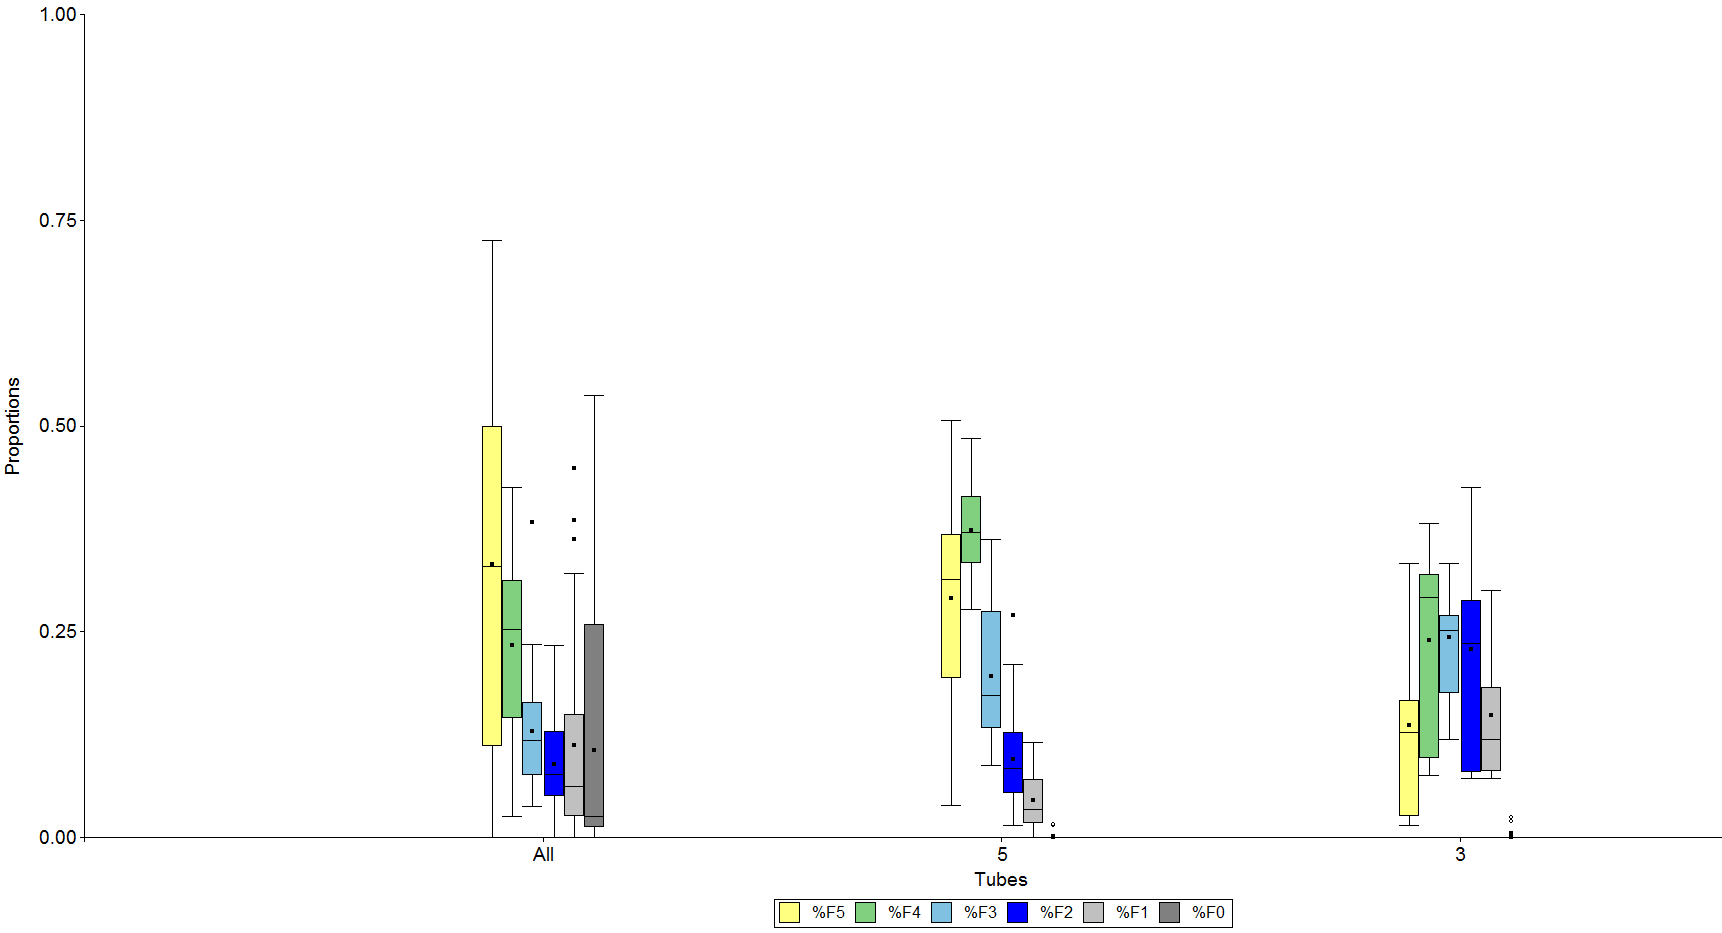
Fig. 2
To complete the Experiment I tested the tubes 4, 2, 1 and 0 (Fig. 3 & 4)
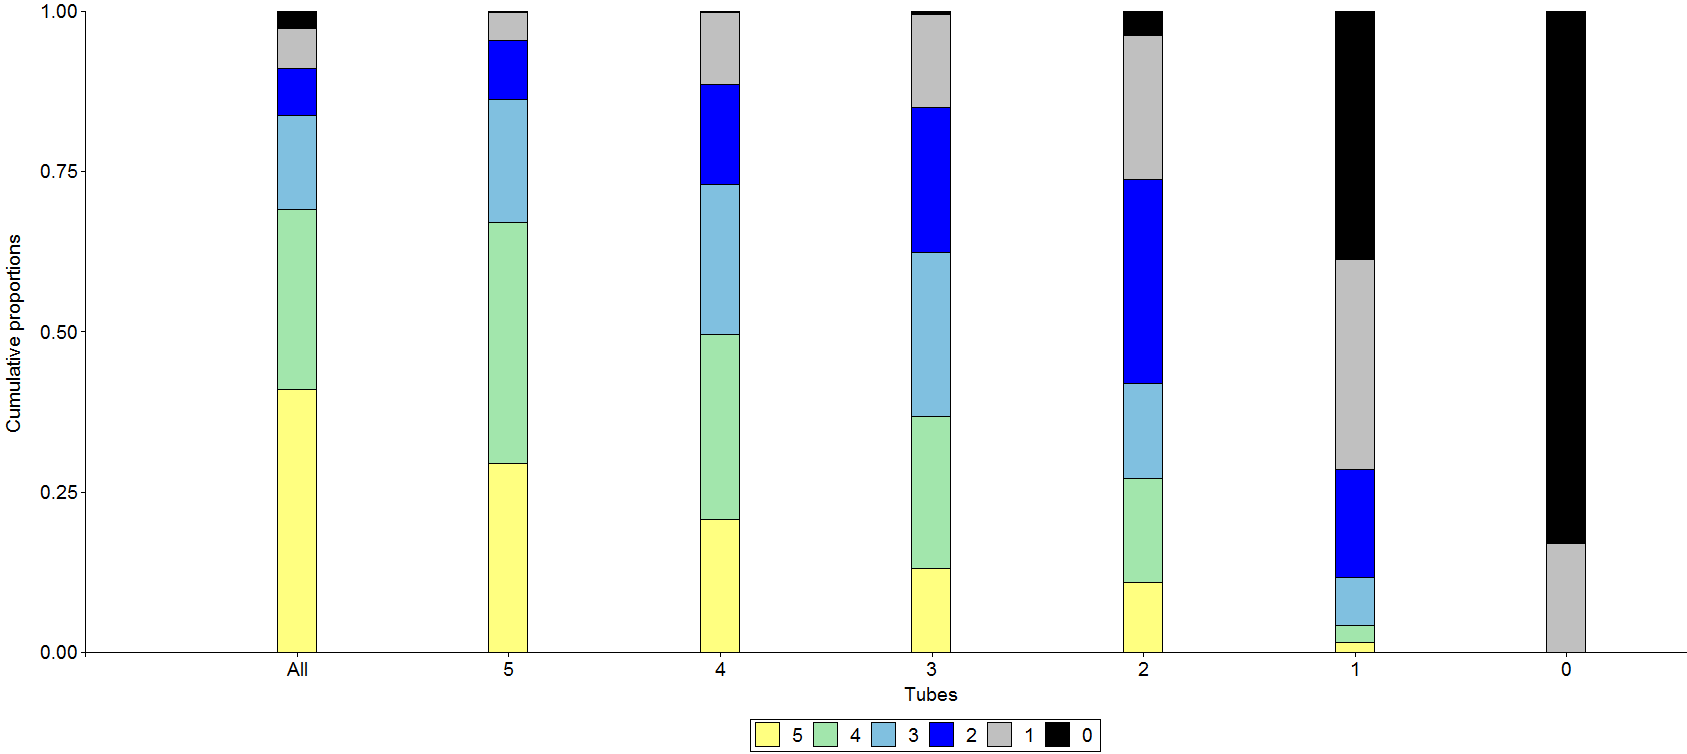
Fig. 3
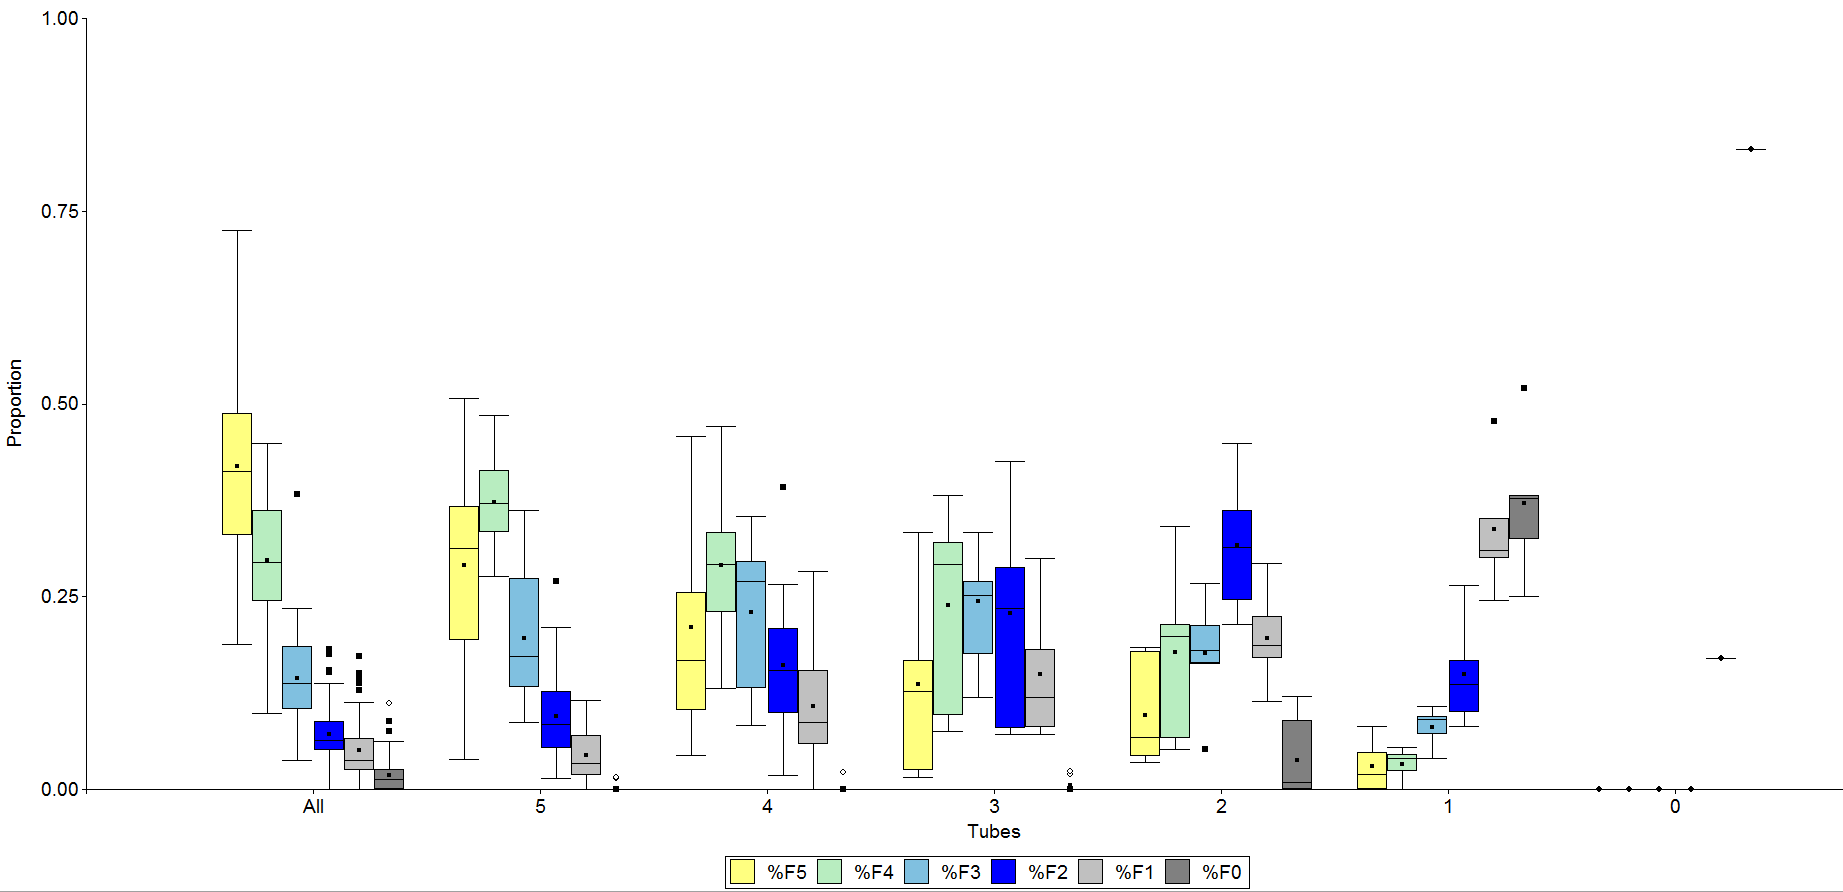
Fig. 4 the corrected graph for the different proportions in all the tubes

Phototatic flexibility
on Wednesday, October 7th, 2015 11:00 | by Bianca Birk
I want to know which octopaminergic neurons are involved in the phototactic switch after wing clipping. So I started with a screen for some subgroubs of tbh-GAL 4. After testing the flies in RT with a T-Maze, I tested the same flies again in 32 degree. I expect, that wingless flies go to the light, so the Choice Index should increase. The Figure 1 shows the results of only 2 experiments (39942-tbh-GAL4 only one experiment).
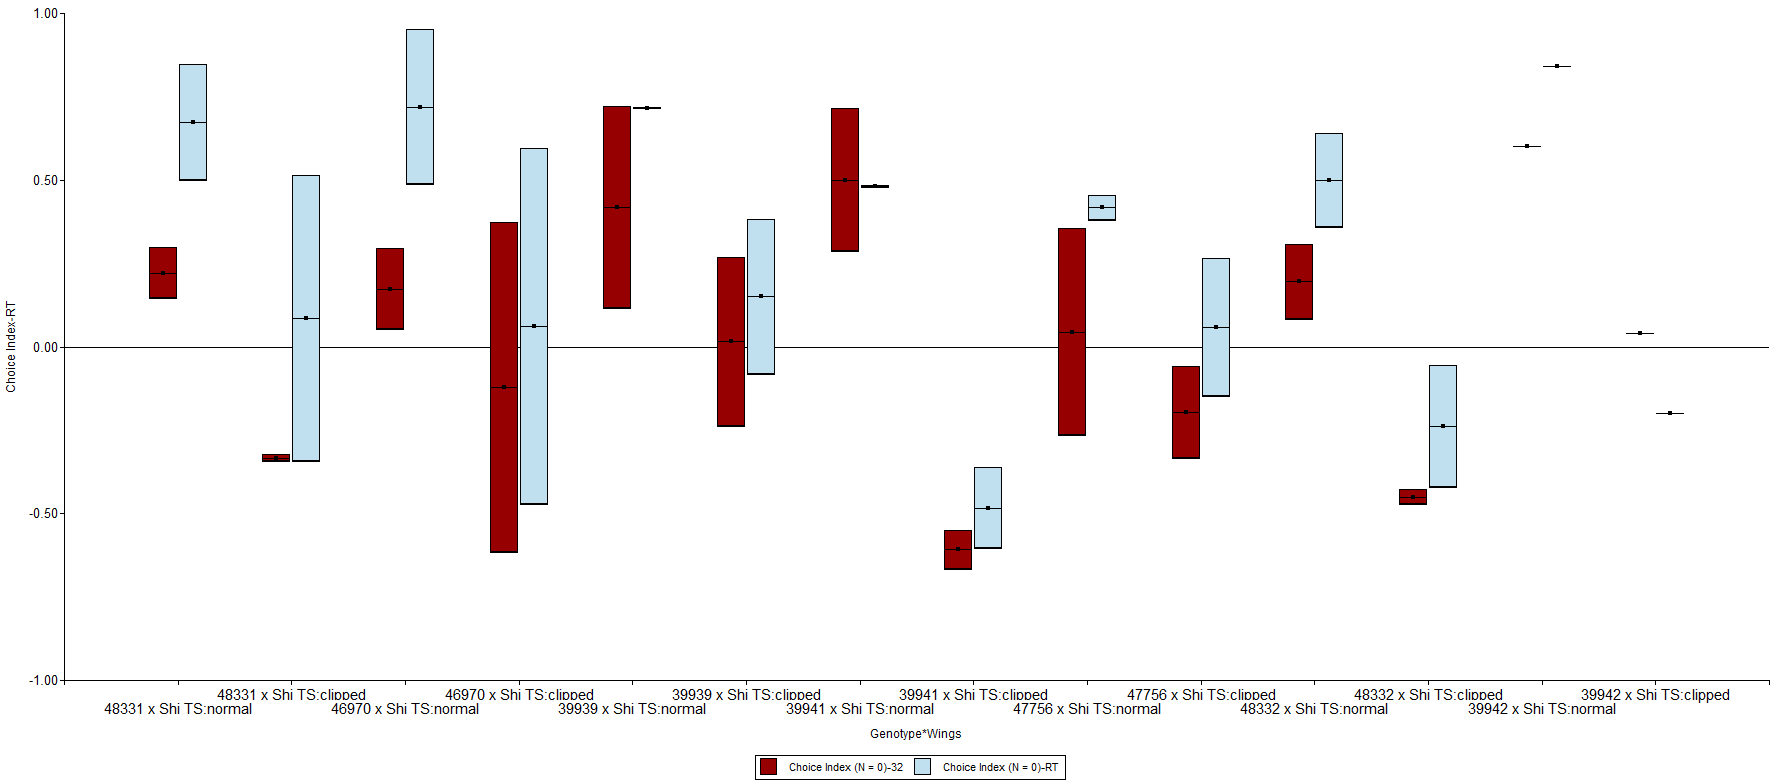
Figure 1: tbh-subgroups tested at RT and 32°C
Category: wing clipping | No Comments
Looking for the DA & OA neurons involved in phototactic flexibility
on Monday, September 21st, 2015 2:41 | by Axel Gorostiza
After using TH-G4 and TDC2-G4 to prove that dopamine and octopamine are involved in phototactic switch after wing clipping, I decided to find which neurons in particular are playing this particular role. Therefore, I started a few small screens with the GAL4s and LexAs available for these groups of neurons. I crossed the drivers to shibire to assess their role. For every graph blue means RT, and red means 32°C.
TH subsets-GAL4
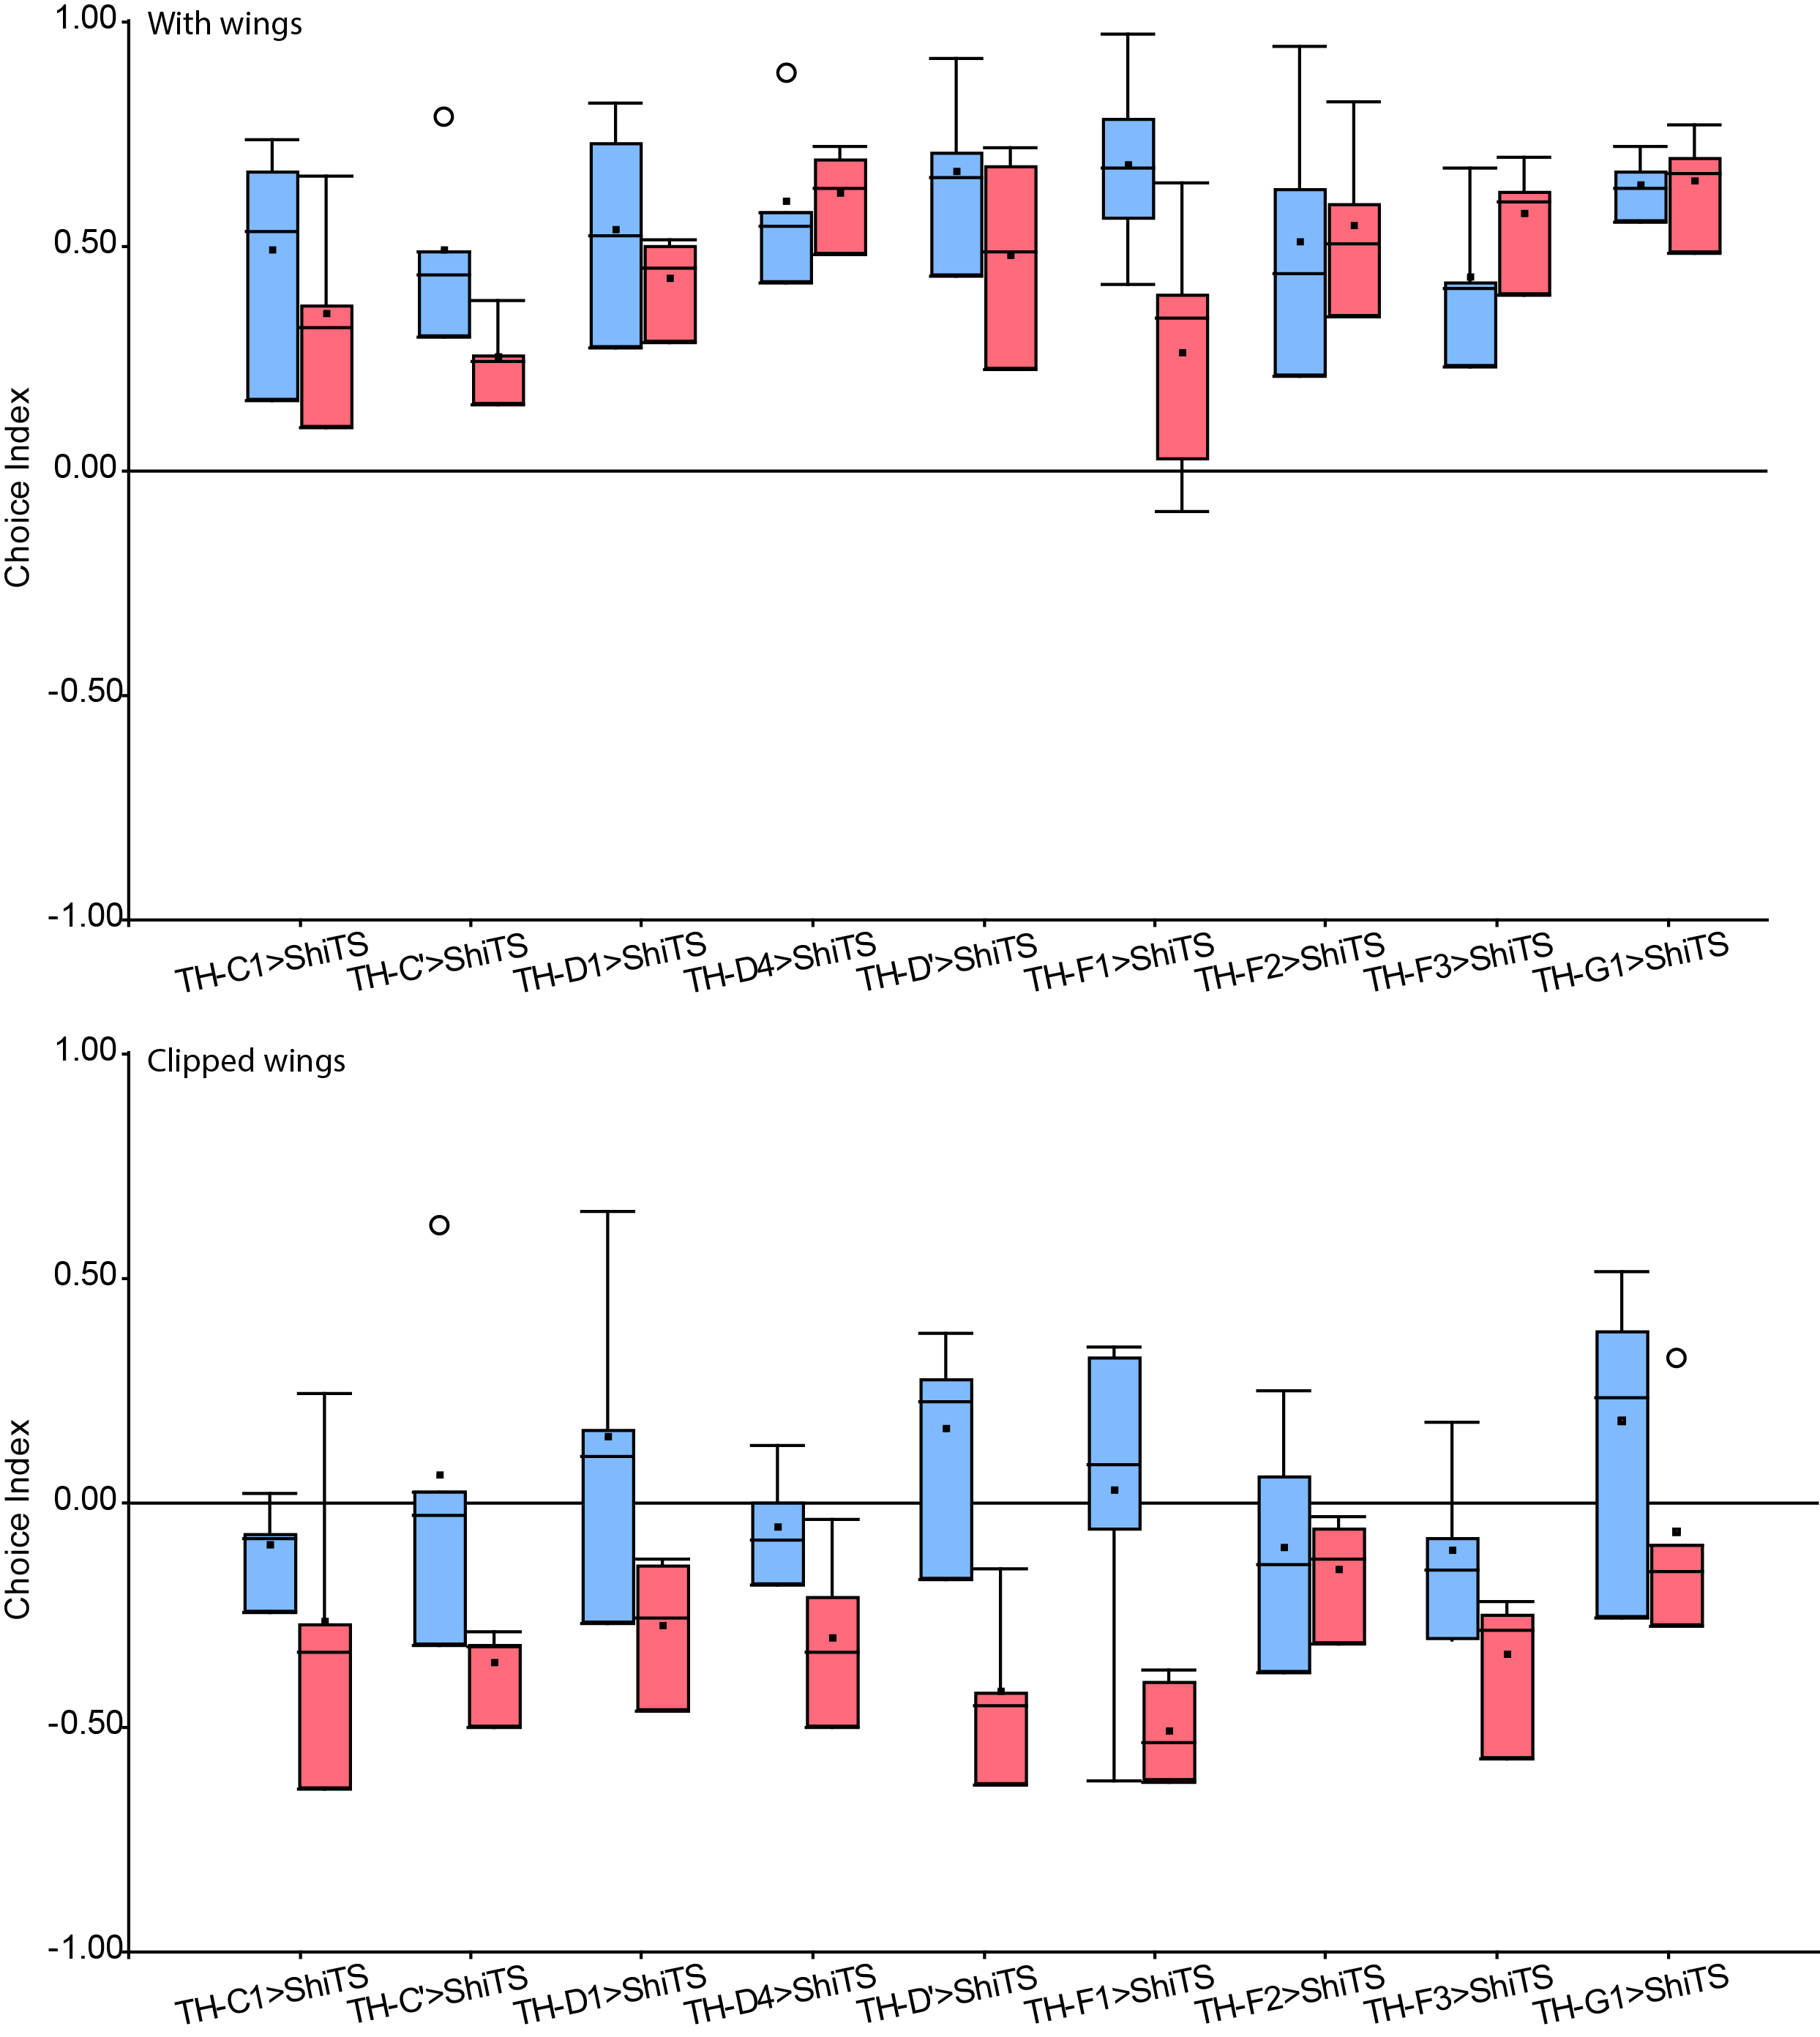
Dopaminergic neurons -GAL4
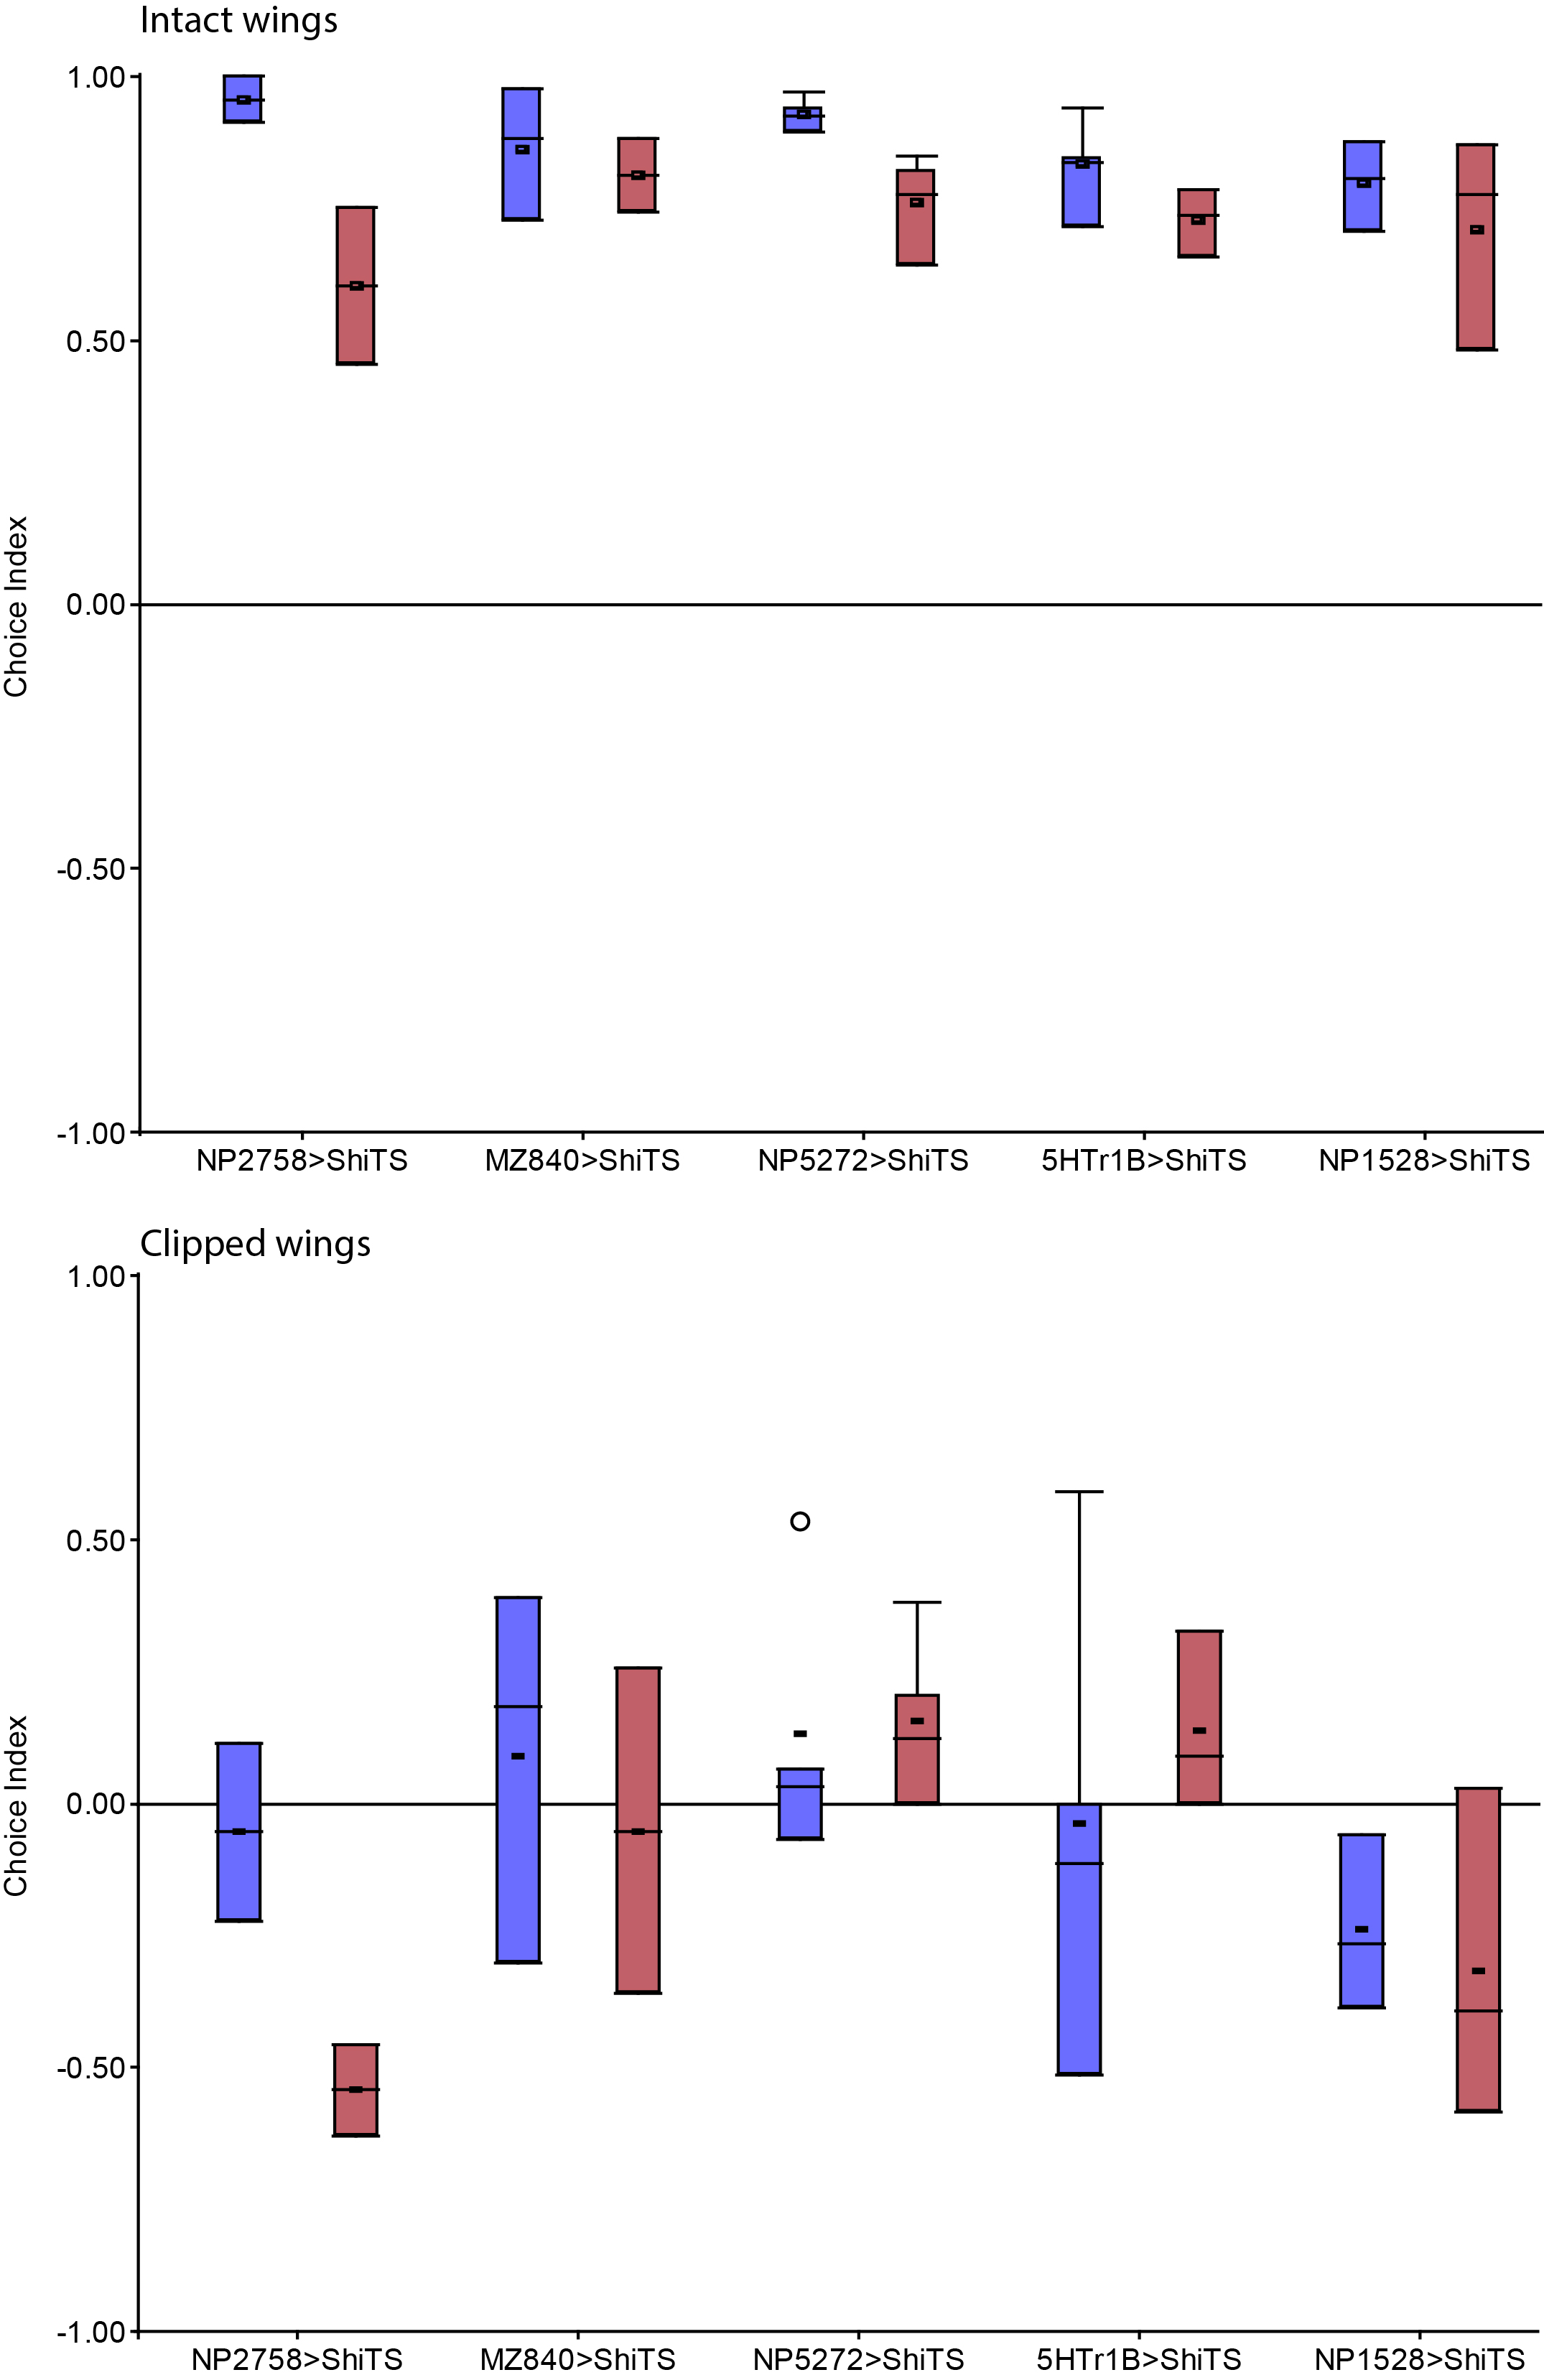

Category: wing clipping | No Comments
Variability of Phototaxis 2
on Monday, September 21st, 2015 12:03 | by Isabelle Steymans
I redid the experiment where I took 8 groups of 80 flies and tested them 4 consecutive days, with the T-maze (Fig. 1) and decided to do a second control to see if the proportions are changing if I repeat the experiment several times the same day. Therefor I used again the Benzer-paradigm and did the same experiment like the one above, but instead of waiting 24 hours the flies were given only 3 hours to recover from the anaesthesia (Fig. 2).
As you can see doing the Experiment a second time has almost no effect, but the proportions change drastically the third time.
After that, I wanted to see if the proportion changed if only subgroups were tested. Therefor I tested again 8 groups with 80 flies. Then, I took tubes 5 and 4, and tubes 3-0 and tested them again after 24h hours of recovery (Fig. 3). Afterwards I did the same thing with 3 hours of recovery with a different group of flies (Fig.4).
In both cases there were almost no differences in the proportions between the experiment in which all flies were used and the experiment in which only the tubes 5 and 4 were used. Surprisingly, there is a big change in the proportions if only tubes 3-0 are tested.
Then I did the same experiment with the T-maze. After 24 hours of recovery I took the flies who went to the light and tested them again. I did the same thing with the ones who went to the dark and the elevator (Fig.5), but I had to test these two groups of flies together because otherwise there wouldn’t have been enough flies to reach the threshold of 40 flies. Like in the experiments above, the proportions when only flies that went to the light were tested were similar to the original proportions. However, in this case the flies who went to the dark and the elevator showed a small difference in the proportions.
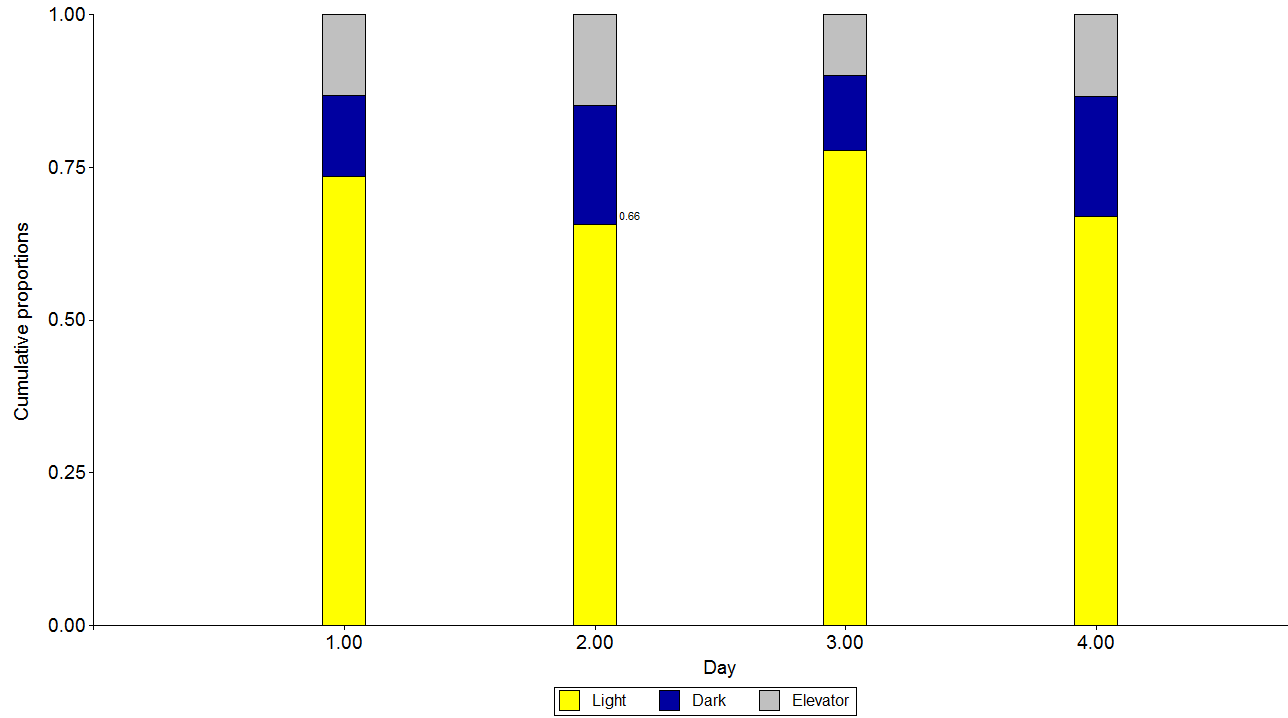
Fig. 1
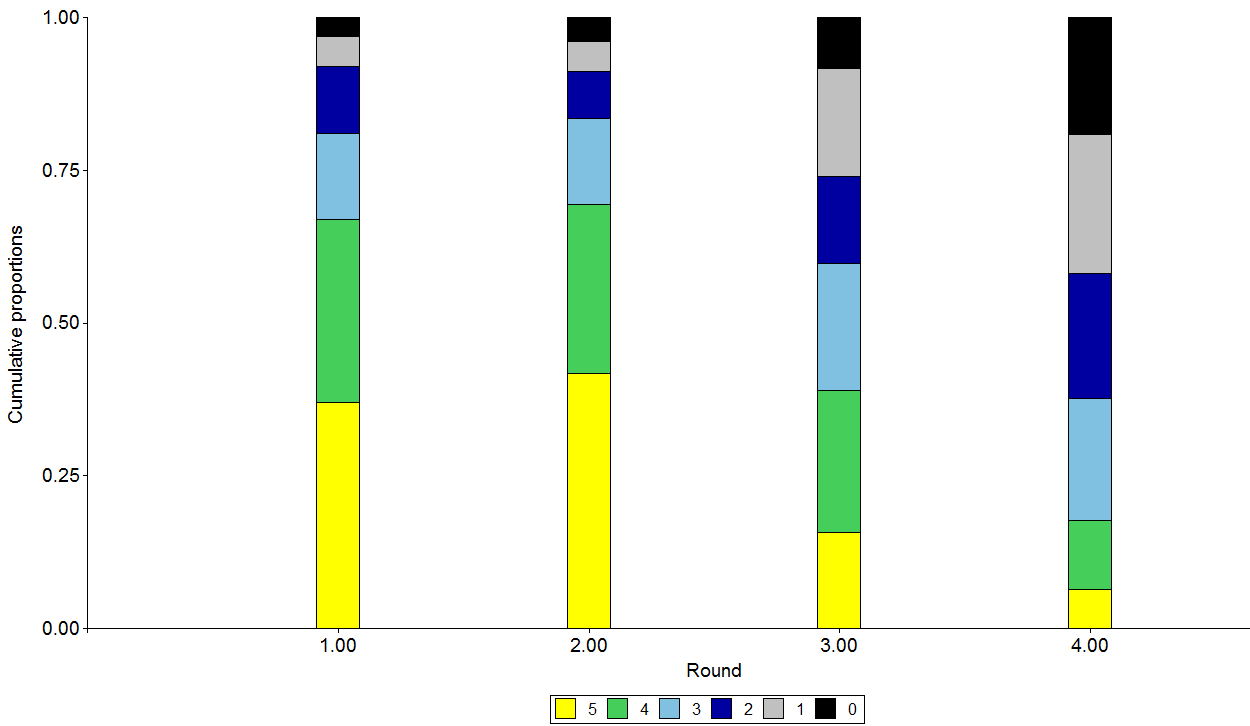
Fig.2
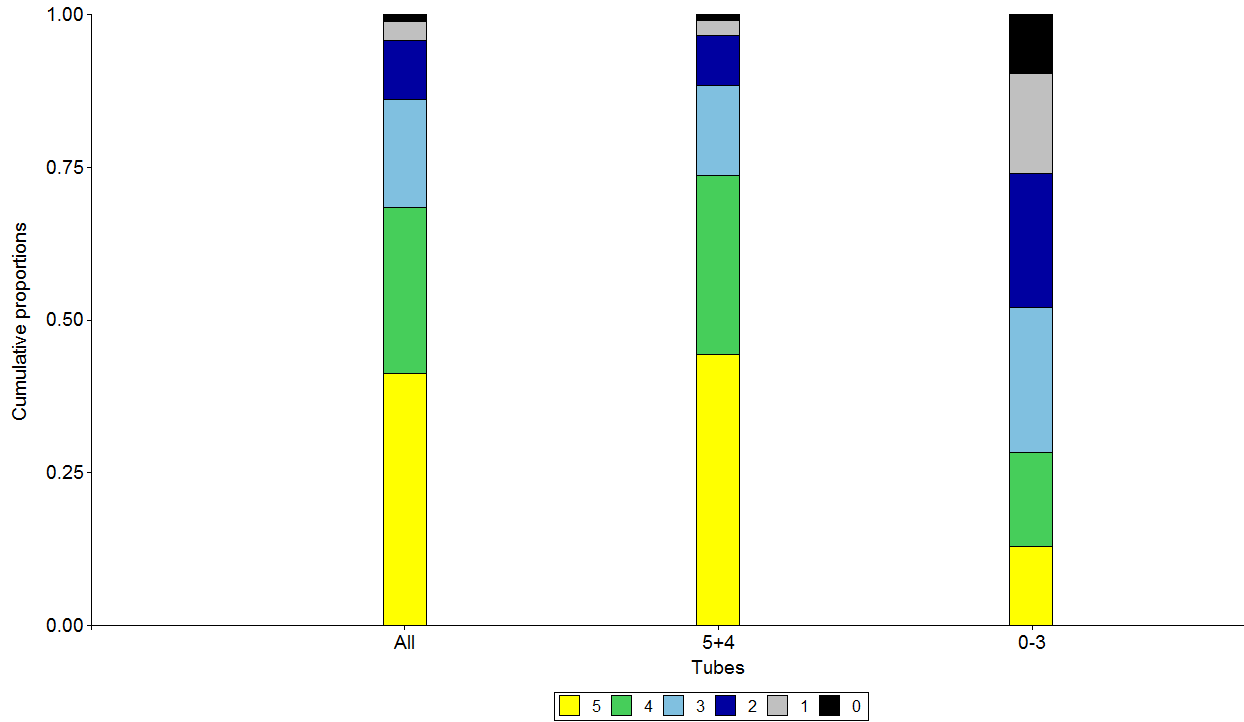
Fig.3
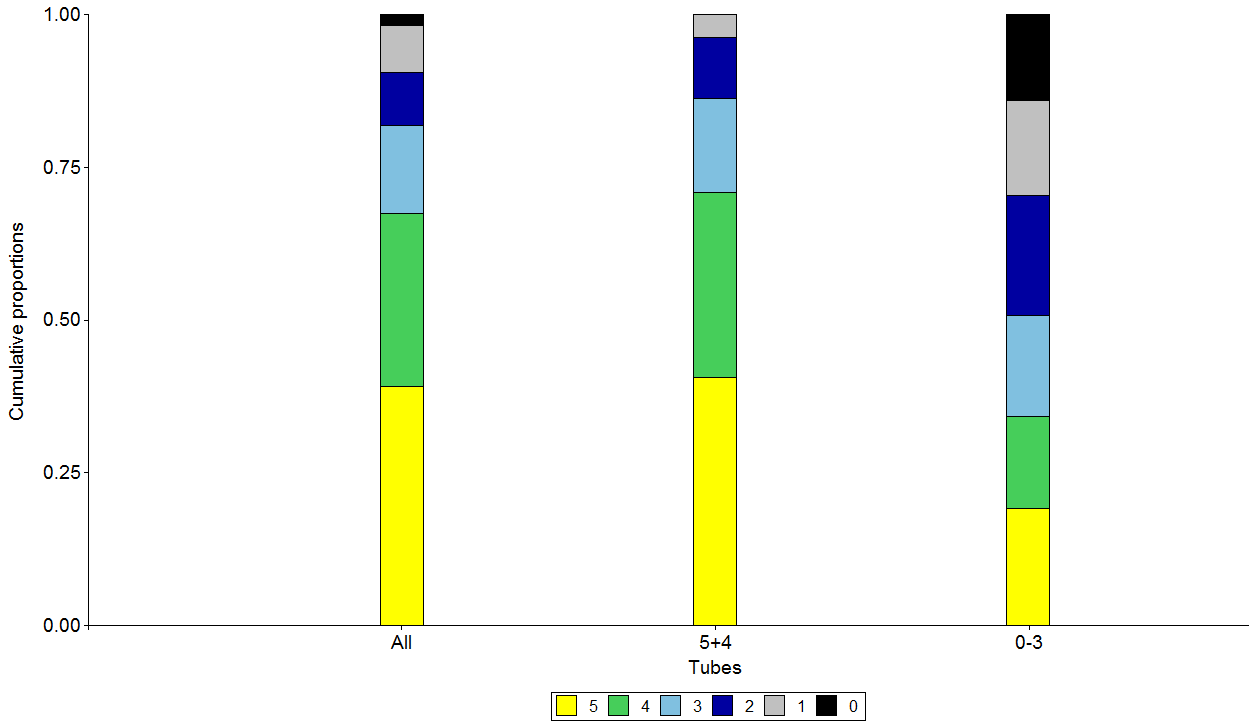
Fig.4
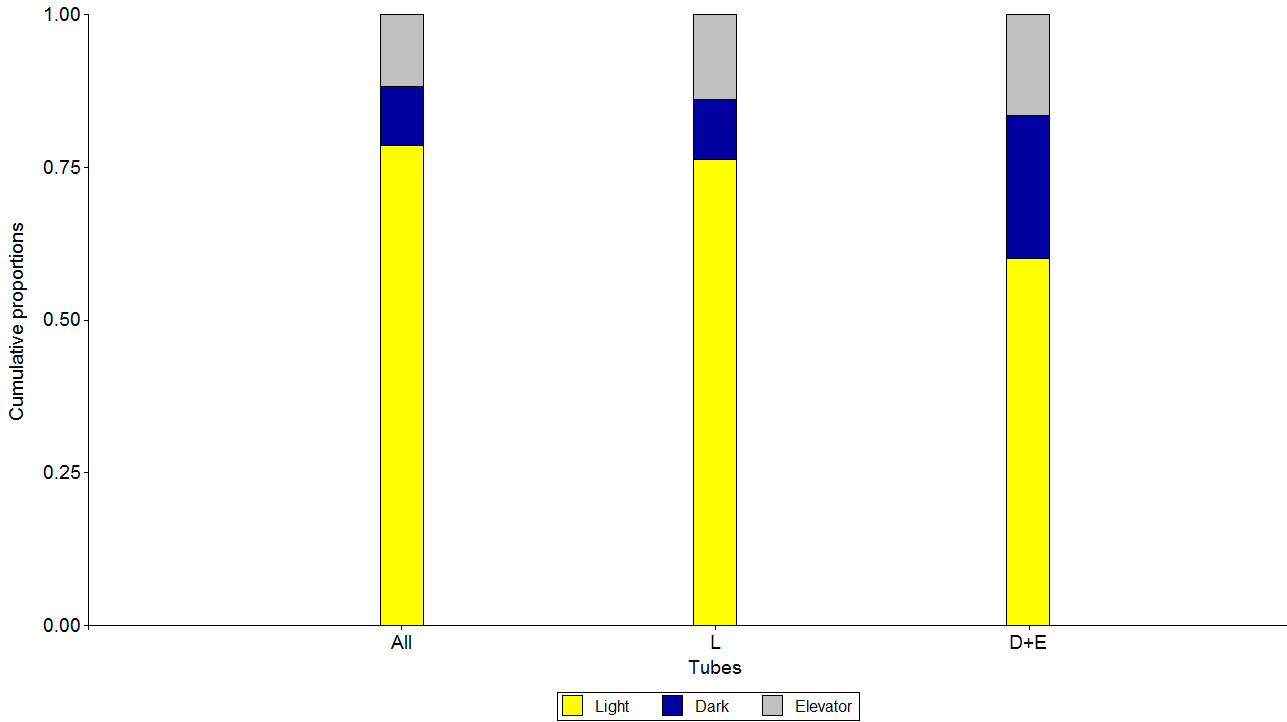
Fig.5
This is the new dataset with the final number of flies for the experiment above. (Fig. 6+7)
Additionally I did the corresponding boxplots to show the variability of the proportions (Fig. 8+9)
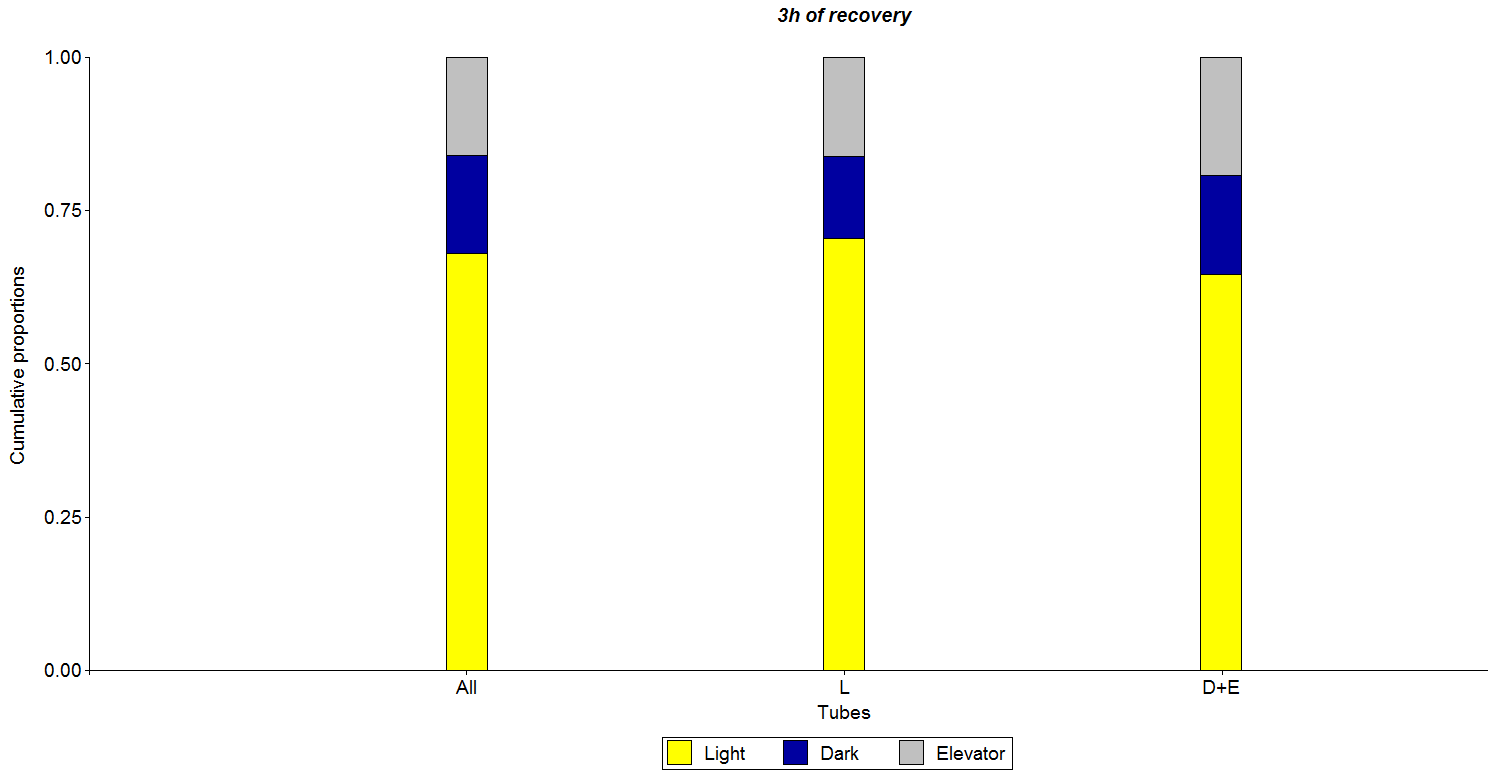
Fig. 6
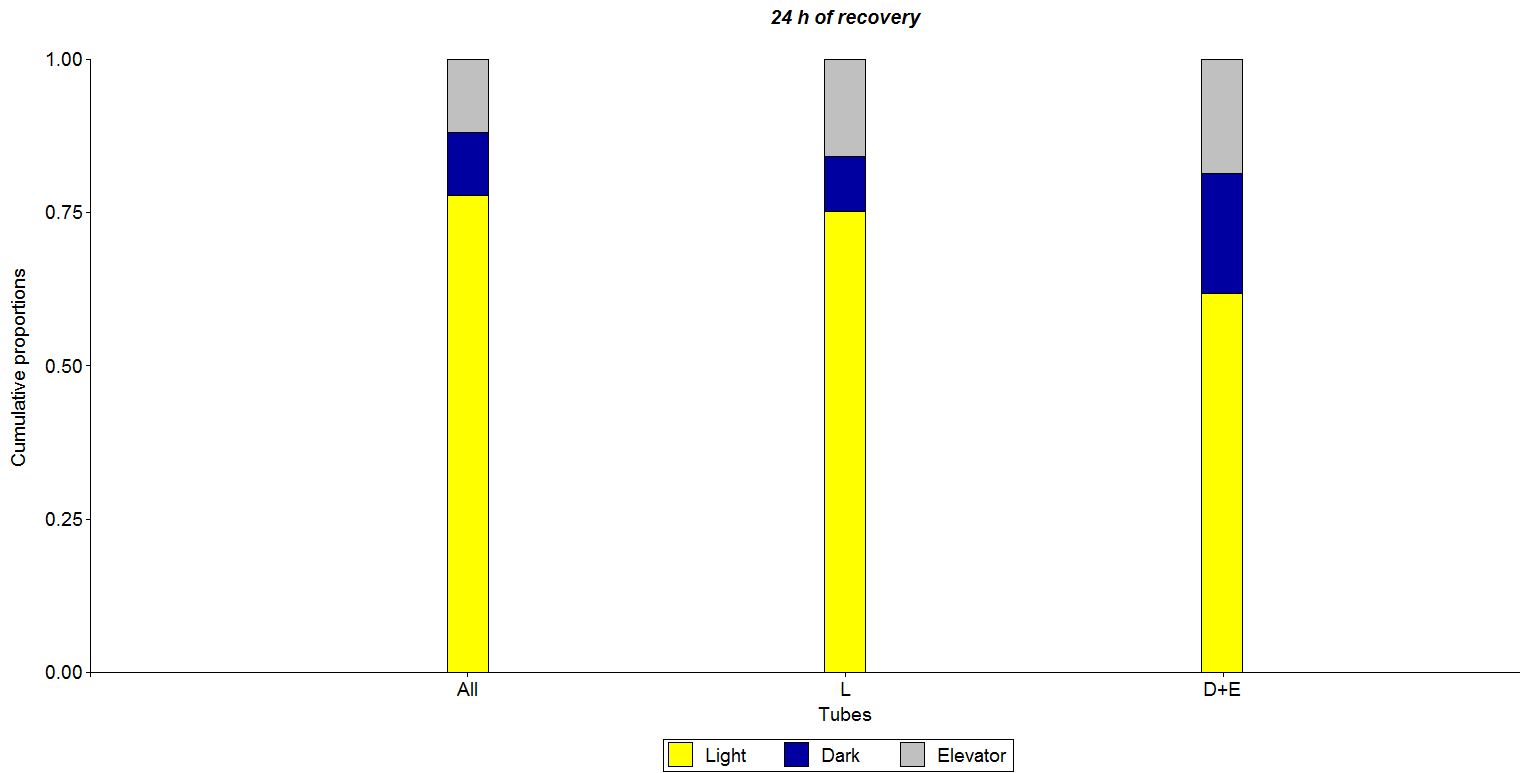
Fig. 7
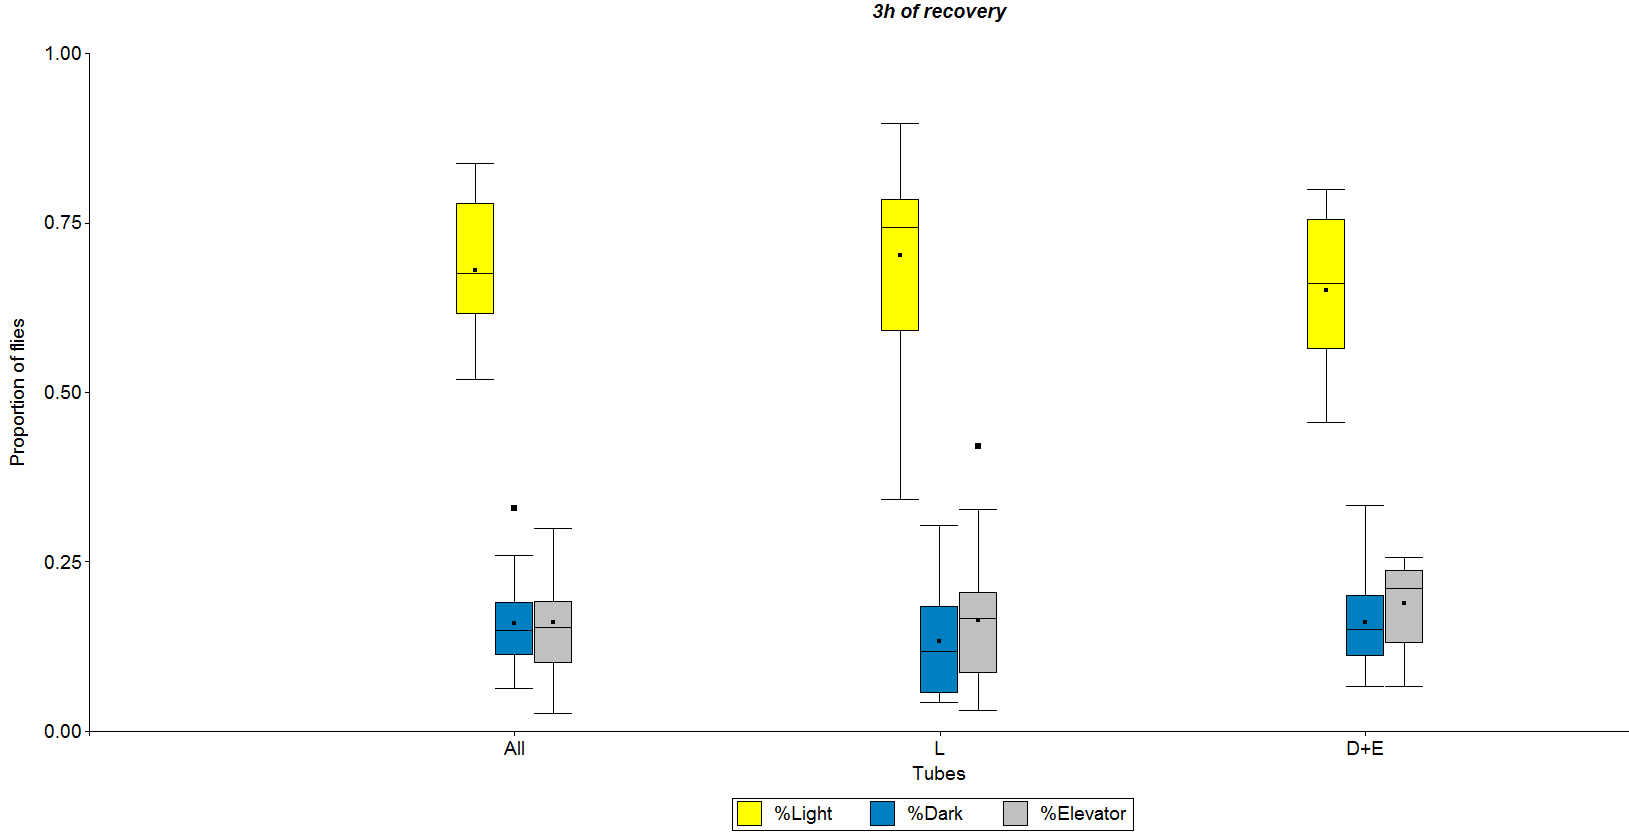
Fig. 8
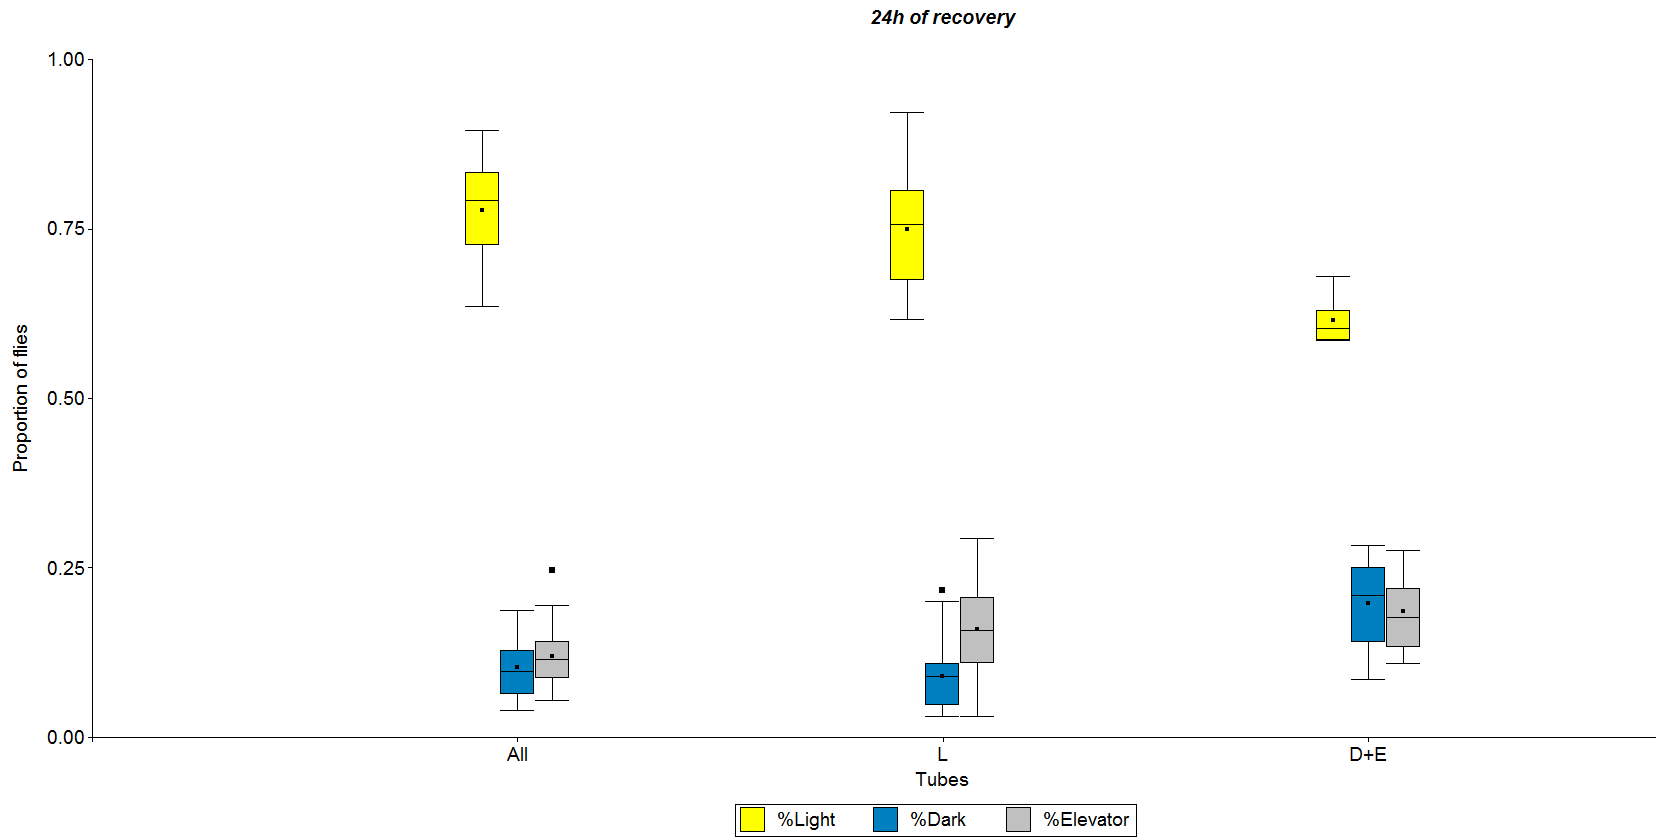
Fig. 9
Temperature Impact on Phototactic Behavior
on Friday, September 11th, 2015 8:36 | by Amelie Roedel
Using the Wildtype Berlin line of Drosophila melanogaster, I started to examine how flies behave to light while being confronted with different temperatures (4 °C, 14 °C, 25 °C, 32 °C, 37 °C).
The apparatus I use to test the temperature impact on light preference is the T-Maze.
One day before the trials, I clipped off the wings of about 30 – 40 flies under CO2 and put them in a vial together with 30 – 40 flies with wings.
The intervals for the T-Maze are 15 minutes of temperature adaption, 10 minutes of darkness adaption, 30 seconds in the elevator and 30 seconds to choose between darkness and light.
In the rooms with the extreme temperatures of 4°C and 37°C, I had to check if they survive for the spell of time I wanted to test them (~ 26 minutes). In the room with the temperature of 4°C the flies didn’t survive longer than 3 minutes. So I tried to do a T – Maze with a 1 minute adaption for temperature, 1 minute adaption for darkness and again 30 seconds in the elevator and 30 seconds to choose between light and darkness. But the result was not evaluable because the flies didn’t move. So we agreed on not going on with this trial.
In the room with the temperature of 37°C the flies survived perfectly.
After having eight trials for each room, I evaluated the data with “InfoStat” (see figure 1 & 2). The flies without wings went to the darkness and the ones with wings went to the light. In the room with the temperature of 37°C the results were not as we expected (expected Choice Index = 0). I tested them again, but it remained the same. After realizing that the intensity of light could influence the behavior I measured the lux in the different rooms to see if that was a reason for the unexpected results. But even after controlling the intensity of light in all the rooms the behavior didn’t change (see figure 1 and 2).
We decided to retest the flies. I took eight vials holding ~ 40 flies with wings and ~ 40 flies without and tested them in the room with the temperature of 25°C. After the trial I gave them approximately 5 hours to recover from the CO2 treatment and I reused them for the trial in the room with the temperature of 37°C. The result was the same (see figure 3).
We decided to try what would happen if I gave them more time to choose between light and darkness. Now the behavior changed (see figure 4; 3 minutes to choose between light and darkness, “Slow Phototaxis”).
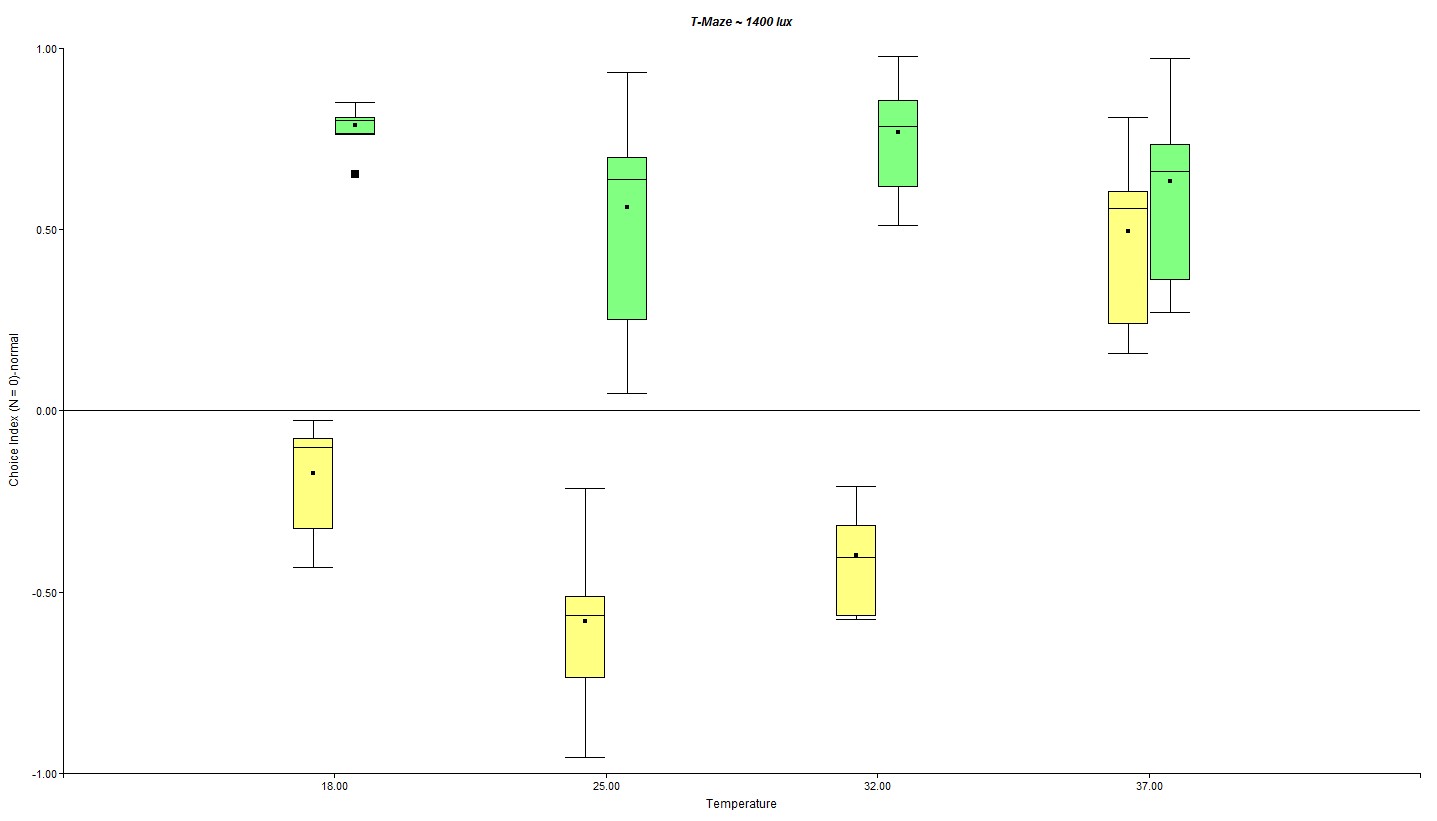
(Figure 1: Behavior in the rooms with the different temperatures, light intensity = 1400 lux)
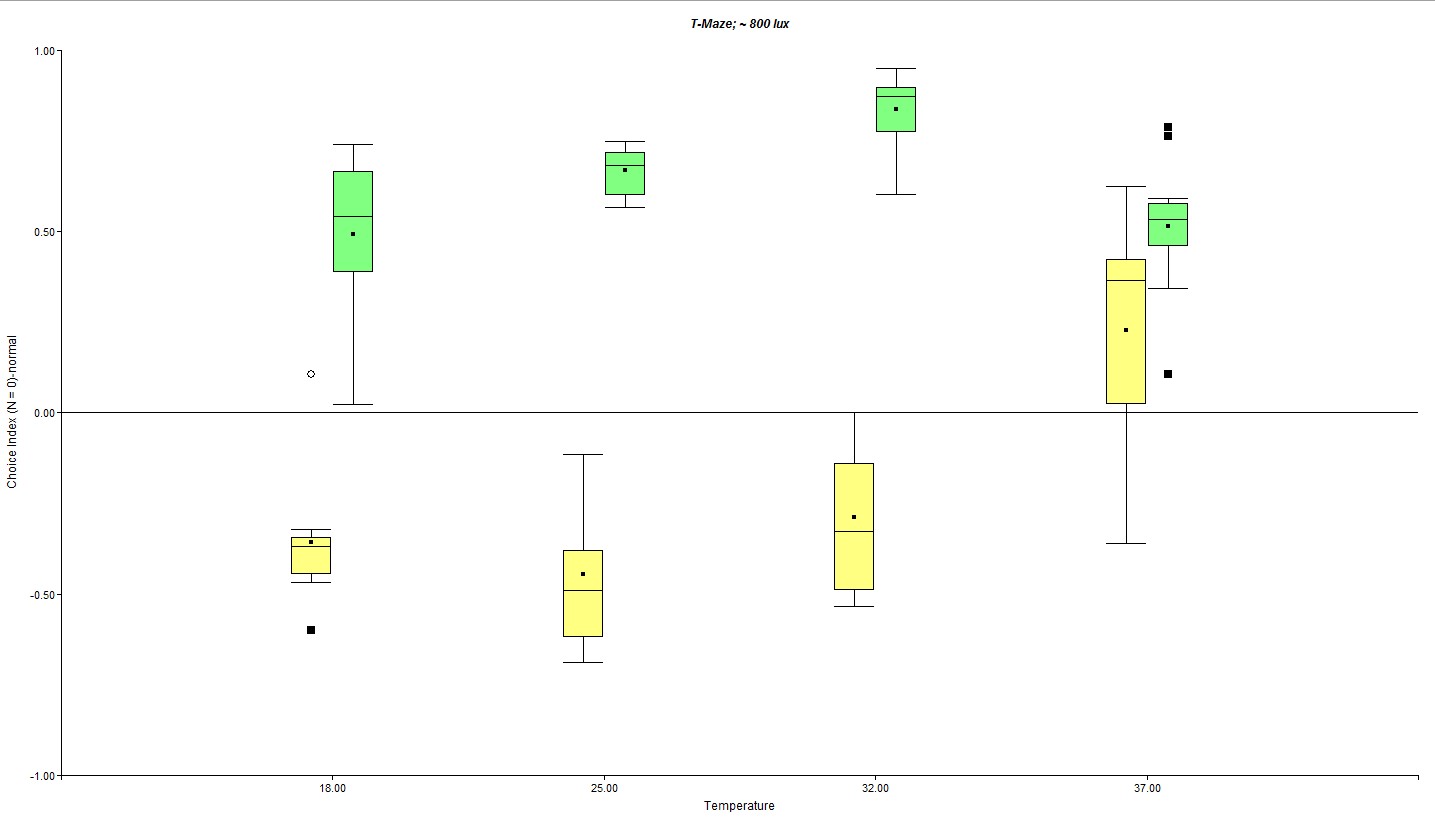
(Figure 2: Controlled intensity of light, 800 lux)
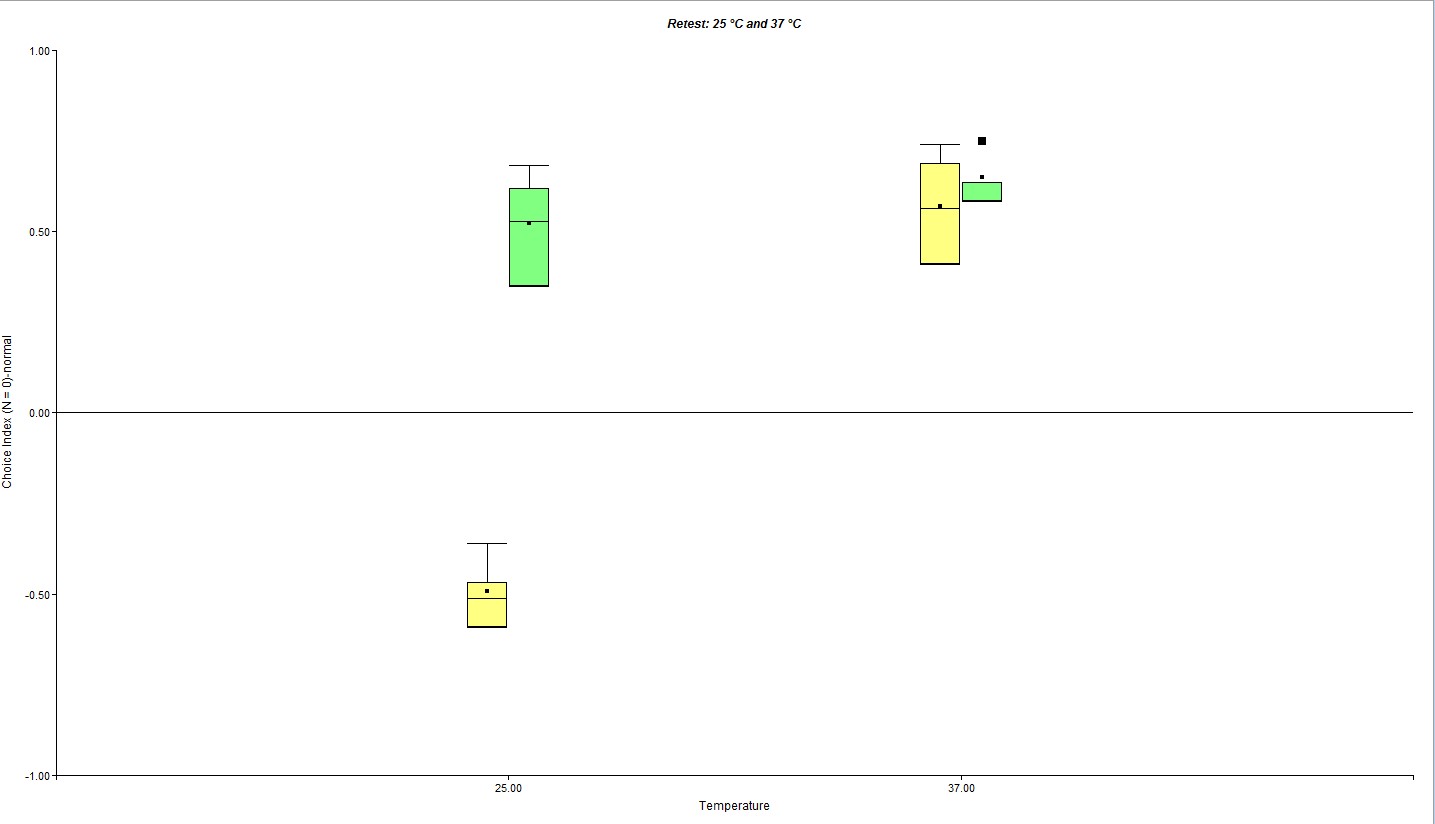
(Figure 3: Retest of eight vials in the rooms with the temperatures of 25°C and 37°C)
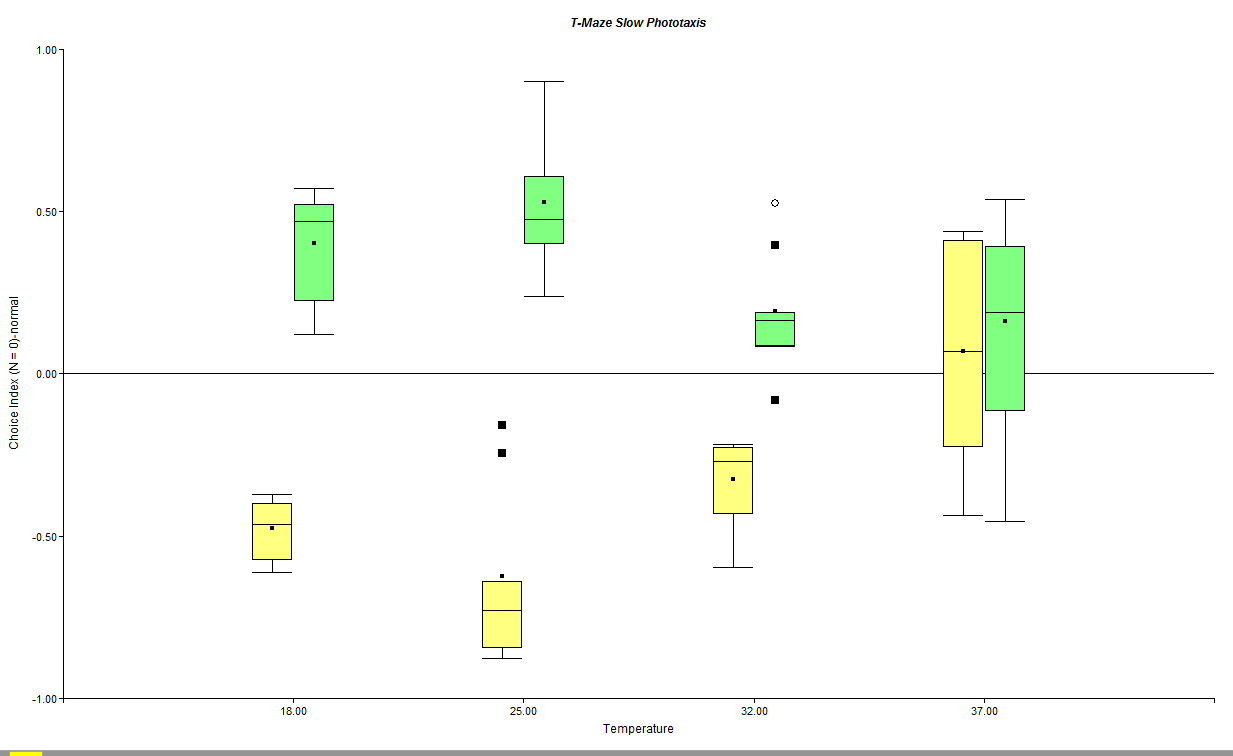
(Figure 4: Slow Phototaxis, behavior changed in the room with the temperature of 37°C)
Category: temperature_phototaxis | No Comments
Variability of Phototaxis
on Friday, September 4th, 2015 6:38 | by Isabelle Steymans
For the project variability of phototaxis I started in the first experiment by determining the adequate amount of flies for the following tests. Therefor I used the Benzer paradigm and the T-Maze with five different groups of wild type Berlin flies with normal wings. I repeated them eight times with 20, 40, 60, 80 and 100 flies.
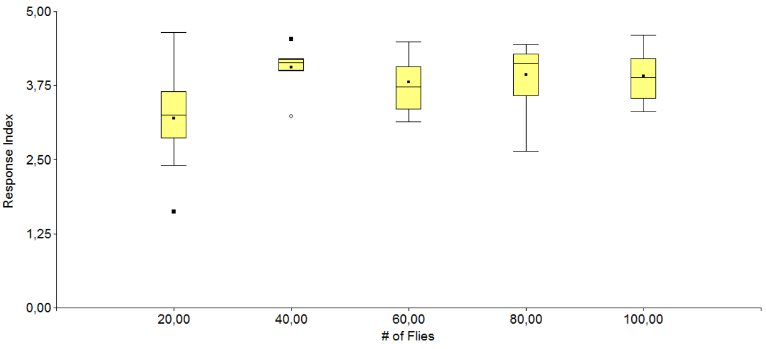
Fig. 1 Different amount of flies in the Benzer
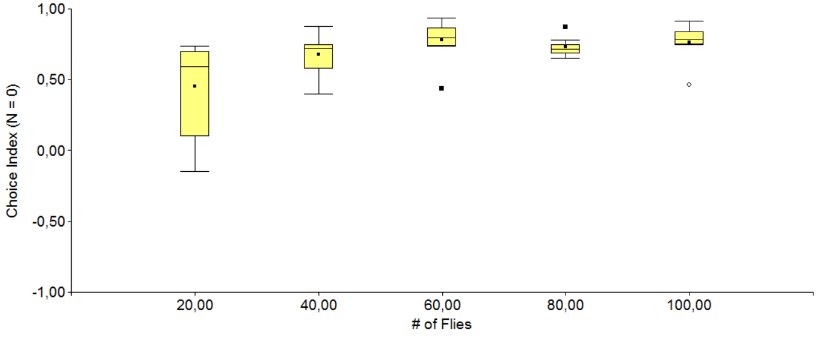
Fig. 2 Different amount of flies in the T-maze
As expected there is a very high variability in the groups with 20 flies, so that they won’t be used in the experiments. The other groups show that the distribution doesn’t change with the amount of flies, so that every group could be used for the experiments. Finally an amount of 80 flies was chosen.
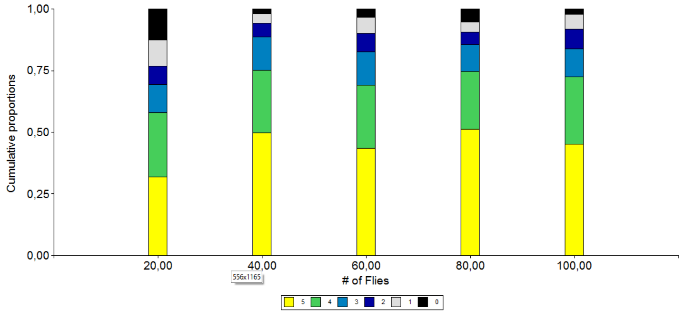
Fig. 3 Proportions Benzer
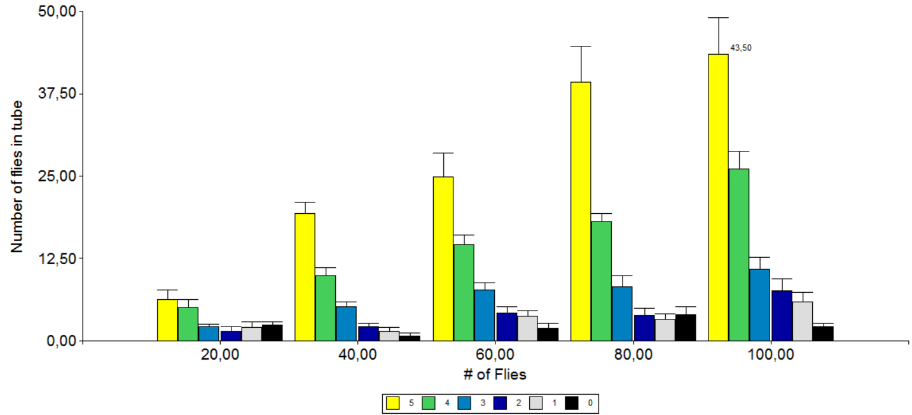
Fig. 4 #flies in Benzer
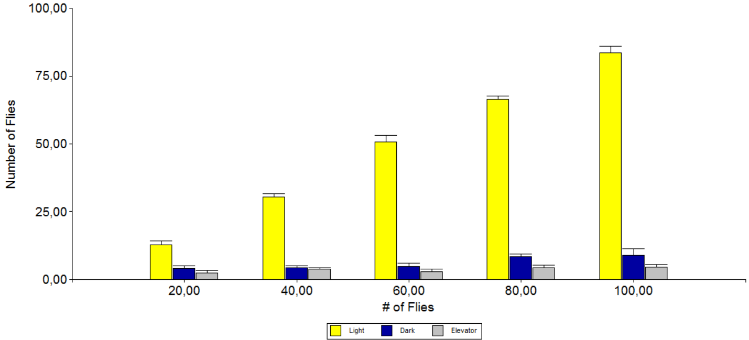
Fig 5. Proportions T-maze
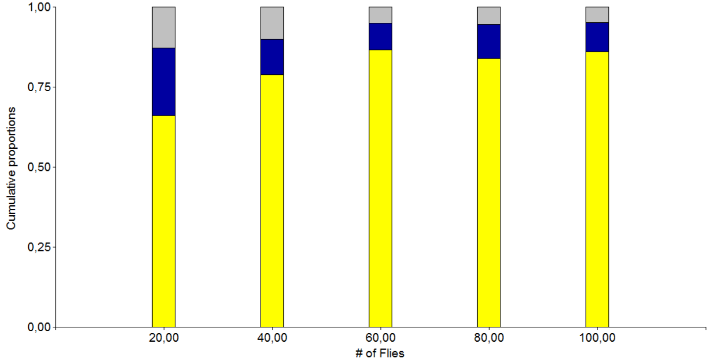
Fig. 6 #flies in t-maze
For the second experiment I took 8 groups of 80 flies and did with them the Benzer-paradigm. Then all the flies were recollected and tested the next day again. This was done overall for 4 Days.
For these experiments the flies were anesthetized with cold to protect them from damage caused by too much CO2.
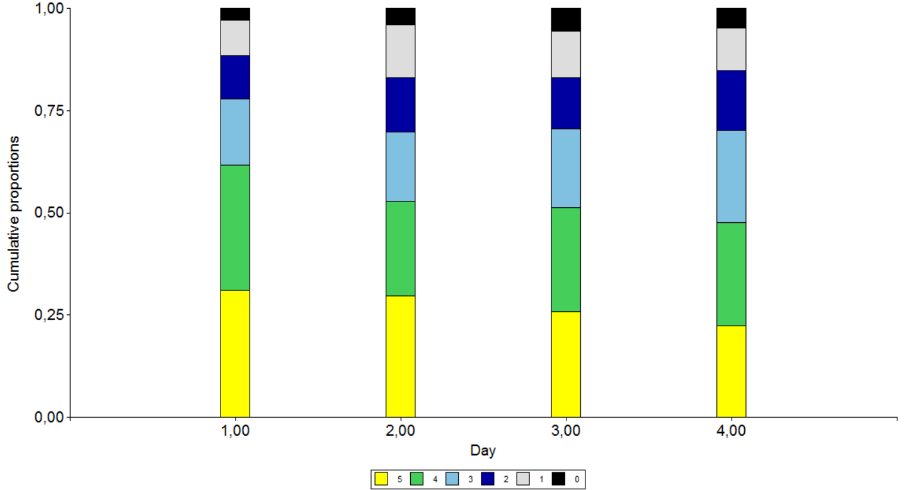
Fig. 7 Proportion & time
The results show clearly that the proportion does not change with the time
A General Buridan Protocol
on Sunday, January 25th, 2015 1:14 | by Yasmine Graf
For newcomers in the lab and mainly students who want to work on the Buridan setup I wrote a protocol that can be used for all kinds of Buridan experiments. Colorful illustrations will be helpful to easily understand the data processing program. Please, download the protocol here: A General Buridan Protocol
Category: buridan, lab.brembs.net, open science, wing clipping | No Comments
New experiments: transparent T-maze
on Wednesday, April 3rd, 2013 9:14 | by Lidia Castro
I have started doing experiments with the transparent T-maze, but I have some problems. The results are really weird: I have obtained negative phototaxis for both flies with intact and clipped wings (phototaxis is more negative for flies with intact wings????).
I did only 9 experiments, because I don’t really know how to run them and I need advice. I am going to explain how I was doing this experiments until now:
– First of all, I put the flies in the entrance tube of the T-maze (upper part) and I cover the T-maze with a black clothing (I want the flies to be adapted to the darkness, like in my last experiments with the opaque T-maze). They are in this situation for 10min.
– After that I push the flies into the elevator. I don’t know if I should let them stay there for 1 minute (like I was doing before with the opaque T-maze, or push them to the bottom of the T-maze to let them make their decision between darkness or light without an adaptation time.
I think that if they stay in the elevator for 1 minute, they will be again under light conditions, and that’s not good for the experiment. I could cover again the T-maze with the black clothing during this minute (that’s what I was doing until now, but with bad results).
– Then I let the flies decide for 30 seconds as always.
So if you have any suggestions, I will be glad to hear them :)
Category: wing clipping | No Comments
New experiments
on Monday, December 10th, 2012 3:01 | by Lidia Castro
I was trying to increase the differences between flies with clipped and intact wings, putting a paper covering the LEDs.
Results are not as good as I expected. The differences are lower than experiments done without this paper between LEDs and flies. I did experiments only with the big white LEDs (the ones which showed better results).
Category: wing clipping | 8 Comments
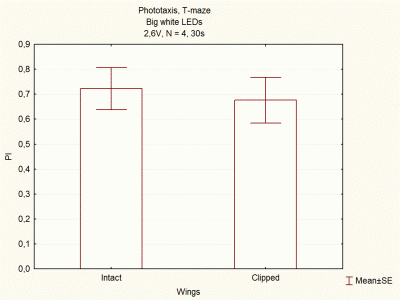
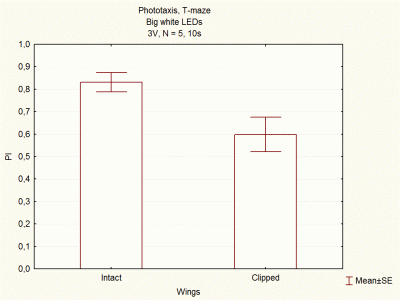
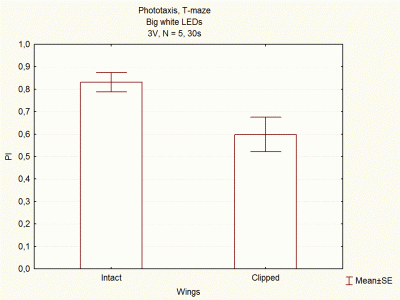
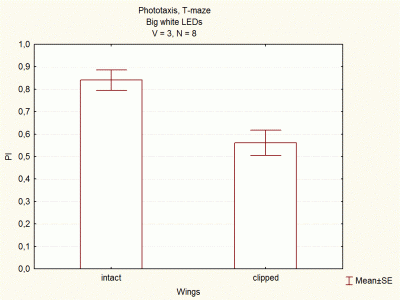
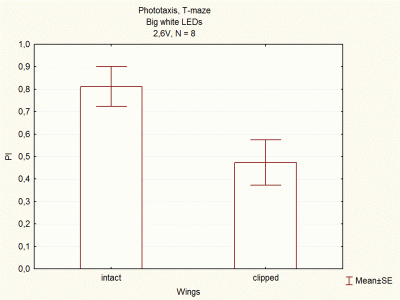
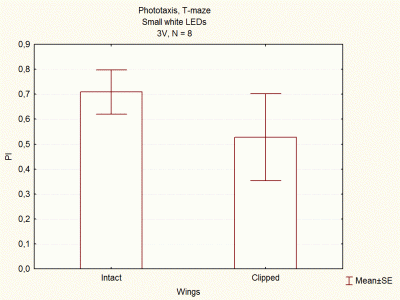
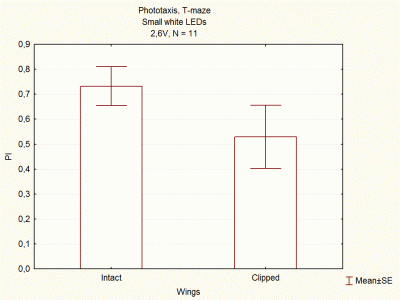
Comparison between voltages and size of white LEDs
on Wednesday, December 5th, 2012 1:33 | by Lidia Castro
I continued doing experiments with big and small white LEDs, and now I think I have done enough experiments to compare them.
These are the final results, which seem to indicate that big white LEDs using 2,6V are the best ones to continue with the experiments.
Category: wing clipping | No Comments