T-Maze
on Tuesday, August 13th, 2019 9:44 | by kader semiz
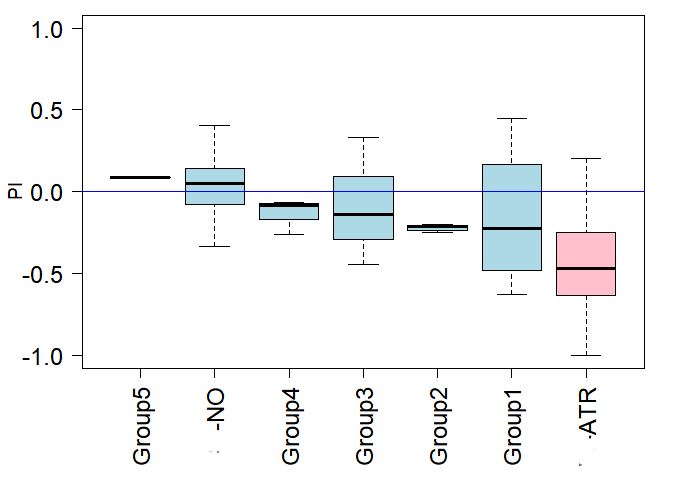
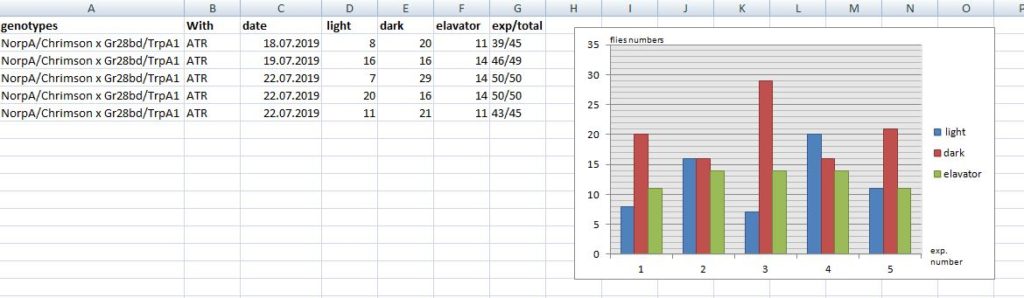
T- maze experiments were done with Norpa/Crimson x Gr28bd/TrpA1 lines without ATR (n=18) and with ATR (n=22) and 5 different groups (THD’-GAL4xNorpA/Crimson with and without ATR, THD1-GAL4xNorpA/Crimson with and without ATR and W[1118]x NorpA/Crimson). Group1 (n=4) Group2(n=4) Group3(n=3) Group4 (n=3) Group5(n=1)We don’t know that the which lines belong to which groups to make the process more reliable. The graph shows the PI numbers according to the T-maze experiments that we have done.

Category: Uncategorized | No Comments
The FPGA does not measure at the preset 60hz, but rather at 60.41hz
on Monday, August 12th, 2019 3:23 | by Anders Eriksson
| Time [s] | 100 | 200 | 300 | 400 | 500 |
| Nr of datapoints | 6040 | 12082 | 18124 | 24164 | 30205 |
| Hz | 60,41 | 60,41 | 60,41333 | 60,41 | 60,4 |
At a set frequence of 60Hz the FPGA overshoots the measurement with .41hz. For a 25 minute experiment as above this means an extra 10.25 seconds.
Category: Uncategorized | No Comments
Results of T-maze experiments
on Monday, August 5th, 2019 12:55 | by kader semiz
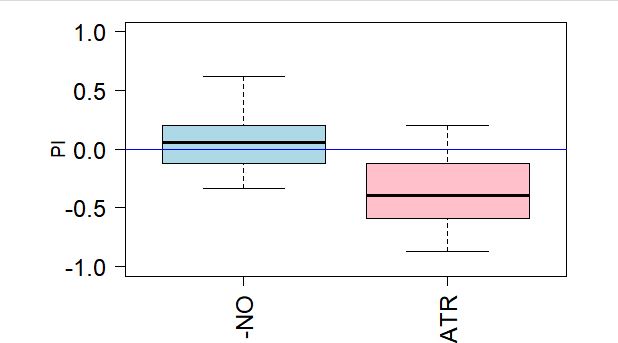
T-maze experiments were done with Norpa/Crimson x Gr28bd/TrpA1 lines without ATR (n=14) and with ATR (n=15) and. The graph shows the PI numbers according to the T-maze experiments that we have done.
Category: Uncategorized | No Comments
Stripe Deviation of flies
on Monday, August 5th, 2019 12:25 | by kader semiz
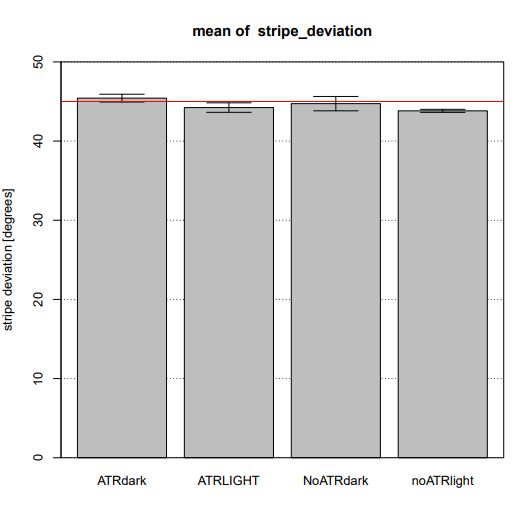
Norpa/Crimson x Gr28bd/TrpA1 lines waited in vials which two of them include ATR and other two not. After doing T- maze experiment (at yellow light) their wings were clipped and next day Buridan test was done with them. This graph shows the stripe deviation of experimented flies. ATR dark(n=3), ATRlight(n=3),NoATRdark(n=4),NoATRlight(n=5). The result shows that experimented flies could not see and their motions were random.
Category: Uncategorized | No Comments
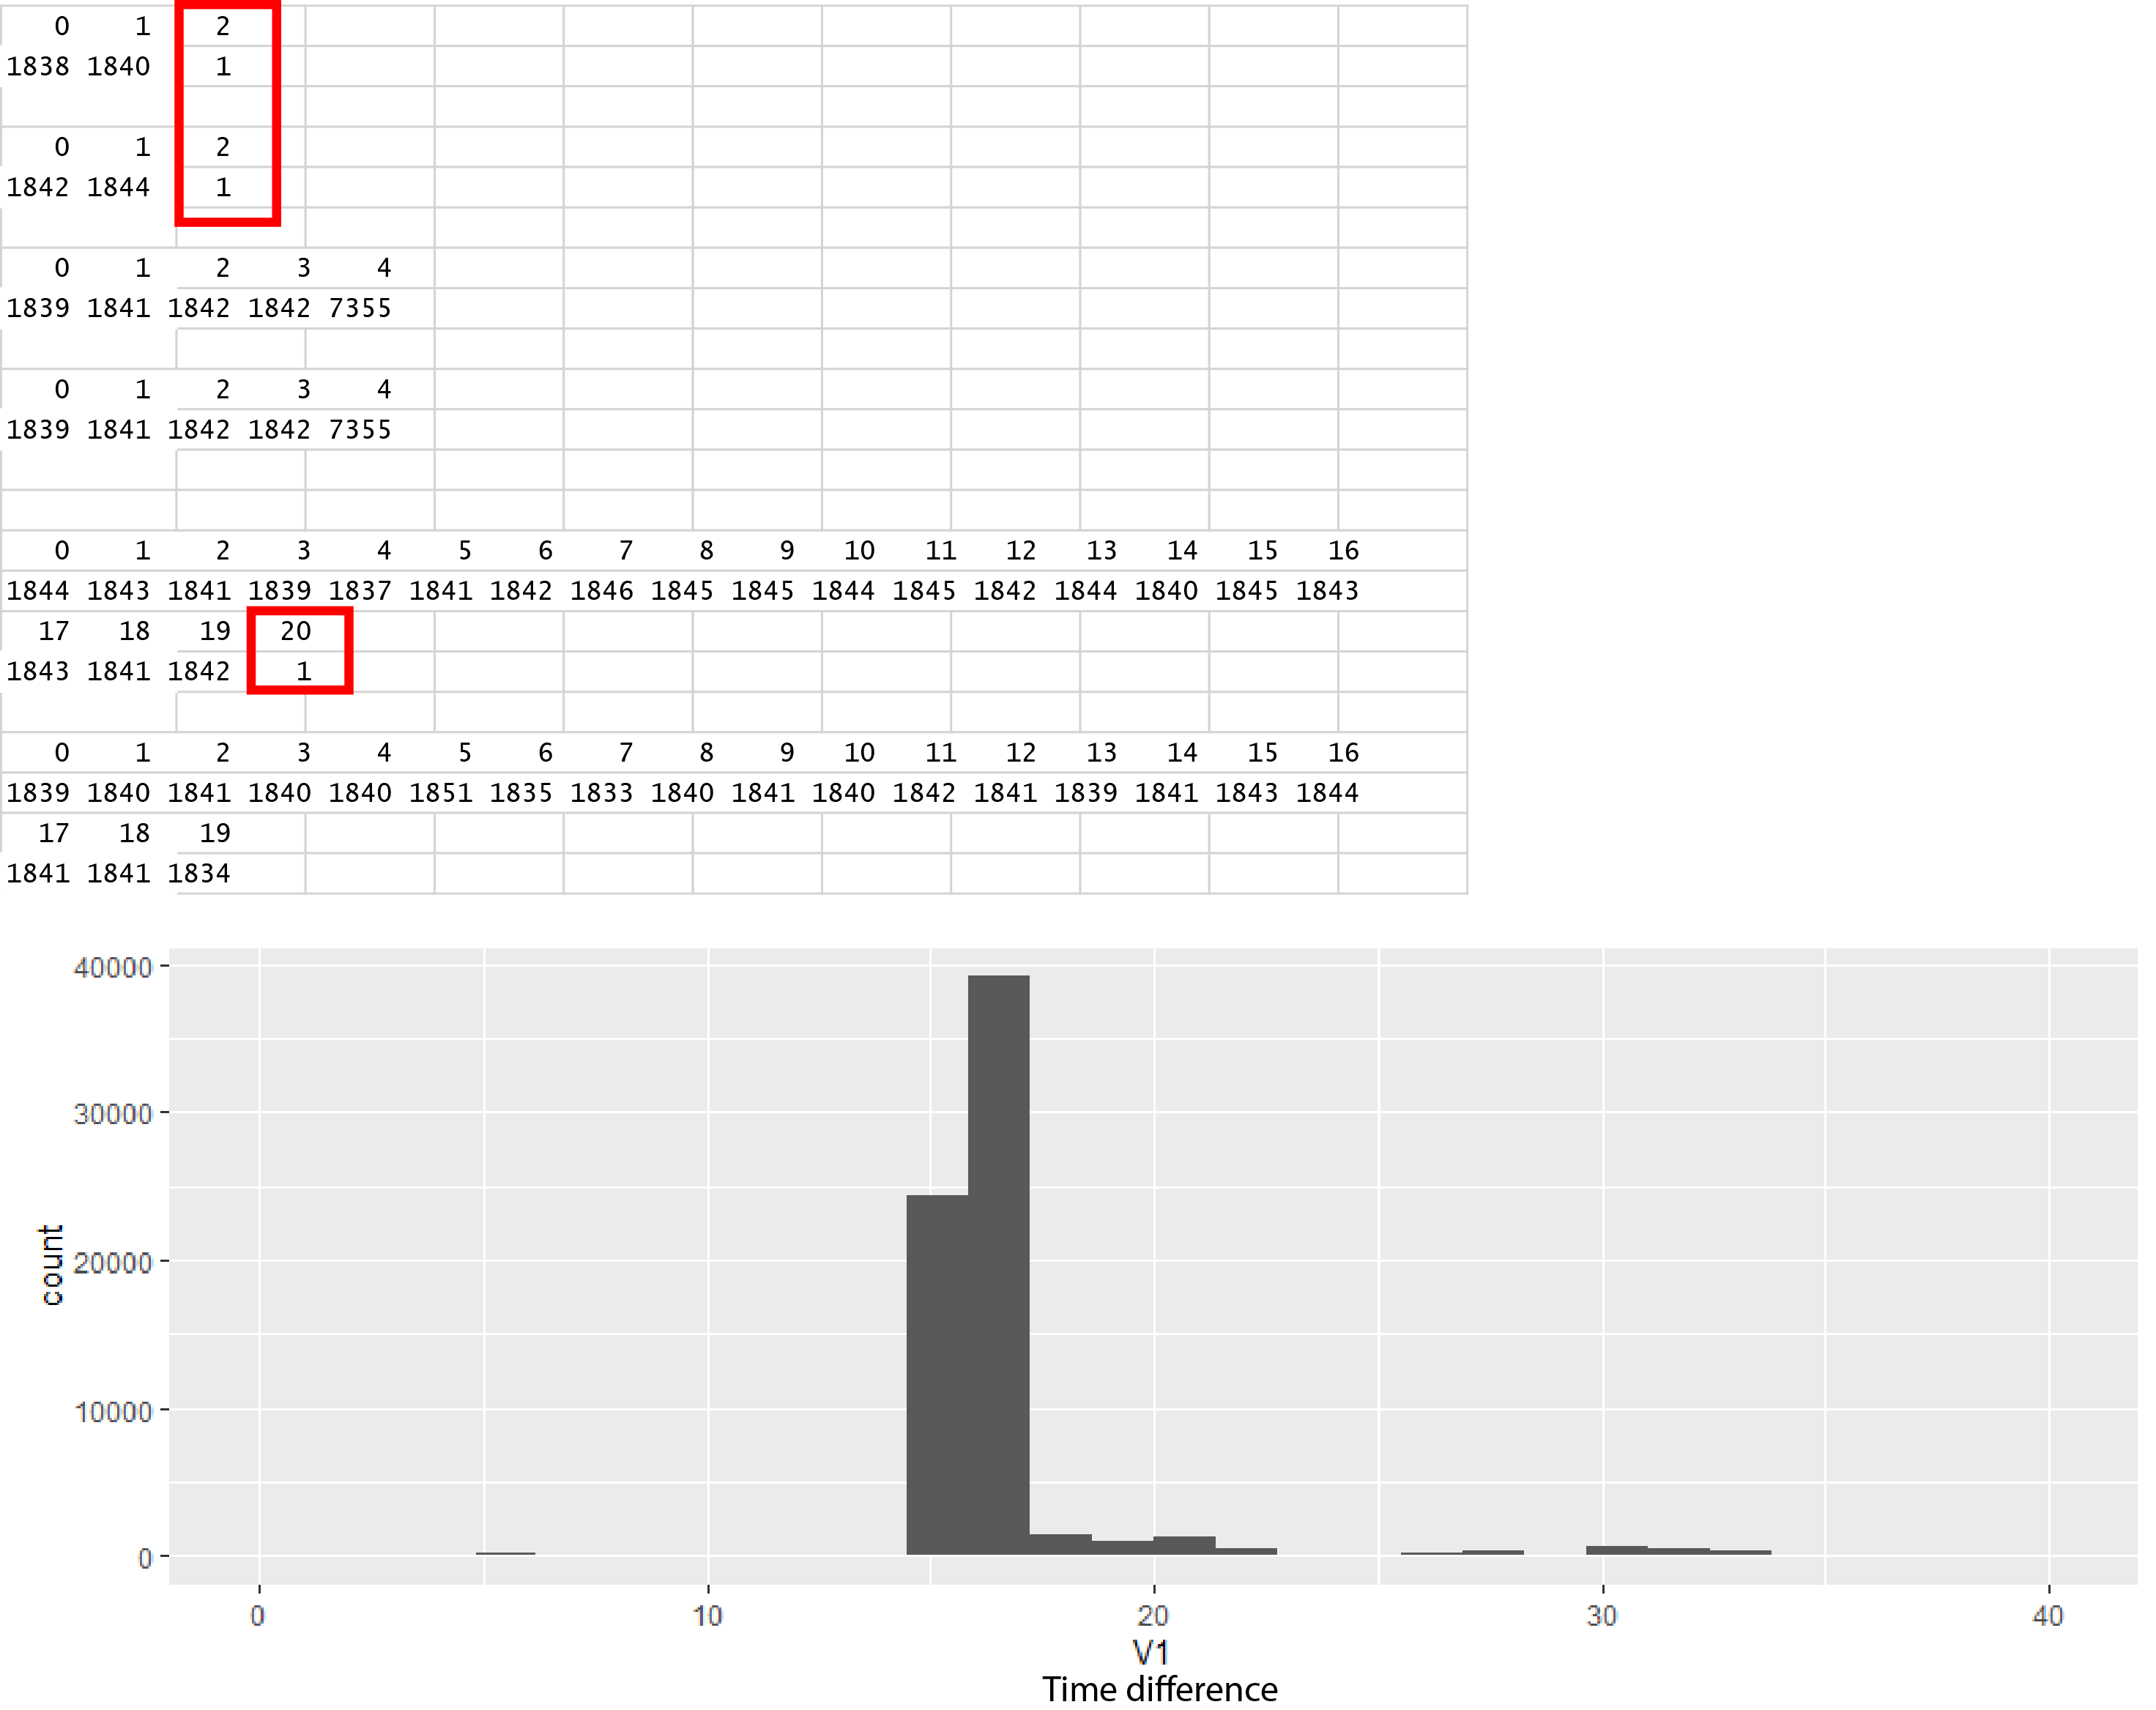
No pattern in time difference spikes, but they seem to coincide with timediff decreases
on Tuesday, July 30th, 2019 10:38 | by Anders Eriksson
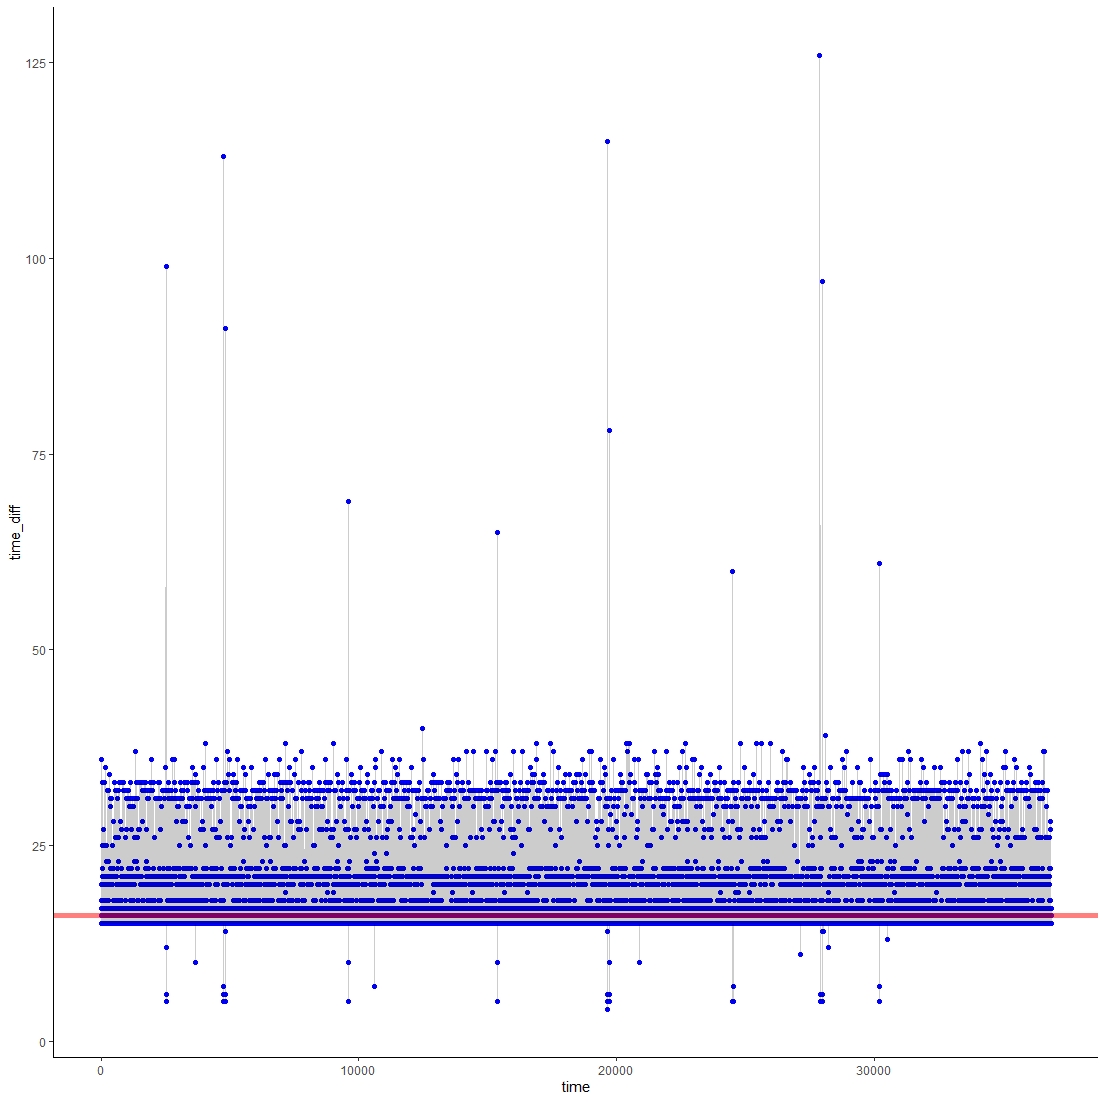
The histogram plotting the time differences in the data collection from the FPGA showed that an absolute majority of the data was collected with the set frequency, 60hz. There were a few outliers from these 16ms and to find out if these spikes occurred with any kind of pattern I plotted the time differences over time. While the increases seems to appear seemingly random, most time diff increases also seem to be accompanied with a time diff decrease.
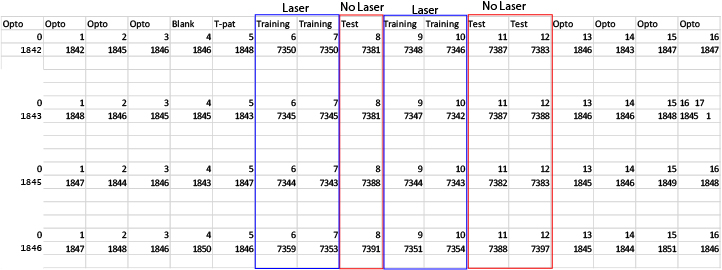
Periods without laser has more data collection points
Category: Uncategorized | No Comments
Increasing data accuracy for FPGA software
on Monday, July 29th, 2019 1:54 | by Anders Eriksson
Category: Uncategorized | No Comments
Heat shock
on Monday, July 22nd, 2019 12:39 | by Andreas Ehweiner
Category: Uncategorized | No Comments
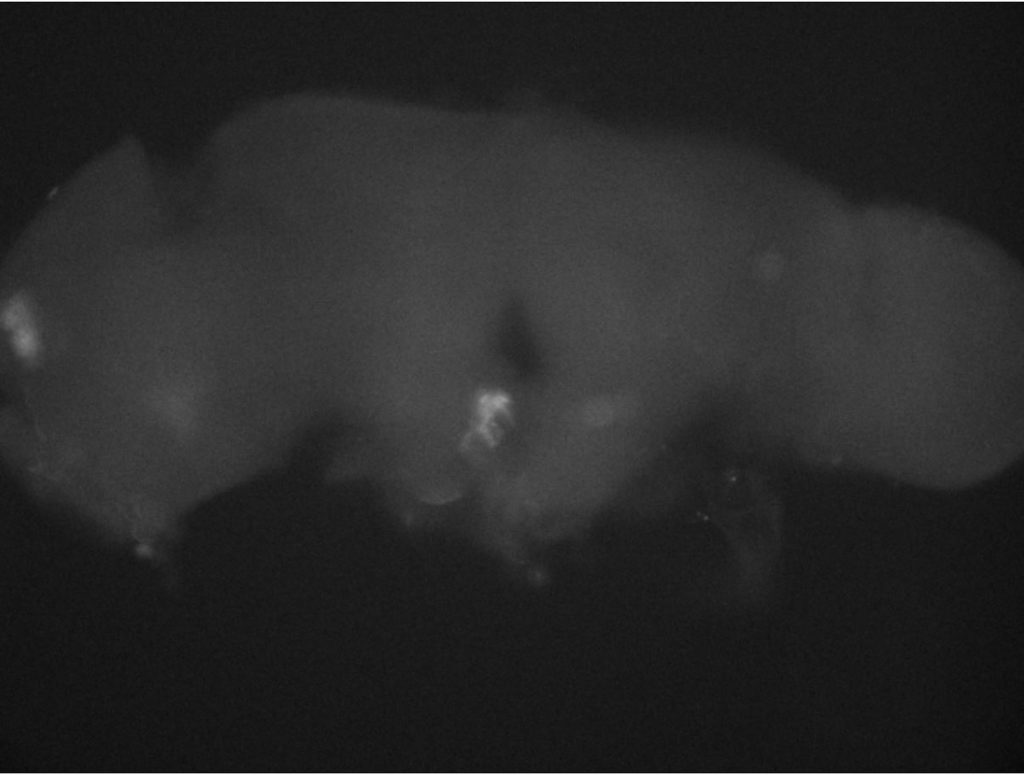
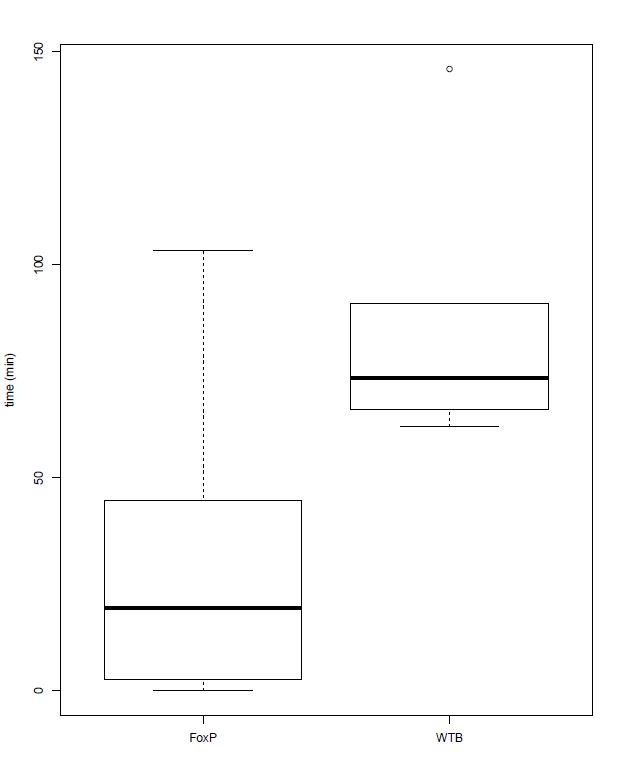
Flight test of FoxP mutant
on Monday, July 22nd, 2019 12:35 | by Andreas Ehweiner
Category: Uncategorized | No Comments
t- mase experiments results of first five experiments
on Monday, July 22nd, 2019 11:10 | by kader semiz
Category: Uncategorized | No Comments
Optimizing optomotor response, part 2
on Friday, May 10th, 2019 4:20 | by Anders Eriksson
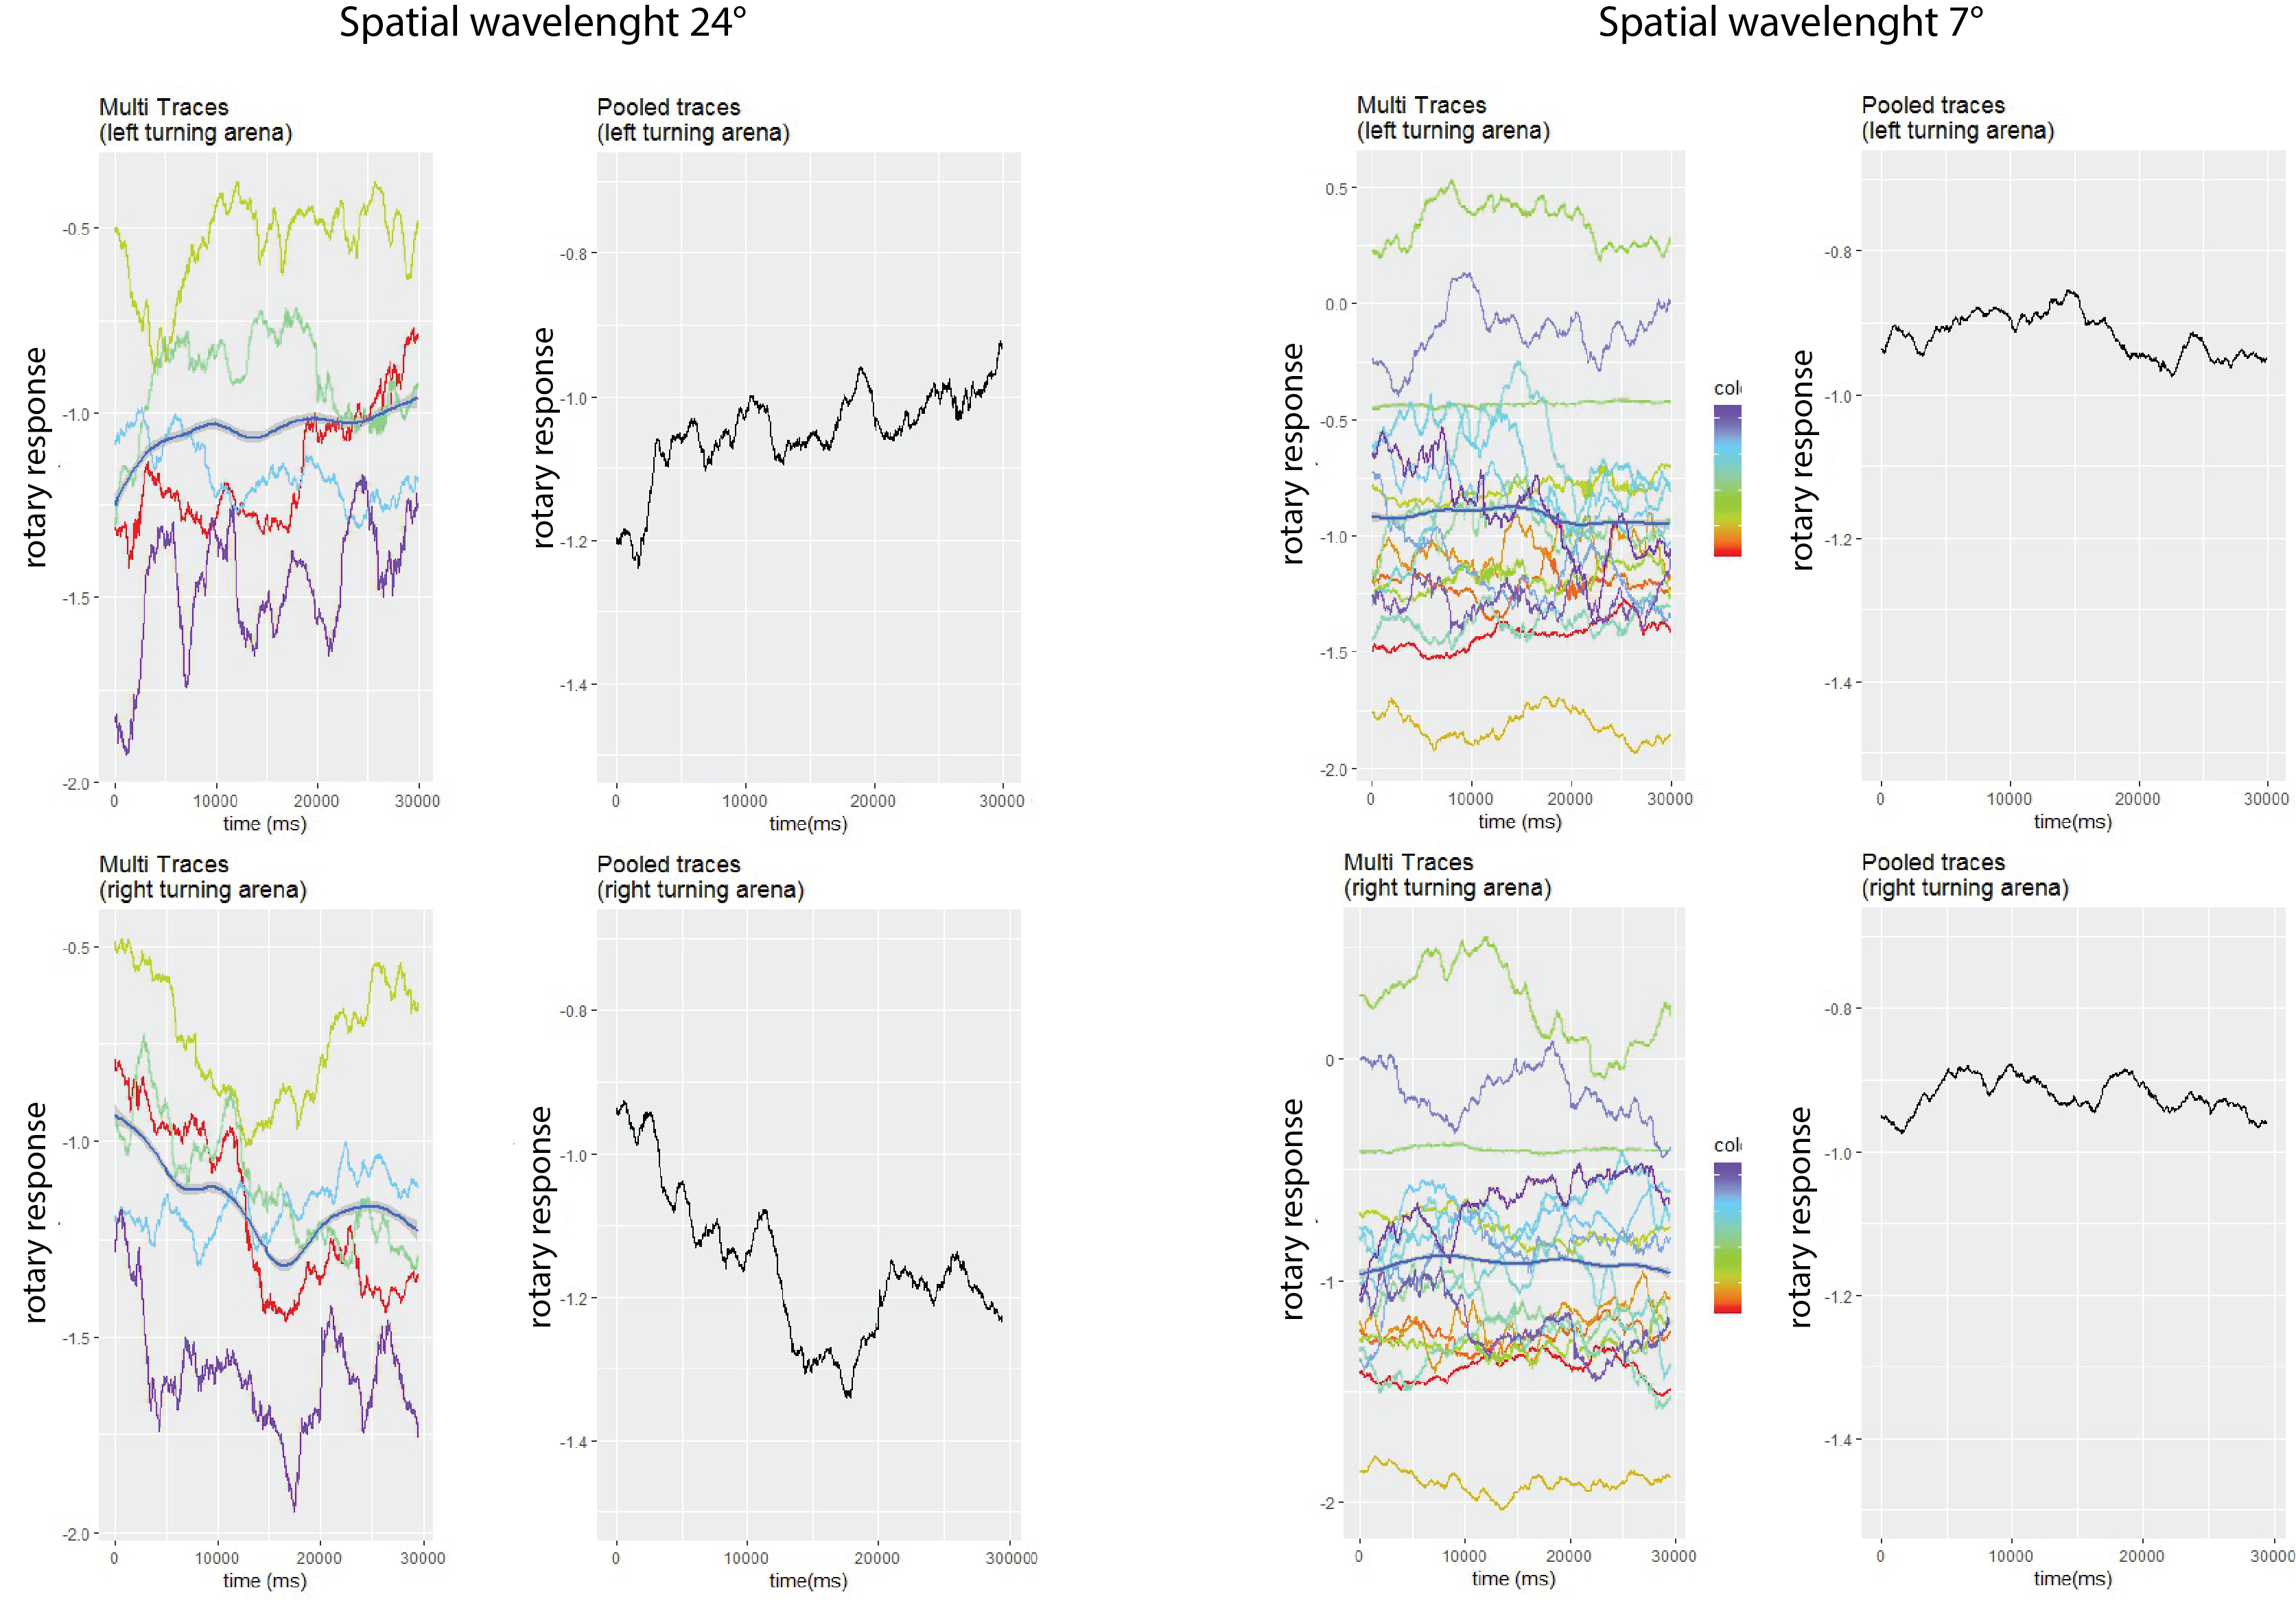
The optomotor stimulus consists of a striped arena with panoramic vertical stripes rotating horizontally around the vertical, or yaw axis. Depending on the spatial wavelenght (or spatial frequency, SF) the fly’s optomotor response (OR) is changing supposedly to reach a maximum between 20-40°
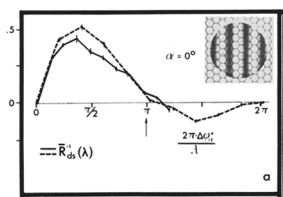
(with a pattern motion of 0° ) . As the panoramic stripes are rotating a tethered fly will actively steer in the direction of the motion. After its maximum the OR gradually decreases with an increasing spatial frequency to finally reach 0 around 9.6-6.3°. A tendency to negative/reversed OR has been observed as the SF reaches 6.3°.
This experiment has been shown before in 1976 by E. Buchner, Elementary movement detectors in an insect visual system. Bioi Cybern 24:85- 101, Figure 8 page 93. Attaching Figure 8 as a reference.
Category: Uncategorized | No Comments